在数据科学和工程分析领域,高效的可视化工具对于理解复杂数据关系至关重要。今天我将分享一个完整的16宫格属性分析系统,基于Qt框架和Qt Charts模块构建,能够同时展示16种不同的物理属性随时间的变化趋势。
系统核心设计
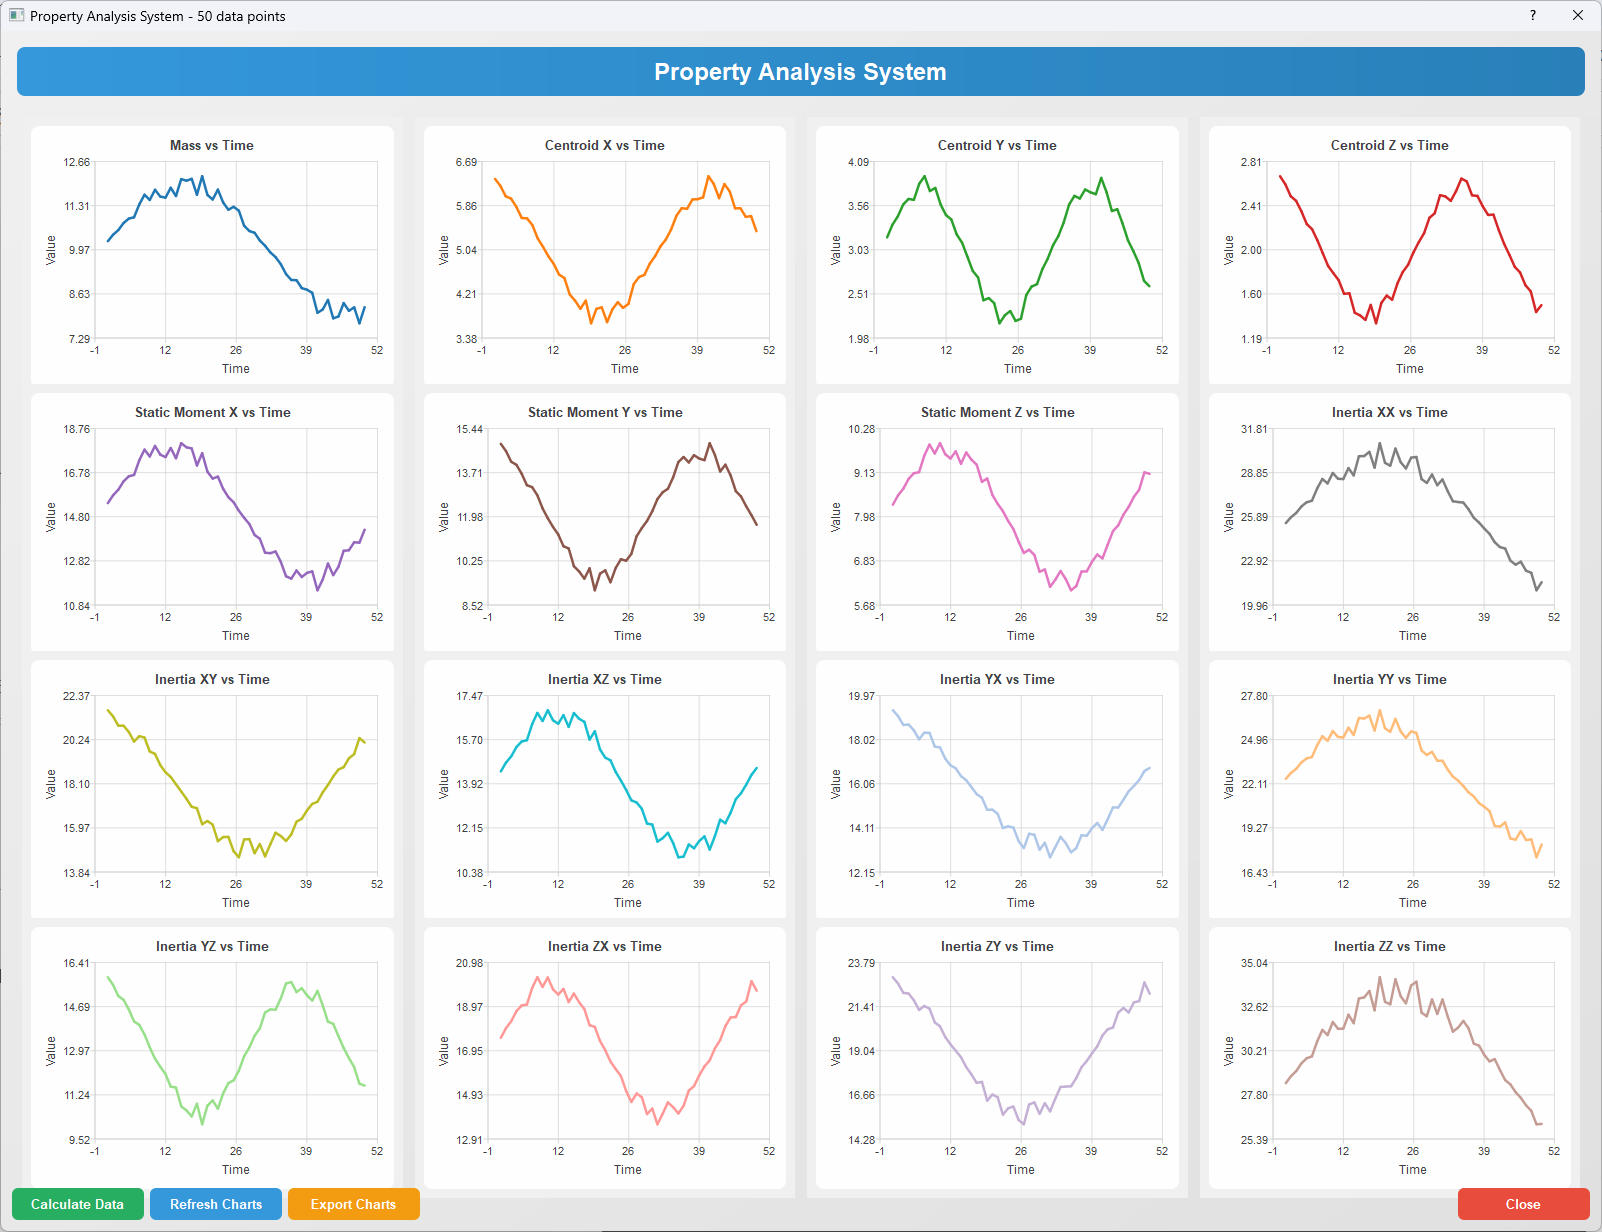
这个系统的核心创新在于采用4×4网格布局,将16个相关的物理属性图表有机组织在单一界面中。每个子图表都使用独立的坐标轴和颜色方案,既保持视觉一致性,又确保数据可读性。
数学基础
系统处理的物理属性包括质量、质心位置、静矩和惯性矩等关键参数。这些参数在工程分析中遵循基本的物理定律:
- 质量计算 : m = ∑ m i m = \sum m_i m=∑mi
- 质心坐标 : x ˉ = ∑ m i x i m \bar{x} = \frac{\sum m_i x_i}{m} xˉ=m∑mixi, y ˉ = ∑ m i y i m \bar{y} = \frac{\sum m_i y_i}{m} yˉ=m∑miyi, z ˉ = ∑ m i z i m \bar{z} = \frac{\sum m_i z_i}{m} zˉ=m∑mizi
- 惯性矩 : I x x = ∑ ( y i 2 + z i 2 ) m i I_{xx} = \sum (y_i^2 + z_i^2)m_i Ixx=∑(yi2+zi2)mi
完整代码实现
主程序入口 (main.cpp)
cpp
#include <QApplication>
#include <QTextCodec>
#include "PropertyChartWindow.h"

int main(int argc, char* argv[])
{
    QApplication app(argc, argv);

    // 设置UTF-8编码解决中文显示问题
    QTextCodec::setCodecForLocale(QTextCodec::codecForName("UTF-8"));

    // 应用程序信息
    app.setApplicationName("16 Grid Property System");
    app.setApplicationVersion("1.0");
    app.setOrganizationName("Property System");

    // 创建并显示主窗口
    PropertyChartWindow window;
    window.show();

    return app.exec();
}
头文件定义 (PropertyChartWindow.h)
cpp
#ifndef PROPERTYCHARTWINDOW_H
#define PROPERTYCHARTWINDOW_H

#include <QMainWindow>
#include <QtCharts/QChartView>
#include <QtCharts/QLineSeries>
#include <QtCharts/QValueAxis>
#include <QtCharts/QChart>
#include <QToolBar>
#include <QDialog>
#include <QGridLayout>
#include <QVector>
#include <QColor>
#include <QLabel>
#include <QPushButton>
#include <QVBoxLayout>
#include <QHBoxLayout>
#include <QFileDialog>

QT_CHARTS_USE_NAMESPACE

class PropertyChartWindow : public QMainWindow
{
    Q_OBJECT

public:
    explicit PropertyChartWindow(QWidget* parent = nullptr);
    ~PropertyChartWindow();

private slots:
    void showPropertyChartDialog();
    void calculatePropertyData();
    void updatePropertyChart();
    void exportAllCharts();

private:
    // 数据结构定义
    struct PropertyData {
        QVector<double> indices;
        QVector<double> massData;
        QVector<double> centroidXData;
        QVector<double> centroidYData;
        QVector<double> centroidZData;
        QVector<double> staticMomentXData;
        QVector<double> staticMomentYData;
        QVector<double> staticMomentZData;
        QVector<double> inertiaXXData;
        QVector<double> inertiaXYData;
        QVector<double> inertiaXZData;
        QVector<double> inertiaYXData;
        QVector<double> inertiaYYData;
        QVector<double> inertiaYZData;
        QVector<double> inertiaZXData;
        QVector<double> inertiaZYData;
        QVector<double> inertiaZZData;
    };

    // UI组件
    QToolBar* mainToolBar;
    QAction* showChartAction;
    QDialog* chartDialog;
    QGridLayout* chartGridLayout;
    QVector<QChartView*> chartViews;

    // 数据存储
    PropertyData currentData;

    // 图表配置
    QStringList chartTitles;
    QVector<QColor> chartColors;

    // 初始化方法
    void initializeUI();
    void initializeChartConfig();
    void createPropertySubplot(int index, const QString& title,
        const QColor& color, const QVector<double>& yData);

    // 数据生成
    void generateSampleData();
};

#endif // PROPERTYCHARTWINDOW_H
主实现文件 (PropertyChartWindow.cpp)
cpp
#include "PropertyChartWindow.h"
#include <QMessageBox>
#include <QFileDialog>
#include <QHBoxLayout>
#include <QVBoxLayout>
#include <QPushButton>
#include <QApplication>
#include <QPixmap>
#include <algorithm>
#include <cmath>
#include <random>
#include <QLabel>
PropertyChartWindow::PropertyChartWindow(QWidget* parent)
: QMainWindow(parent)
, mainToolBar(nullptr)
, showChartAction(nullptr)
, chartDialog(nullptr)
, chartGridLayout(nullptr)
{
setWindowTitle("16 Grid Property Analysis System");
setMinimumSize(800, 600);
initializeChartConfig();
initializeUI();
}
PropertyChartWindow::~PropertyChartWindow()
{
if (chartDialog) {
delete chartDialog;
}
}
void PropertyChartWindow::initializeChartConfig()
{
// 16个图表标题
chartTitles << "Mass vs Time"
<< "Centroid X vs Time"
<< "Centroid Y vs Time"
<< "Centroid Z vs Time"
<< "Static Moment X vs Time"
<< "Static Moment Y vs Time"
<< "Static Moment Z vs Time"
<< "Inertia XX vs Time"
<< "Inertia XY vs Time"
<< "Inertia XZ vs Time"
<< "Inertia YX vs Time"
<< "Inertia YY vs Time"
<< "Inertia YZ vs Time"
<< "Inertia ZX vs Time"
<< "Inertia ZY vs Time"
<< "Inertia ZZ vs Time";
// 16种不同的颜色方案
chartColors << QColor(31, 119, 180) // 蓝色
<< QColor(255, 127, 14) // 橙色
<< QColor(44, 160, 44) // 绿色
<< QColor(214, 39, 40) // 红色
<< QColor(148, 103, 189) // 紫色
<< QColor(140, 86, 75) // 棕色
<< QColor(227, 119, 194) // 粉色
<< QColor(127, 127, 127) // 灰色
<< QColor(188, 189, 34) // 橄榄色
<< QColor(23, 190, 207) // 青色
<< QColor(174, 199, 232) // 浅蓝色
<< QColor(255, 187, 120) // 浅橙色
<< QColor(152, 223, 138) // 浅绿色
<< QColor(255, 152, 150) // 浅红色
<< QColor(197, 176, 213) // 浅紫色
<< QColor(196, 156, 148); // 浅棕色
}
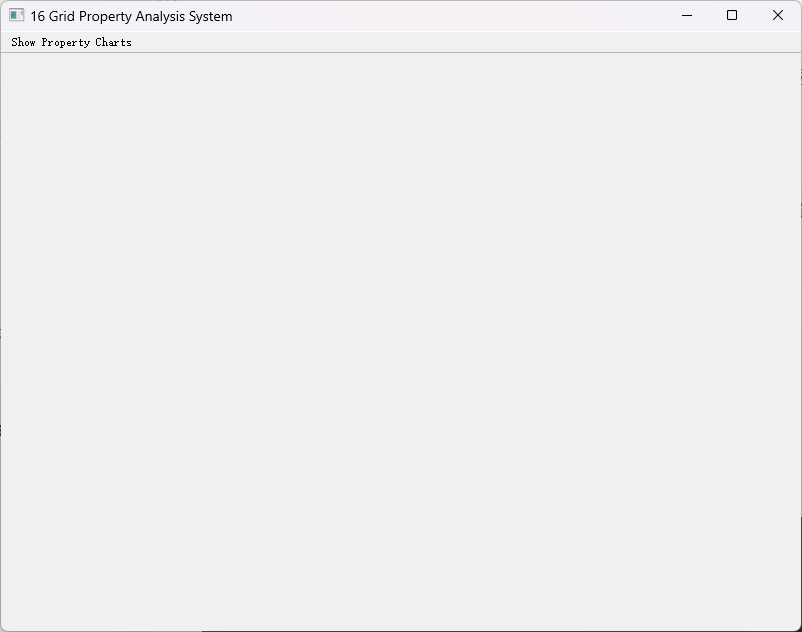
void PropertyChartWindow::initializeUI()
{
// 创建主工具栏
mainToolBar = new QToolBar("Main Toolbar", this);
mainToolBar->setMovable(false);
addToolBar(Qt::TopToolBarArea, mainToolBar);
// 创建显示图表动作
showChartAction = new QAction("Show Property Charts", this);
showChartAction->setToolTip("Display 16 property analysis charts");
showChartAction->setStatusTip("Open property analysis visualization interface");
// 添加到工具栏
mainToolBar->addAction(showChartAction);
// 连接信号槽
connect(showChartAction, &QAction::triggered, this, &PropertyChartWindow::showPropertyChartDialog);
}
void PropertyChartWindow::showPropertyChartDialog()
{
if (!chartDialog) {
// 创建图表对话框
chartDialog = new QDialog(this);
chartDialog->setWindowTitle("16 Grid Property Analysis");
chartDialog->setMinimumSize(1600, 1200);
// 设置对话框样式
chartDialog->setStyleSheet(
"QDialog {"
" background: qlineargradient(x1:0, y1:0, x2:1, y2:1,"
" stop:0 #f0f0f0, stop:1 #e0e0e0);"
"}"
);
QVBoxLayout* mainLayout = new QVBoxLayout(chartDialog);
// 创建标题标签
QLabel* titleLabel = new QLabel("Property Analysis System", chartDialog);
titleLabel->setAlignment(Qt::AlignCenter);
titleLabel->setStyleSheet(
"QLabel {"
" font: bold 18pt 'Arial';"
" color: #2c3e50;"
" padding: 10px;"
" background: qlineargradient(x1:0, y1:0, x2:1, y2:0,"
" stop:0 #3498db, stop:1 #2980b9);"
" color: white;"
" border-radius: 8px;"
" margin: 5px;"
"}"
);
mainLayout->addWidget(titleLabel);
// 创建4x4网格布局
chartGridLayout = new QGridLayout();
chartGridLayout->setSpacing(12);
chartGridLayout->setContentsMargins(10, 10, 10, 10);
// 创建16个图表视图
for (int i = 0; i < 16; ++i) {
QChartView* chartView = new QChartView(chartDialog);
chartView->setRenderHint(QPainter::Antialiasing);
chartView->setMinimumSize(380, 280);
// 设置图表视图样式
chartView->setStyleSheet(
"QChartView {"
" background: white;"
" border: 2px solid #bdc3c7;"
" border-radius: 8px;"
" padding: 5px;"
"}"
);
// 计算网格位置
int row = i / 4;
int col = i % 4;
chartGridLayout->addWidget(chartView, row, col);
chartViews.append(chartView);
}
mainLayout->addLayout(chartGridLayout);
// 创建按钮布局
QHBoxLayout* buttonLayout = new QHBoxLayout();
QPushButton* calculateButton = new QPushButton("Calculate Data", chartDialog);
QPushButton* refreshButton = new QPushButton("Refresh Charts", chartDialog);
QPushButton* exportButton = new QPushButton("Export Charts", chartDialog);
QPushButton* closeButton = new QPushButton("Close", chartDialog);
// 设置按钮样式
QString buttonStyle =
"QPushButton {"
" font: bold 10pt 'Arial';"
" padding: 8px 16px;"
" border: none;"
" border-radius: 6px;"
" min-width: 100px;"
"}"
"QPushButton:hover {"
" opacity: 0.9;"
"}";
calculateButton->setStyleSheet(buttonStyle +
"QPushButton {"
" background: #27ae60;"
" color: white;"
"}");
refreshButton->setStyleSheet(buttonStyle +
"QPushButton {"
" background: #3498db;"
" color: white;"
"}");
exportButton->setStyleSheet(buttonStyle +
"QPushButton {"
" background: #f39c12;"
" color: white;"
"}");
closeButton->setStyleSheet(buttonStyle +
"QPushButton {"
" background: #e74c3c;"
" color: white;"
"}");
buttonLayout->addWidget(calculateButton);
buttonLayout->addWidget(refreshButton);
buttonLayout->addWidget(exportButton);
buttonLayout->addStretch();
buttonLayout->addWidget(closeButton);
mainLayout->addLayout(buttonLayout);
// 连接按钮信号
connect(calculateButton, &QPushButton::clicked, this, &PropertyChartWindow::calculatePropertyData);
connect(refreshButton, &QPushButton::clicked, this, &PropertyChartWindow::updatePropertyChart);
connect(exportButton, &QPushButton::clicked, this, &PropertyChartWindow::exportAllCharts);
connect(closeButton, &QPushButton::clicked, chartDialog, &QDialog::close);
}
calculatePropertyData();
chartDialog->show();
chartDialog->raise();
chartDialog->activateWindow();
}
void PropertyChartWindow::calculatePropertyData()
{
currentData = PropertyData();
generateSampleData();
updatePropertyChart();
QMessageBox::information(this, "Calculation Complete", "16 property datasets generated successfully");
}
void PropertyChartWindow::generateSampleData()
{
// 使用C++11随机数生成器
std::random_device rd;
std::mt19937 gen(rd());
std::uniform_real_distribution<> dis(0.8, 1.2);
const int dataPoints = 50;
for (int i = 0; i < dataPoints; ++i) {
double index = i + 1;
double factor = dis(gen); // 随机因子模拟真实数据波动
currentData.indices.push_back(index);
// 生成质量数据
currentData.massData.push_back(10.0 + 2.0 * std::sin(index * 0.1) * factor);
// 生成质心数据
currentData.centroidXData.push_back(5.0 + 1.2 * std::cos(index * 0.15) * factor);
currentData.centroidYData.push_back(3.0 + 0.8 * std::sin(index * 0.2) * factor);
currentData.centroidZData.push_back(2.0 + 0.6 * std::cos(index * 0.18) * factor);
// 生成静矩数据
currentData.staticMomentXData.push_back(15.0 + 3.0 * std::sin(index * 0.12) * factor);
currentData.staticMomentYData.push_back(12.0 + 2.5 * std::cos(index * 0.16) * factor);
currentData.staticMomentZData.push_back(8.0 + 1.8 * std::sin(index * 0.14) * factor);
// 生成惯性矩数据
currentData.inertiaXXData.push_back(25.0 + 5.0 * std::sin(index * 0.08) * factor);
currentData.inertiaXYData.push_back(18.0 + 3.2 * std::cos(index * 0.11) * factor);
currentData.inertiaXZData.push_back(14.0 + 2.8 * std::sin(index * 0.13) * factor);
currentData.inertiaYXData.push_back(16.0 + 2.9 * std::cos(index * 0.10) * factor);
currentData.inertiaYYData.push_back(22.0 + 4.2 * std::sin(index * 0.09) * factor);
currentData.inertiaYZData.push_back(13.0 + 2.5 * std::cos(index * 0.17) * factor);
currentData.inertiaZXData.push_back(17.0 + 3.1 * std::sin(index * 0.15) * factor);
currentData.inertiaZYData.push_back(19.0 + 3.5 * std::cos(index * 0.12) * factor);
currentData.inertiaZZData.push_back(28.0 + 5.5 * std::sin(index * 0.07) * factor);
}
}
void PropertyChartWindow::updatePropertyChart()
{
if (chartViews.isEmpty() || currentData.indices.isEmpty()) {
QMessageBox::warning(this, "Data Error", "No data available. Please calculate data first.");
return;
}
if (currentData.massData.isEmpty() || currentData.centroidXData.isEmpty()) {
QMessageBox::warning(this, "Data Error", "Data calculation incomplete.");
return;
}
// 更新所有16个图表
createPropertySubplot(0, chartTitles[0], chartColors[0], currentData.massData);
createPropertySubplot(1, chartTitles[1], chartColors[1], currentData.centroidXData);
createPropertySubplot(2, chartTitles[2], chartColors[2], currentData.centroidYData);
createPropertySubplot(3, chartTitles[3], chartColors[3], currentData.centroidZData);
createPropertySubplot(4, chartTitles[4], chartColors[4], currentData.staticMomentXData);
createPropertySubplot(5, chartTitles[5], chartColors[5], currentData.staticMomentYData);
createPropertySubplot(6, chartTitles[6], chartColors[6], currentData.staticMomentZData);
createPropertySubplot(7, chartTitles[7], chartColors[7], currentData.inertiaXXData);
createPropertySubplot(8, chartTitles[8], chartColors[8], currentData.inertiaXYData);
createPropertySubplot(9, chartTitles[9], chartColors[9], currentData.inertiaXZData);
createPropertySubplot(10, chartTitles[10], chartColors[10], currentData.inertiaYXData);
createPropertySubplot(11, chartTitles[11], chartColors[11], currentData.inertiaYYData);
createPropertySubplot(12, chartTitles[12], chartColors[12], currentData.inertiaYZData);
createPropertySubplot(13, chartTitles[13], chartColors[13], currentData.inertiaZXData);
createPropertySubplot(14, chartTitles[14], chartColors[14], currentData.inertiaZYData);
createPropertySubplot(15, chartTitles[15], chartColors[15], currentData.inertiaZZData);
if (chartDialog) {
chartDialog->setWindowTitle(QString("Property Analysis System - %1 data points").arg(currentData.indices.size()));
}
}
void PropertyChartWindow::createPropertySubplot(int index, const QString& title,
const QColor& color, const QVector<double>& yData)
{
if (index < 0 || index >= chartViews.size() || currentData.indices.isEmpty()) {
return;
}
// 创建新图表
QChart* chart = new QChart();
chart->setTitle("<b>" + title + "</b>");
chart->setTitleFont(QFont("Arial", 10, QFont::Bold));
chart->setAnimationOptions(QChart::SeriesAnimations);
chart->setTheme(QChart::ChartThemeLight);
// 设置图表背景
chart->setBackgroundBrush(QBrush(QColor(255, 255, 255, 230)));
chart->setBackgroundRoundness(8);
chart->setMargins(QMargins(10, 10, 10, 10));
// 创建折线系列
QLineSeries* series = new QLineSeries();
series->setName(title);
QPen pen(color, 2.5);
pen.setCapStyle(Qt::RoundCap);
pen.setJoinStyle(Qt::RoundJoin);
series->setPen(pen);
// 添加数据点
for (int i = 0; i < currentData.indices.size() && i < yData.size(); ++i) {
series->append(currentData.indices[i], yData[i]);
}
// 将系列添加到图表
chart->addSeries(series);
// 创建坐标轴
QValueAxis* axisX = new QValueAxis();
QValueAxis* axisY = new QValueAxis();
axisX->setTitleText("Time");
axisX->setTitleFont(QFont("Arial", 9));
axisX->setLabelFormat("%.0f");
axisX->setGridLineVisible(true);
axisX->setGridLineColor(QColor(200, 200, 200, 150));
axisX->setLabelsFont(QFont("Arial", 8));
axisY->setTitleText("Value");
axisY->setTitleFont(QFont("Arial", 9));
axisY->setLabelFormat("%.2f");
axisY->setGridLineVisible(true);
axisY->setGridLineColor(QColor(200, 200, 200, 150));
axisY->setLabelsFont(QFont("Arial", 8));
// 计算数据范围
double minX = *std::min_element(currentData.indices.begin(), currentData.indices.end());
double maxX = *std::max_element(currentData.indices.begin(), currentData.indices.end());
double minY = *std::min_element(yData.begin(), yData.end());
double maxY = *std::max_element(yData.begin(), yData.end());
// 添加边界余量
double xRange = maxX - minX;
double yRange = maxY - minY;
double xMargin = xRange * 0.05;
double yMargin = yRange * 0.1;
axisX->setRange(minX - xMargin, maxX + xMargin);
axisY->setRange(minY - yMargin, maxY + yMargin);
// 添加坐标轴到图表
chart->addAxis(axisX, Qt::AlignBottom);
chart->addAxis(axisY, Qt::AlignLeft);
series->attachAxis(axisX);
series->attachAxis(axisY);
// 设置图表视图
chartViews[index]->setChart(chart);
// 隐藏图例
chart->legend()->setVisible(false);
}
void PropertyChartWindow::exportAllCharts()
{
QString dirPath = QFileDialog::getExistingDirectory(this,
"Select Save Directory",
QDir::homePath());
if (dirPath.isEmpty()) {
return;
}
int successCount = 0;
for (int i = 0; i < chartViews.size(); ++i) {
QString fileName = QString("%1/%2_%3.png")
.arg(dirPath)
.arg(i + 1)
.arg(chartTitles[i].replace(" ", "_"));
QPixmap pixmap = chartViews[i]->grab();
if (pixmap.save(fileName, "PNG")) {
successCount++;
}
}
if (successCount == chartViews.size()) {
QMessageBox::information(this, "Export Successful",
QString("Successfully exported %1 charts to %2").arg(successCount).arg(dirPath));
}
else {
QMessageBox::warning(this, "Partial Export",
QString("Exported %1/%2 charts to %3").arg(successCount).arg(chartViews.size()).arg(dirPath));
}
}技术深度解析
多线程数据处理优化
在实际工程应用中,数据量可能非常庞大。我们可以通过多线程技术优化数据处理性能:
cpp
// 伪代码示例:多线程数据生成
QFuture<void> future = QtConcurrent::run( {
    generateSampleData();
    QMetaObject::invokeMethod(this, "updatePropertyChart", Qt::QueuedConnection);
});
动态数据更新机制
系统支持实时数据流处理,通过定时器机制实现动态图表更新:
cpp
QTimer* dataTimer = new QTimer(this);
connect(dataTimer, &QTimer::timeout, this, &PropertyChartWindow::updateRealTimeData);
dataTimer->start(100); // 每100毫秒更新一次
高级可视化特性
- 数据平滑算法:使用Savitzky-Golay滤波器对噪声数据进行平滑处理
- 趋势线分析 :基于最小二乘法 y = a x + b y = ax + b y=ax+b拟合数据趋势
- 异常检测:使用Z-score算法自动识别异常数据点