创建基本几何对象------点、线、面
点
Point(x,y,z)
查看点的属性和常用方法
point.coords 返回坐标(返回坐标迭代器)
tuple(point.coords) 转换为元组格式
point.bounds 返回点的边界(minx, miny, maxx, maxy)
point.has_z 判断是否有z值
线
LineString(coordinates)
查看线的属性和常用方法
line.coords
tuple(line.coords)
line.length 计算线的长度,单位与坐标单位一致
tuple(line.coords0) 线的起点
tuple(line.coords-1 线的终点
line.bounds
面
Polygon(shell,holes) holes可选
查看面的属性和常用方法
tuple(polygon.exterior.coords) 多边形的外部边界坐标
tuple(polygon.interiors.coords) 多边形的内部孔洞坐标
polygon.area
polygon.length
polygon.bounds
len(polygon.interiors)>0 判断是否包含孔洞
代码示例
python
from shapely.geometry import Point,LineString,Polygon
import geopandas as gpd

#点
point=Point(116.33,25.55)
print(f'坐标:{point.coords}')
print(f'坐标:{tuple(point.coords)}')
print(f'边界:{point.bounds}')
print(f'是否含z值:{point.has_z}')

#线
coords=[
    (116.40,39.91),
    (116.41,39.92),
    (116.42,39.93),
]
line=LineString(coords)
print(f'坐标:{tuple(line.coords)}')
print(f'线的起点:{tuple(line.coords)[0]}')
print(f'线的终点:{tuple(line.coords)[-1]}')
print(f'边界:{line.bounds}')
print(f'长度:{line.length:.4f}')

#多边形
shell=[
    (116.39, 39.90),
    (116.41, 39.90),
    (116.41, 39.92),
    (116.39, 39.92),
    (116.39, 39.90)   #与点1一致,保证封闭
]
hole=[
     (116.395, 39.905),
    (116.405, 39.905),
    (116.405, 39.915),
    (116.395, 39.915),
    (116.395, 39.905)
]
polygon=Polygon(shell,[hole])
print(f'外边界坐标:{tuple(polygon.exterior.coords)}')
print(f'面积:{polygon.area:.4f}')
print(f'周长:{polygon.length:.4f}')
print(f'是否包含孔洞:{len(polygon.interiors)>0}')
print(f'边界:{polygon.bounds}')
print(f'孔洞坐标:{tuple(polygon.interiors[0].coords)}')#返回第一个孔洞的坐标
简单操作代码示例
python
from shapely.geometry import Point,LineString,Polygon
import geopandas as gpd

try:
    shp=r'E:\tempFile\postgis-workshop-2018\data\nyc_census_blocks.shp'
    nyc_census=gpd.read_file(shp)
except FileNotFoundError:
    print('未找到文件')
except UnicodeDecodeError:
    print('中文乱码')
except Exception as e:
    print(f'具体错误:{e}')
else:
    #获取空间参考信息
    print(f'空间参考:{nyc_census.crs}')
    #查看所有字段名称
    fields_name=nyc_census.columns.tolist()
    #提取第一个要素的所有数据,包括字段和值
    feature1=nyc_census.iloc[0]
    for field in fields_name:
        print(f'{field}:{feature1[field]}')
    #提取第一个几何要素
    geom1=nyc_census.geometry.iloc[0]
    print('几何要素类型',type(geom1))
    print('几何要素面积',round(geom1.area,3))
    #提取第一个面要素的中心点
    centroid=geom1.centroid
    print(f'中心点坐标:{centroid.coords[:]}')
    #提取行政区的边界线
    boundary1=geom1.boundary
    print(f'边界线长度:{boundary1.length:.4f}')
判别几何对象的空间关系
相交
a.intersects(b)
包含与被包含
a.contains(b) 判断a是否包含b
b.within(a) 判断b是否完全落在a内,即b是否被a包含
完整代码
在本代码示例中,合并queens的多边形时出现了报错,这是因为参与运算的几何对象存在拓扑无效问题(比如自相交、边界重叠、几何碎片等),导致 GEOS 库(Shapely/GeoPandas 底层的几何运算库)无法正常执行 unary_union 合并。因此需要进行拓扑修复。
python
from shapely.geometry import Point,LineString,Polygon
import geopandas as gpd
from shapely.validation import make_valid  # 导入几何修复函数

try:
    nei=r'E:\tempFile\postgis-workshop-2018\data\nyc_neighborhoods.shp'
    cen=r'E:\tempFile\postgis-workshop-2018\data\nyc_census_blocks.shp'
    sta=r'E:\tempFile\postgis-workshop-2018\data\nyc_subway_stations.shp'
    neigh=gpd.read_file(nei)
    census=gpd.read_file(cen)
    stats=gpd.read_file(sta)
except FileNotFoundError:
    print('未找到文件')
except UnicodeDecodeError:
    print('中文乱码')
except Exception as e:
    print(f'具体错误:{e}')
else:
    #判断两个多边形是否相交
    feature1=neigh[neigh['NAME']=='Flatbush']
    poly1=feature1.geometry.iloc[0]
    poly2=census.geometry.iloc[33485]
    print(f'是否相交:{poly1.intersects(poly2)}')

    #判断两个多边形是否包含
    poly3=census.geometry.iloc[32974]
    print(f'是否包含:{poly1.contains(poly3)}')

    #判断地铁站点是否落在多多边形内
    feature2=neigh[neigh['BORONAME']=='Queens']
    #先标记无效几何
    feature2['valid']=feature2.geometry.is_valid
    invalid_count=len(feature2[~feature2['valid']])
    print(f'发现无效几何数量:{invalid_count}')
    #修复无效几何
    feature2['fixed']=feature2.geometry.apply(lambda geom:make_valid(geom) if not geom.is_valid else geom)
    #替换原geometry列,方便后续操作
    feature2_fixed=feature2.set_geometry('fixed')
    queens_union=feature2_fixed.geometry.unary_union
    stations=(stats.geometry.iloc[:])
    point_in_poly=[]
    for p in stations:
        if p.within(queens_union):
            point_in_poly.append(p)
    print(f'落在queens区域内的地铁站点数量:{len(point_in_poly)}')
扩展生成几何对象------缓冲区、泰森多边形
缓冲区和泰森多边形分别在个人专栏矢量数据的空间分析(二)-CSDN博客和矢量数据的空间分析(四)-CSDN博客已详细记录过。
几何对象的旋转、平移、缩放
旋转
rotate(geom,angle,origin='center',use_radians=False)
平移
translate(geom,xoff=0.0,yoff=0.0)
缩放
scale(geom,xfact=1.0,yfact=1.0)
完整代码
python
import matplotlib.pyplot as plt
import geopandas as gpd
from shapely.affinity import *
import math

try:

    cen=r'E:\tempFile\postgis-workshop-2018\data\nyc_census_blocks.shp'
    census=gpd.read_file(cen)

except FileNotFoundError:
    print('未找到文件')
except UnicodeDecodeError:
    print('中文乱码')
except Exception as e:
    print(f'具体错误:{e}')
else:
    parcel=census.geometry.iloc[2351]
    #计算地块最小外接矩形的角度
    min_rect=parcel.minimum_rotated_rectangle
    rect_coords=min_rect.exterior.coords
    rotate_rad=-math.atan2((rect_coords[1][1]-rect_coords[0][1]),(rect_coords[1][0]-rect_coords[0][0]))
    #旋转使其最小外接矩形水平
    parcel1=rotate(parcel,rotate_rad,origin=parcel.centroid,use_radians=True)
    #缩放
    parcel2=scale(parcel1,xfact=0.85,yfact=0.85,origin=parcel.centroid)
    #平移
    parcel3=translate(parcel2,xoff=6.0,yoff=-50.5)

    #可视化
    plt.rcParams['font.sans-serif']=['SimHei']
    plt.rcParams['axes.unicode_minus']=False
    #plt无法直接绘制shapely几何对象,而GeoSeries/GeoDataFrame 支持直接 plot()
    parcel_geo=gpd.GeoSeries([parcel])
    parcel1_geo=gpd.GeoSeries([parcel1])
    parcel2_geo=gpd.GeoSeries([parcel2])
    parcel3_geo=gpd.GeoSeries([parcel3])

    fig,ax=plt.subplots(2,2,figsize=(14,12))

    ## 计算所有几何对象的总边界,统一所有子图的坐标范围
    all_geoms = gpd.GeoSeries([parcel, parcel1, parcel2, parcel3])
    x_min, y_min, x_max, y_max = all_geoms.total_bounds
    #设置缓冲边界
    x_min-=100
    x_max+=100
    y_min-=100
    y_max+=100

    parcel_geo.plot(ax=ax[0,0],color='green',edgecolor='black',linewidth=2.0)
    ax[0,0].set_title('origin',fontsize=14)
    ax[0,0].set_xlim(x_min, x_max)
    ax[0,0].set_ylim(y_min, y_max)
    ax[0,0].set_aspect('equal')  # 保持坐标比例一致,避免图形变形

    parcel1_geo.plot(ax=ax[0,1],color='green',edgecolor='black',linewidth=2.0)
    ax[0,1].set_title('rotate',fontsize=14)
    ax[0,1].set_xlim(x_min, x_max)
    ax[0,1].set_ylim(y_min, y_max)
    ax[0,1].set_aspect('equal')

    parcel2_geo.plot(ax=ax[1,0],color='green',edgecolor='black',linewidth=2.0)
    ax[1,0].set_title('scale',fontsize=14)
    ax[1,0].set_xlim(x_min, x_max)
    ax[1,0].set_ylim(y_min, y_max)
    ax[1,0].set_aspect('equal')

    parcel3_geo.plot(ax=ax[1,1],color='green',edgecolor='black',linewidth=2.0)
    ax[1,1].set_title('translate',fontsize=14)
    ax[1,1].set_xlim(x_min, x_max)
    ax[1,1].set_ylim(y_min, y_max)
    ax[1,1].set_aspect('equal')

    fig.suptitle('变换对比',fontsize=16,y=0.98)
    plt.tight_layout()
plt.show() 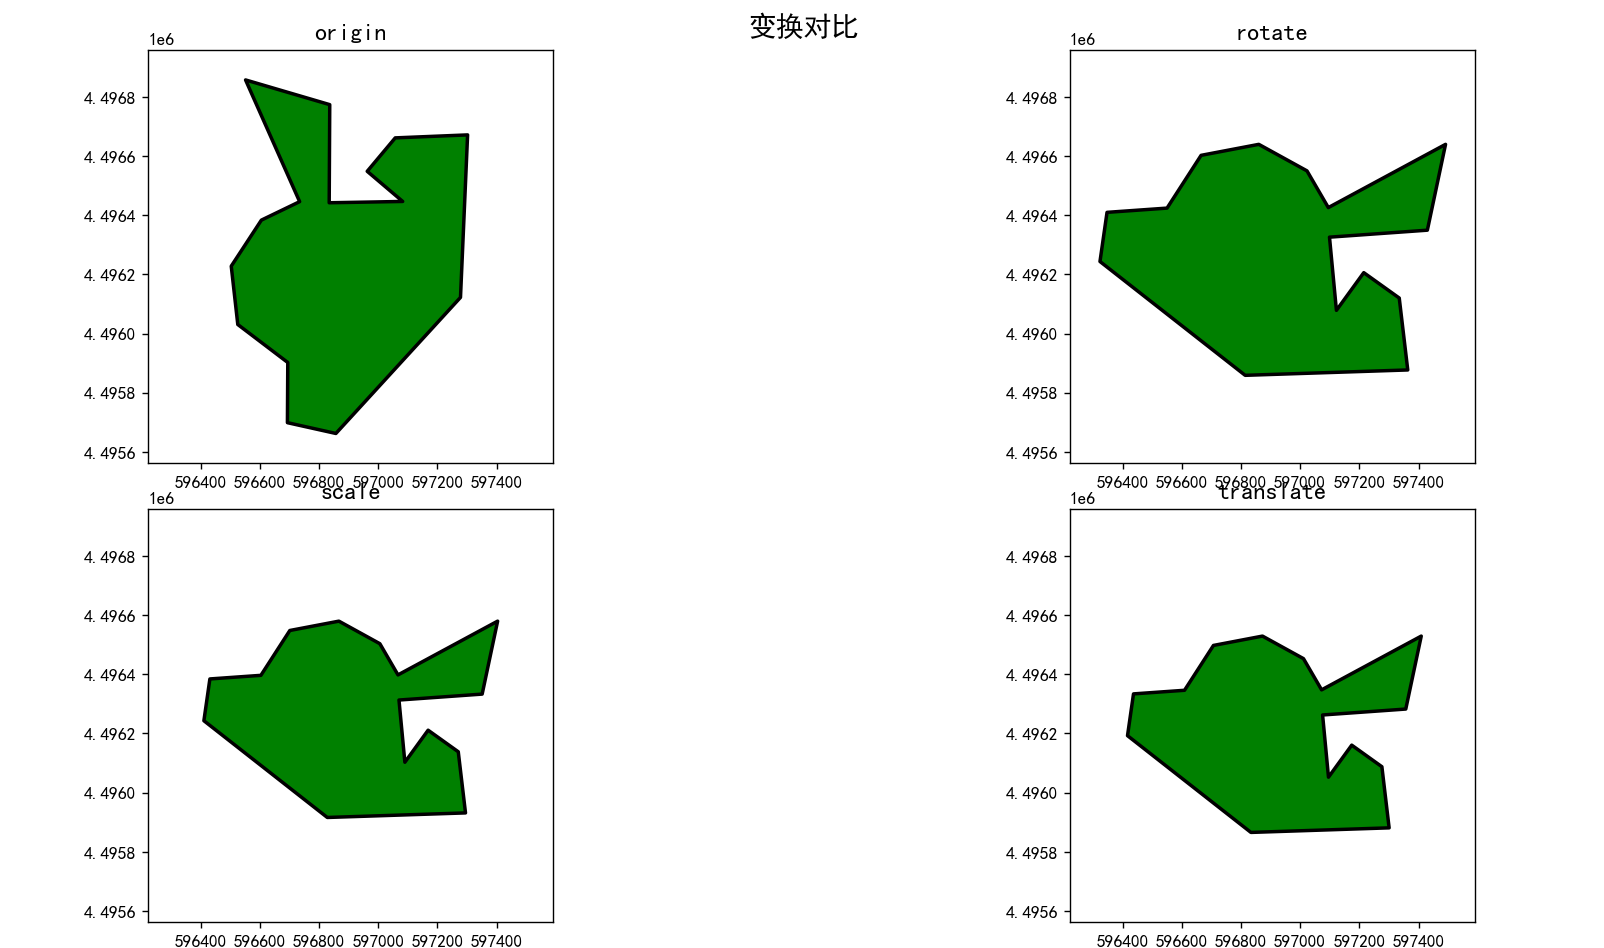
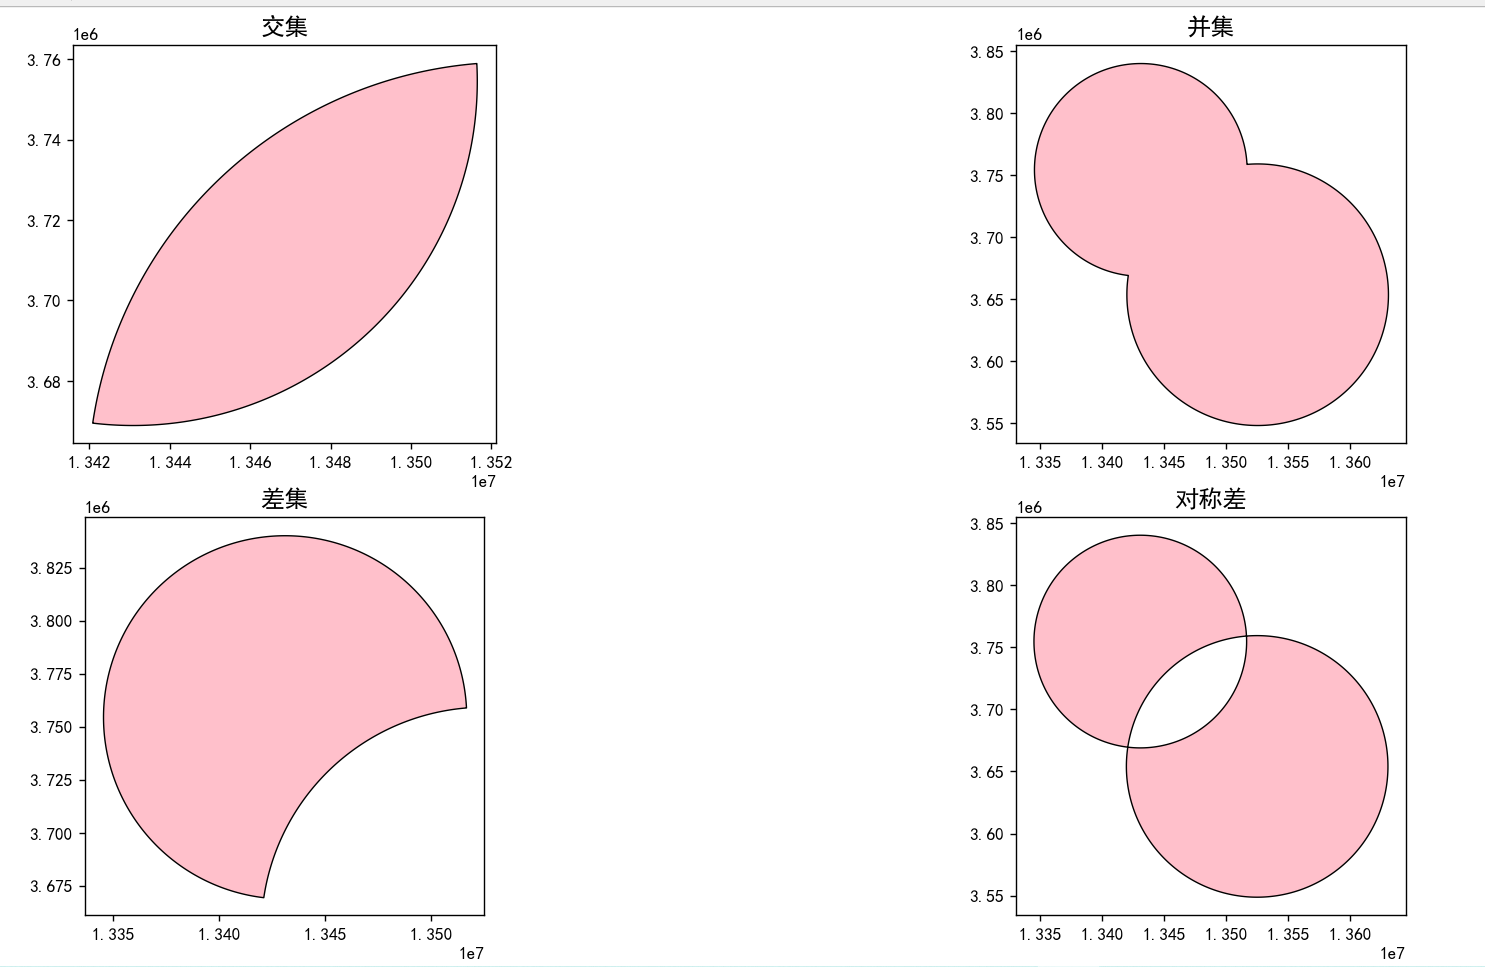
几何对象的运算
并集
a.union(b)
交集
a.intersection(b)
差集
a.difference(b)获取a中不属于b的部分
对称差
a.symmetric_difference(b)
完整代码
python
import matplotlib.pyplot as plt
import geopandas as gpd
from shapely.affinity import *

try:
    circle1=r'C:\Users\Lenovo\Desktop\Python\data\vector\circle\circle1.shp'
    circle2=r'C:\Users\Lenovo\Desktop\Python\data\vector\circle\circle2.shp'
    c1=gpd.read_file(circle1)
    c2=gpd.read_file(circle2)
except FileNotFoundError:
    print('未找到文件')
except UnicodeDecodeError:
    print('中文乱码')
except Exception as e:
    print(f'具体错误:{e}')
else:
    geom1=c1.geometry.iloc[0]
    geom2=c2.geometry.iloc[0]
    #交集
    intersect=geom1.intersection(geom2)
    #并集
    union=geom1.union(geom2)
    #差集
    diff=geom1.difference(geom2)
    #对称差
    sym_diff=geom1.symmetric_difference(geom2)
    #可视化
    plt.rcParams['font.sans-serif']=['SimHei']
    plt.rcParams['axes.unicode_minus']=False

    fig,ax=plt.subplots(2,2,figsize=(12,10))
    #转换为plt支持绘制的类型GeoSeries GeoDataFrame
    intersect_geom=gpd.GeoSeries([intersect])
    union_geom=gpd.GeoSeries([union])
    diff_geom=gpd.GeoSeries([diff])
    sym_diff_geom=gpd.GeoSeries([sym_diff])

    intersect_geom.plot(ax=ax[0,0],color='pink',edgecolor='black',linewidth=0.8)
    ax[0,0].set_title('交集',fontsize=14)

    union_geom.plot(ax=ax[0,1],color='pink',edgecolor='black',linewidth=0.8)
    ax[0,1].set_title('并集',fontsize=14)

    diff_geom.plot(ax=ax[1,0],color='pink',edgecolor='black',linewidth=0.8)
    ax[1,0].set_title('差集',fontsize=14)

    sym_diff_geom.plot(ax=ax[1,1],color='pink',edgecolor='black',linewidth=0.8)
    ax[1,1].set_title('对称差',fontsize=14)
    plt.tight_layout()
    plt.show()