一、架构概览
1.1 硬件与网络拓扑
本次部署使用两台 NVIDIA DGX Spark 主机,通过直连高速网卡组成 Ray 集群,使用流水线并行(PP=2)将 196B 参数模型拆分到两台机器上运行。
| 主机名 | 角色 | 统一内存(vLLM 可见) | 高速网 IP | 网卡 |
|---|---|---|---|---|
| spark-7 | Ray Head(主节点) | 121.695 GiB | 169.254.72.234 | enp1s0f1np1 |
| spark-6 | Ray Worker(从节点) | 119.676 GiB | 169.254.12.148 | enp1s0f1np1 |
⚠️ 重要架构说明:GB10 统一内存(Unified Memory)
GB10 不含独立显存(VRAM)。CPU 与 GPU 通过 NVLink-C2C (Chip-to-Chip)互联,共享同一块 128GB LPDDR5X 内存池,带宽 273 GB/s。vLLM 看到的"可用显存"(约 119~122 GiB)是扣除操作系统和系统保留后的剩余统一内存,而非独立 GPU 显存。这与传统 PCIe GPU(如 H100/A100)有本质区别------无需 CPU↔GPU 数据拷贝,但内存带宽低于 HBM(273 GB/s vs ~3.35 TB/s of H100 SXM)。
关键设计决策:
- 放弃千兆管理网,Ray 控制面与数据面全部走 ConnectX-7 高速网卡(169.254.x.x 网段)
- 使用 Pipeline Parallel = 2:spark-7 承载前 23 层(PP Rank 0),spark-6 承载后 22 层(PP Rank 1)
- 跨节点 PP 激活值传递由 Ray Compiled DAG 封装管理
1.2 ConnectX-7 网络带宽说明
⚠️ 关于"200Gbps"的正确理解(与市场宣传有出入)
DGX Spark 配备 2 个 QSFP56 物理口,由单片 ConnectX-7 SmartNIC 驱动,每个物理口在操作系统中显示为 2 个网络接口(共 4 个虚拟口:enp1s0f0np0、enp1s0f0np1、enp1s0f1np0、enp1s0f1np1)。
| 项目 | 规格 |
|---|---|
| NIC 型号 | NVIDIA ConnectX-7 SmartNIC |
| 物理口数量 | 2 个 QSFP56 |
| 聚合额定带宽 | 200 Gbps(双口合计) |
| 每口 PCIe 连接 | PCIe Gen5 x4(~100 Gbps 上限) |
| 单口 TCP 实测峰值 | ~100 Gbps |
| 双口 RDMA 聚合实测 | ~185--190 Gbps(需正确配置 RoCE 拓扑) |
核心约束 :由于每个物理口仅连接 PCIe Gen5 x4(约 100Gbps 有效带宽),单根直连线缆仅能充分利用一个物理口(约 100Gbps),无法达到 200Gbps。要达到 200Gbps 聚合,需同时使用两根线缆+RDMA+正确的网口绑定配置。
对本次部署的影响 :使用单根 DAC 直连时(本次部署),通过 enp1s0f1np1 的 PP 通信理论上限约 100Gbps。但由于 PP 层间激活值传输量极小(实测仅 ~150--230 KB/s),网络带宽完全不是瓶颈。
1.3 软件栈
| 组件 | 版本 / 说明 |
|---|---|
| 操作系统 | DGX OS (Ubuntu 24.04 LTS,ARM64 架构) |
| Python 环境 | conda: vllm-spark,Python 3.11 |
| vLLM | v0.17.0rc1.dev105+g86e1060b1(自编译,已打补丁) |
| PyTorch | Nightly 版本必须(稳定版不含 sm_121 / CUDA 13.0 / ARM64 支持) |
| CUDA | 13.0 |
| GPU 算力 | sm_121(Compute Capability 12.1) |
| Flash Attention | v2.8.3(源码修改,强行注入 sm_121 支持) |
| NCCL | 2.29.3 |
| 内存规格 | 128GB LPDDR5X,273 GB/s,CPU/GPU 统一共享 |
| CUDA 核心数 | 6,144 |
| 模型路径 | /home/nvidia/workspaces/models/stepfun-ai/Step-3.5-Flash-FP8 |
| vLLM 源码路径 | /home/nvidia/workspaces/vllm |
| 启动脚本路径 | /home/nvidia/workspaces/ray/test_run_step_cluster.sh |
二、环境搭建(主/从节点均需执行)
⚠️ 以下所有步骤必须在 spark-7 和 spark-6 上各自完整执行一遍,确保环境完全一致。
2.1 安装支持 GB10 的 PyTorch(必须 Nightly 版)
GB10 的 CUDA 算力为 sm_121(Compute Capability 12.1,CUDA 13.0)。PyTorch 官方稳定版(截至本文)不含 ARM64 + CUDA 13.0 的预编译 wheel,必须安装 Nightly 版本。
bash
conda activate vllm-spark

# 彻底清除旧包,防止环境冲突
pip uninstall -y torch torchvision torchaudio vllm-flash-attn flash-attn vllm

# 安装支持 Blackwell sm_121 的 Nightly 版本(CUDA 13.0)
pip install --pre torch torchvision torchaudio \
    --index-url https://download.pytorch.org/whl/nightly/cu130 \
    --force-reinstall

# 验证算力:必须输出 (12, 1)
python -c "import torch; print('CUDA 算力:', torch.cuda.get_device_capability())"
# 期望输出:CUDA 算力: (12, 1)
为什么是 12.1 而非 12.0? RTX 5090 是 sm_120(12.0),而 DGX Spark 的 GB10 是 sm_121(12.1)。两者均为 Blackwell 架构,但计算能力编号不同,编译时需明确区分。
2.2 编译 vLLM(限制并发防止编译期 OOM)
DGX Spark 的统一内存为 128GB(CPU/GPU 共享),编译过程并发过高会耗尽内存。必须通过 MAX_JOBS 限制并发数。
bash
cd /home/nvidia/workspaces/vllm
rm -rf build/ .deps/ *.egg-info/

export VLLM_TARGET_DEVICE=cuda
export TORCH_CUDA_ARCH_LIST="12.1"   # 核心:明确指向 GB10 的 sm_121 算力
export MAX_JOBS=8                     # 核心:限制编译并发,防止统一内存耗尽

# --no-build-isolation --no-deps 防止 pip 自动降级 PyTorch
pip install -e . --no-build-isolation --no-deps
2.3 源码编译 Flash-Attention(注入 sm_121 支持)
官方 Flash-Attention 预编译 wheel 不支持 sm_121(官方 Issue #1969 已确认),需修改 setup.py 强行注入编译标志。
bash
cd /home/nvidia/workspaces
rm -rf flash-attention
git clone https://github.com/Dao-AILab/flash-attention.git
cd flash-attention && git checkout v2.8.3

# 修改 setup.py,注入 sm_121 编译目标
python -c "
with open('setup.py', 'r') as f:
    c = f.read()
c = c.replace('\"--use_fast_math\",',
    '\"--use_fast_math\", \"-gencode\", \"arch=compute_90a,code=sm_90a\",\
     \"-gencode\", \"arch=compute_121,code=sm_121\",\
     \"-gencode\", \"arch=compute_120,code=compute_120\",')
with open('setup.py', 'w') as f:
    f.write(c)
print('setup.py 修改成功')
"

# 极限省内存编译:跳过反向传播(推理用不到)
export MAX_JOBS=4
export FLASH_ATTENTION_FORCE_BUILD=TRUE
export FLASH_ATTENTION_SKIP_BWD=TRUE
pip install -e . --no-build-isolation --no-deps

# 验证:若无报错说明 Flash-Attention 打通
python -c "import vllm.vllm_flash_attn as fa; print('Flash-Attention OK')"
三、vLLM 源码修复(核心排坑)
这是本次部署最关键的部分。vLLM v0.17.0rc1 在单 GPU 每节点的跨节点 Ray PP 场景下存在多个严重 Bug,必须逐一修复才能成功启动。
Bug 1:Placement Group 策略为 PACK 导致跨节点 GPU 分配失败
现象:
vLLM 启动后几秒内就报 RuntimeError,EngineCore 进程收到 SIGTERM 退出:
WARNING Tensor parallel size (2) exceeds available GPUs (1).
This may result in Ray placement group allocation failures.
根本原因:
vLLM 在创建 Ray Placement Group 时默认使用 PACK 策略,该策略会尽量将所有 bundle(GPU)塞进同一节点(尝试 Pack,溢出才跨节点)。而本次配置每台机器只有 1 张 GPU,PP=2 需要 2 个 GPU bundle。在 vLLM v0.17.0rc1 这个版本中,单节点 GPU 不足时 PG 直接报错退出,而不是自动跨节点分配。
注意:Ray Serve LLM 的 PACK 策略在资源不足时会自动溢出到其他节点;但 vLLM 直接调用的这个版本 RC 中不具备该行为,必须手动改为 SPREAD。
修复方案:
bash
# 文件:/home/nvidia/workspaces/vllm/vllm/v1/executor/ray_utils.py  第 477 行
sed -i 's/strategy="PACK"/strategy="SPREAD"/' \
    /home/nvidia/workspaces/vllm/vllm/v1/executor/ray_utils.py

# 验证修改
grep -n 'strategy=' /home/nvidia/workspaces/vllm/vllm/v1/executor/ray_utils.py
# 期望输出:477:            placement_group_specs, strategy="SPREAD"
原理: SPREAD 策略将 bundle 分散到不同节点,使 spark-7 和 spark-6 各出一张 GPU,正好满足 PP=2 的需求。
Bug 2:ray_utils.py 中 current_ip 使用错误 IP
现象:
即使修复 Bug 1 后,PG 创建仍然失败。手动验证发现 get_ip() 返回了错误 IP:
bash
python3 -c "from vllm.utils.network_utils import get_ip; print(get_ip())"
# 错误输出:192.168.1.228  ← 管理网网线 IP,不是 Ray 使用的直连 IP
根本原因:
ray_utils.py 创建 Placement Group 时,用 get_ip() 返回的 IP 生成 node:192.168.1.228 约束,将 bundle 0 钉在该 IP 对应的节点。但 Ray 集群中 spark-7 注册的 IP 是 169.254.72.234,约束匹配失败,PG 创建立即报错。
虽然启动脚本已设置 VLLM_HOST_IP=169.254.72.234,但 envs.VLLM_HOST_IP 在模块 import 时缓存,Ray worker 子进程启动时可能读不到该环境变量,导致 get_ip() 回退到 socket 路由探测,探测到 8.8.8.8 时走管理网,返回错误 IP。
修复方案:
bash
# 文件:/home/nvidia/workspaces/vllm/vllm/v1/executor/ray_utils.py  第 461 行
sed -i 's/current_ip = get_ip()/current_ip = os.environ.get("VLLM_HOST_IP") or get_ip()/' \
    /home/nvidia/workspaces/vllm/vllm/v1/executor/ray_utils.py

# 验证
grep -n "current_ip" /home/nvidia/workspaces/vllm/vllm/v1/executor/ray_utils.py
Bug 3:ray_executor.py 中 driver_ip 使用错误 IP
现象:
修复 Bug 1 和 Bug 2 后,初始化仍然失败。错误被吞没,日志只显示 Shutting down Ray distributed executor。通过在源码添加 try/except 捕获后,发现真实错误:
RuntimeError: Every node should have a unique IP address.
Got 2 nodes with node ids [...] and 3 unique IP addresses
{'169.254.72.234', '192.168.1.128', '192.168.1.228'}
根本原因:
ray_executor.py 的 _init_workers_ray 方法中,driver_ip = get_ip() 同样返回了管理网 IP(192.168.1.228)。该方法收集所有 worker 的 IP(均为 169.254.x.x),发现 IP 数量(3个)与节点数量(2个)不匹配,抛出异常。
修复方案:
bash
# 文件:/home/nvidia/workspaces/vllm/vllm/v1/executor/ray_executor.py  第 207 行
sed -i 's/driver_ip = get_ip()/driver_ip = os.environ.get("VLLM_HOST_IP") or get_ip()/' \
    /home/nvidia/workspaces/vllm/vllm/v1/executor/ray_executor.py

# 验证
grep -n "driver_ip" /home/nvidia/workspaces/vllm/vllm/v1/executor/ray_executor.py
Bug 4:RAY_RUNTIME_ENV_HOOK 设为空字符串导致 ValueError
现象:
某次启动时报错:
ValueError: You need to pass a valid path like mymodule.provider_class根本原因:
旧版启动脚本中有 export RAY_RUNTIME_ENV_HOOK="" 这一行,将该变量设为空字符串。Ray 读取到空字符串后,尝试将其作为模块路径解析,失败并抛出 ValueError。
修复方案:
从启动脚本中彻底删除该行。不能设为空字符串,要么不设置,要么设置有效的模块路径。
Bug 5:spark-6 上 get_node_ip() 返回错误 IP
现象:
出现"3个唯一 IP 对应 2个节点"的错误,spark-6 上的 worker 上报了 192.168.1.128(管理网 IP)而非 169.254.12.148(高速直连 IP)。
根本原因:
vLLM worker 的 get_node_ip() 方法通过网络探测获取 IP,在 spark-6 上探测到的是管理网网卡 IP,与 Ray 集群注册的 IP 不一致。
修复方案:
修改 get_node_ip() 方法,改用 Ray 原生 API 获取节点 IP,确保与 Ray 集群内注册的 IP 完全一致:
python
# 文件:/home/nvidia/workspaces/vllm/vllm/v1/executor/ray_utils.py  第 77 行
# 将 get_node_ip() 方法修改为:

def get_node_ip(self) -> str:
    import ray
    return ray.util.get_node_ip_address()
修复汇总
| Bug # | 文件 | 位置 | 修复内容 |
|---|---|---|---|
| Bug 1 | vllm/v1/executor/ray_utils.py |
第 477 行 | strategy="PACK" → strategy="SPREAD" |
| Bug 2 | vllm/v1/executor/ray_utils.py |
第 461 行 | current_ip = get_ip() → os.environ.get("VLLM_HOST_IP") or get_ip() |
| Bug 3 | vllm/v1/executor/ray_executor.py |
第 207 行 | driver_ip = get_ip() → os.environ.get("VLLM_HOST_IP") or get_ip() |
| Bug 4 | 启动脚本 | 全局 | 删除 RAY_RUNTIME_ENV_HOOK="" 赋值行 |
| Bug 5 | vllm/v1/executor/ray_utils.py |
第 77 行 | get_node_ip() 改用 ray.util.get_node_ip_address() |
修改源码后必须清除 .pyc 字节码缓存
⚠️ 修改
.py文件后,如不清除.pyc缓存,Python 可能仍然运行旧版本代码。
bash
find /home/nvidia/workspaces/vllm/vllm/v1/executor/ -name '*.pyc' -delete四、组网与 Ray 集群启动
4.1 169.254.x.x 网段说明
两台机器通过 ConnectX-7 QSFP56 网卡直连,IP 地址在 169.254.x.x 网段(链路本地地址)。该网段有一个已知限制:底层 c10d/Gloo 通信库无法对其进行反向 DNS 解析,会产生 err=-3 的 DNS 查询警告------无害,可安全忽略:
[W311 19:30:50.617528206 socket.cpp:207] [c10d] The hostname of the client
socket cannot be retrieved. err=-3   ← 可安全忽略
4.2 Ray 集群启动步骤
第一步:清场(每次重启前执行,主/从节点均需)
bash
pkill -9 python
ray stop -f
sync; sudo bash -c 'echo 3 > /proc/sys/vm/drop_caches'
第二步:在 spark-7(主节点)启动 Ray Head
bash
conda activate vllm-spark
ray start --head \
    --node-ip-address=169.254.72.234 \
    --port=6379 \
    --num-gpus=1
第三步:在 spark-6(从节点)加入集群
bash
conda activate vllm-spark
ray start \
    --address=169.254.72.234:6379 \
    --node-ip-address=169.254.12.148 \
    --num-gpus=1
第四步:验证集群状态
bash
# 在 spark-7 上执行,期望看到 2 个 ALIVE 节点,共 2.0 GPU
ray status

# 期望输出:
# Active:
#  1 node_xxxx  (169.254.12.148)
#  1 node_xxxx  (169.254.72.234)
# Total Usage: 0.0/2.0 GPU

ray list nodes  # 查看详细节点信息
五、完整启动脚本
以下为经过所有 Bug 修复验证后,最终可正常工作的启动脚本(/home/nvidia/workspaces/ray/test_run_step_cluster.sh):
bash
#!/bin/bash
source ~/miniconda3/bin/activate vllm-spark

export VLLM_HOST_IP=169.254.72.234
export RAY_NODE_IP_ADDRESS=169.254.72.234
export RAY_ADDRESS=169.254.72.234:6379
export NCCL_SOCKET_IFNAME=enp1s0f1np1
export GLOO_SOCKET_IFNAME=enp1s0f1np1
export OMP_NUM_THREADS=4
export MKL_NUM_THREADS=4

python -m vllm.entrypoints.openai.api_server \
  --model /home/nvidia/workspaces/models/stepfun-ai/Step-3.5-Flash-FP8 \
  --served-model-name step3p5-flash \
  --distributed-executor-backend ray \
  --tensor-parallel-size 1 \
  --pipeline-parallel-size 2 \
  --trust-remote-code \
  --disable-cascade-attn \
  --gpu-memory-utilization 0.85 \
  --max-model-len 8192 \
  --host 0.0.0.0 \
  --port 8000
后台启动方式:
bash
chmod +x /home/nvidia/workspaces/ray/test_run_step_cluster.sh

# 后台运行,输出到日志文件
nohup /home/nvidia/workspaces/ray/test_run_step_cluster.sh \
    > /home/nvidia/workspaces/ray/vllm_server.log 2>&1 &

# 实时追踪启动日志
tail -f /home/nvidia/workspaces/ray/vllm_server.log
六、启动过程详解与预期日志
6.1 启动流程
| 阶段 | 预计耗时 | 关键日志 |
|---|---|---|
| Ray 集群连接 | < 5 秒 | Connected to Ray cluster at 169.254.72.234:6379 |
| Placement Group 创建 | < 10 秒 | Creating a new placement group (SPREAD 策略) |
| 模型权重加载 spark-7 | ~320 秒 | Loading weights took 320.10 seconds (91.24 GiB) |
| 模型权重加载 spark-6 | ~408 秒 | Loading weights took 407.91 seconds (99.76 GiB) |
| KV Cache 分配 & 预热 | < 30 秒 | GPU KV cache size: 12,192 tokens |
| 服务就绪 | --- | INFO: Application startup complete. |
总启动时间约 8~10 分钟(主要耗时在模型权重加载,两节点串行加载,spark-6 比 spark-7 慢约 90 秒)。
6.2 启动成功后的关键确认项
bash
# 确认 1:检查层分配(默认不均等分配)
# 日志中应出现:
# Hidden layers were unevenly partitioned: [23,22]
# spark-7 (PP Rank 0) 承载第 0~22 层(共 23 层)
# spark-6 (PP Rank 1) 承载第 23~44 层(共 22 层)
#
# 可选:通过环境变量手动均等分配
# export VLLM_PP_LAYER_PARTITION='22,23'

# 确认 2:KV Cache 大小
# spark-7: Available KV cache memory: 7.4 GiB
# GPU KV cache size: 12,192 tokens

# 确认 3:PP 通信方式
# 日志应出现:
# Using RayPPCommunicator (wraps vLLM _PPGroupCoordinator)
# VLLM_USE_RAY_COMPILED_DAG_CHANNEL_TYPE = auto
# 说明 PP 通信由 Ray Compiled DAG 管理
6.3 模型推理速度
| 指标 | 实测值 | 备注 |
|---|---|---|
| 单请求生成速度 | 1011 tokens/s | enforce-eager 模式,无 CUDA Graphs |
| KV Cache 可用量 | 12,192 tokens | 两节点取较小值 |
| 最大上下文长度 | 8,192 tokens | --max-model-len 限制 |
⚠️
--enforce-eager禁用了 CUDA Graphs 和torch.compile,导致推理速度偏低。去掉该参数后预期速度可提升 2~3 倍(2535 tokens/s)。当前保留该参数是因为 GB10 + vLLM RC 版在编译模式下,Triton 编译器对sm_121a的 PTX 代码生成存在已知问题(triton #9181),稳定性尚未充分验证。
七、验收测试
7.1 快速健康检查
bash
# 健康检查
curl http://localhost:8000/health

# 查看已加载模型
curl http://localhost:8000/v1/models | python3 -m json.tool
7.2 性能测试请求
bash
curl http://localhost:8000/v1/chat/completions \
  -H "Content-Type: application/json" \
  -d '{
    "model": "step3p5-flash",
    "messages": [
      {"role": "system", "content": "你是一名资深程序员。"},
      {"role": "user", "content": "用 Python 写一个完整的多线程网络爬虫,含异常处理和注释。"}
    ],
    "max_tokens": 1024,
    "temperature": 0.3,
    "stream": true
  }'
7.3 Python 速度测试脚本
bash
import asyncio
import aiohttp
import time
import json

# ================= 配置区 =================
URL = "http://localhost:8000/v1/chat/completions"
MODEL = "step3p5-flash"
CONCURRENT_REQUESTS = 15  # 同时发起的请求数量(可根据显存占用调大)
MAX_TOKENS = 1024         # 每个请求最大生成的 token 数
# ==========================================

PAYLOAD = {
    "model": MODEL,
    "messages": [{"role": "user", "content": "请用极度详细的语言,写一篇关于人类探索火星的科幻小说,包含技术细节、心理描写和跌宕起伏的剧情,不少于1000字。"}],
    "max_tokens": MAX_TOKENS,
    "temperature": 0.7,
    "stream": False
}

async def fetch(session, request_id):
    start = time.time()
    try:
        async with session.post(URL, json=PAYLOAD, timeout=600) as response:
            res = await response.json()
            latency = time.time() - start
            tokens = res.get('usage', {}).get('completion_tokens', 0)
            print(f"请求 [{request_id}] 完成! 耗时: {latency:.2f}s, 生成 Tokens: {tokens}")
            return tokens
    except Exception as e:
        print(f"请求 [{request_id}] 失败: {e}")
        return 0

async def main():
    print(f"🚀 开始极限压测:同时发起 {CONCURRENT_REQUESTS} 个并发请求...")
    start_time = time.time()

    # 绕过连接池限制,火力全开
    connector = aiohttp.TCPConnector(limit=CONCURRENT_REQUESTS)
    async with aiohttp.ClientSession(connector=connector) as session:
        tasks = [fetch(session, i) for i in range(CONCURRENT_REQUESTS)]
        results = await asyncio.gather(*tasks)

    end_time = time.time()
    total_time = end_time - start_time
    total_tokens = sum(results)

    print("\n" + "="*40)
    print("🎯 压测报告")
    print("="*40)
    print(f"总耗时:         {total_time:.2f} 秒")
    print(f"总生成 Tokens:  {total_tokens}")
    print(f"真实吞吐量:     {total_tokens / total_time:.2f} Tokens/秒")
    print("="*40)

if __name__ == "__main__":
    asyncio.run(main())
运行结果
bash
(vllm-spark) root@spark-7:/home/nvidia/workspaces/ray/benchmark#  python stress_test.py
🚀 开始极限压测:同时发起 15 个并发请求...
请求 [13] 完成! 耗时: 263.38s, 生成 Tokens: 1024
请求 [3] 完成! 耗时: 263.38s, 生成 Tokens: 1024
请求 [10] 完成! 耗时: 263.57s, 生成 Tokens: 1024
请求 [1] 完成! 耗时: 263.57s, 生成 Tokens: 1024
请求 [7] 完成! 耗时: 263.57s, 生成 Tokens: 1024
请求 [14] 完成! 耗时: 263.57s, 生成 Tokens: 1024
请求 [11] 完成! 耗时: 263.57s, 生成 Tokens: 1024
请求 [8] 完成! 耗时: 263.57s, 生成 Tokens: 1024
请求 [0] 完成! 耗时: 263.57s, 生成 Tokens: 1024
请求 [9] 完成! 耗时: 263.57s, 生成 Tokens: 1024
请求 [2] 完成! 耗时: 263.57s, 生成 Tokens: 1024
请求 [4] 完成! 耗时: 263.57s, 生成 Tokens: 1024
请求 [6] 完成! 耗时: 263.57s, 生成 Tokens: 1024
请求 [5] 完成! 耗时: 263.57s, 生成 Tokens: 1024
请求 [12] 完成! 耗时: 263.57s, 生成 Tokens: 1024

========================================
🎯 压测报告
========================================
总耗时:         263.57 秒
总生成 Tokens:  15360
真实吞吐量:     58.28 Tokens/秒
========================================
服务器荷载
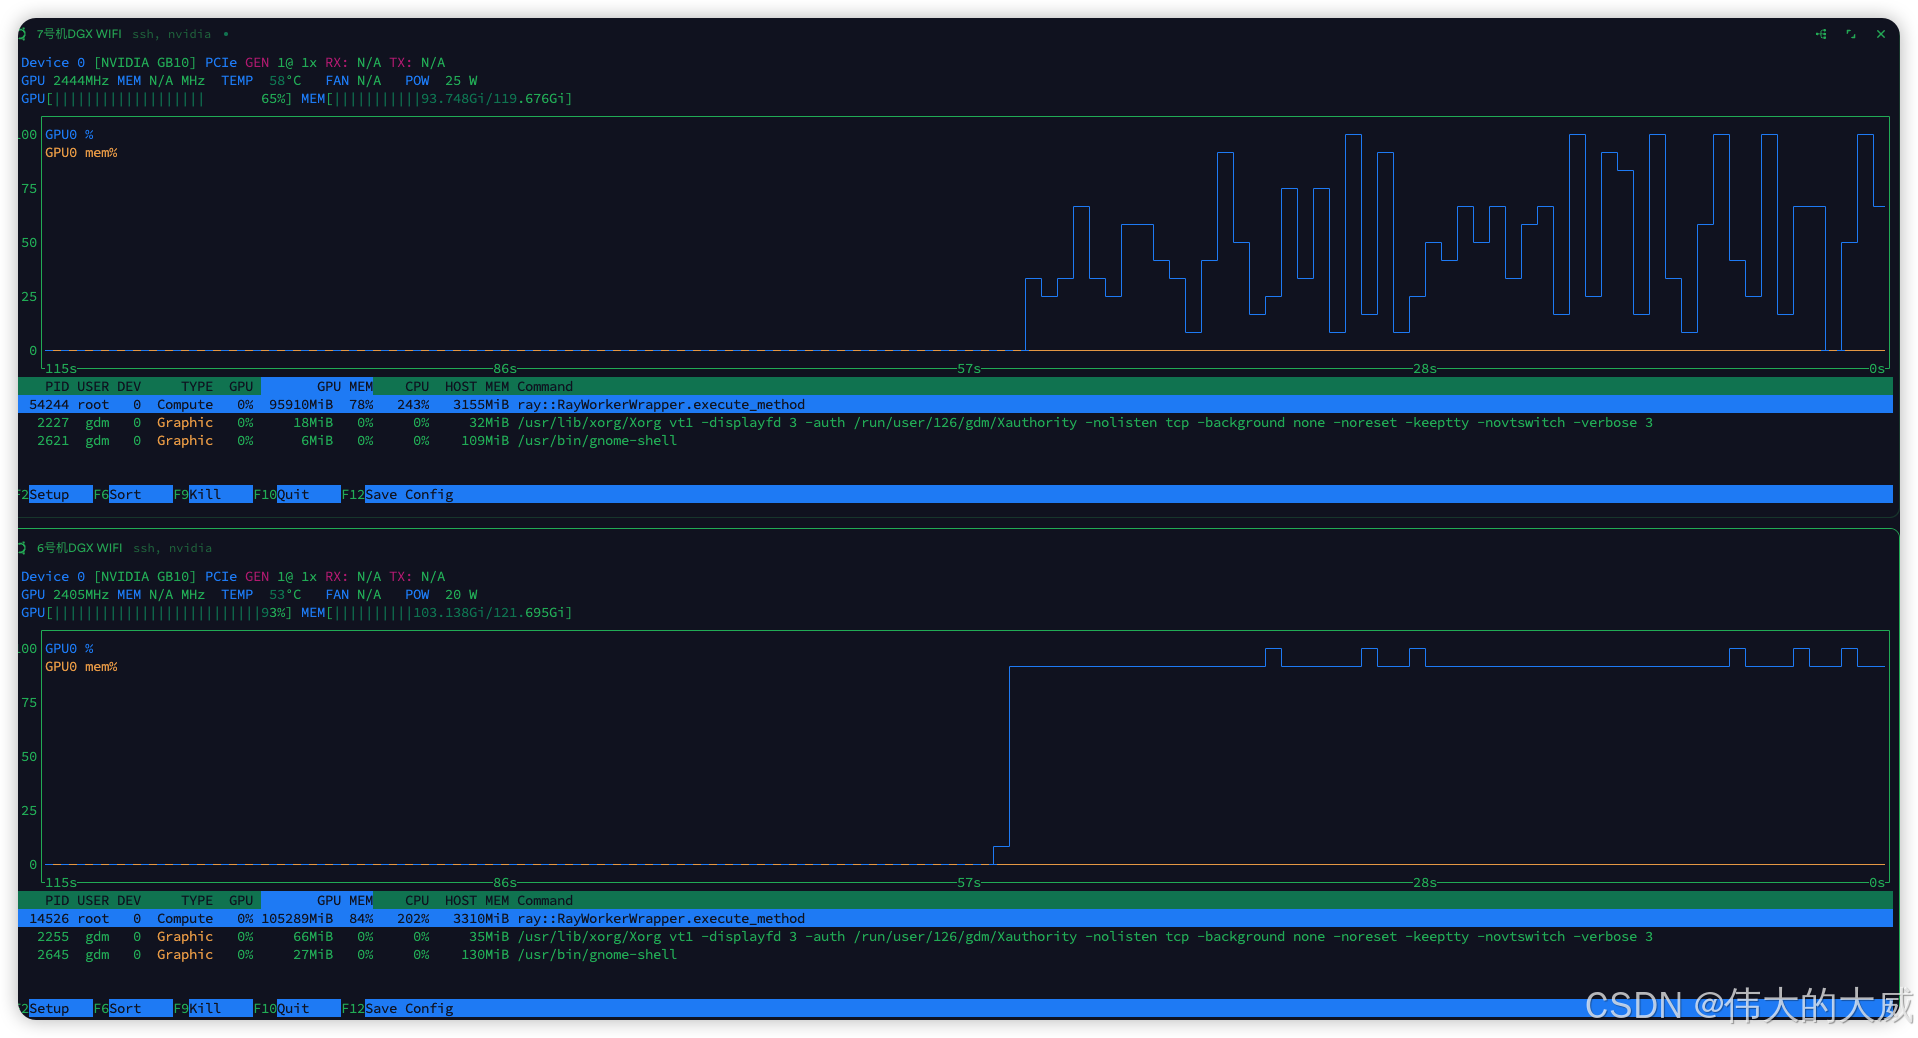
vllm输出结果
bash
(vllm-spark) root@spark-7:/home/nvidia/workspaces/ray# # 直接在终端执行,避免任何编辑器引入不可见字符
cat > /home/nvidia/workspaces/ray/run_step_cluster_0312.sh << 'EOF'
#!/bin/bash
source ~/miniconda3/bin/activate vllm-spark

export VLLM_HOST_IP=169.254.72.234
export RAY_NODE_IP_ADDRESS=169.254.72.234
export RAY_ADDRESS=169.254.72.234:6379
export NCCL_SOCKET_IFNAME=enp1s0f1np1
export GLOO_SOCKET_IFNAME=enp1s0f1np1
export OMP_NUM_THREADS=4
export MKL_NUM_THREADS=4

python -m vllm.entrypoints.openai.api_server \
  --model /home/nvidia/workspaces/models/stepfun-ai/Step-3.5-Flash-FP8 \
  --served-model-name step3p5-flash \
  --distributed-executor-backend ray \
  --tensor-parallel-size 1 \
  --pipeline-parallel-size 2 \
  --trust-remote-code \
  --disable-cascade-attn \
  --gpu-memory-utilization 0.85 \
  --max-model-len 8192 \
  --host 0.0.0.0 \
  --port 8000
EOF

chmod +x /home/nvidia/workspaces/ray/run_step_cluster_0312.sh
(vllm-spark) root@spark-7:/home/nvidia/workspaces/ray# ./run_step_cluster_0312.sh
(APIServer pid=54127) INFO 03-12 15:14:05 [utils.py:292]
(APIServer pid=54127) INFO 03-12 15:14:05 [utils.py:292]        █     █     █▄   ▄█
(APIServer pid=54127) INFO 03-12 15:14:05 [utils.py:292]  ▄▄ ▄█ █     █     █ ▀▄▀ █  version 0.17.0rc1.dev105+g86e1060b1
(APIServer pid=54127) INFO 03-12 15:14:05 [utils.py:292]   █▄█▀ █     █     █     █  model   /home/nvidia/workspaces/models/stepfun-ai/Step-3.5-Flash-FP8
(APIServer pid=54127) INFO 03-12 15:14:05 [utils.py:292]    ▀▀  ▀▀▀▀▀ ▀▀▀▀▀ ▀     ▀
(APIServer pid=54127) INFO 03-12 15:14:05 [utils.py:292]
(APIServer pid=54127) INFO 03-12 15:14:05 [utils.py:228] non-default args: {'host': '0.0.0.0', 'model': '/home/nvidia/workspaces/models/stepfun-ai/Step-3.5-Flash-FP8', 'trust_remote_code': True, 'max_model_len': 8192, 'disable_cascade_attn': True, 'served_model_name': ['step3p5-flash'], 'distributed_executor_backend': 'ray', 'pipeline_parallel_size': 2, 'gpu_memory_utilization': 0.85}
(APIServer pid=54127) The argument `trust_remote_code` is to be used with Auto classes. It has no effect here and is ignored.
(APIServer pid=54127) The argument `trust_remote_code` is to be used with Auto classes. It has no effect here and is ignored.
(APIServer pid=54127) The argument `trust_remote_code` is to be used with Auto classes. It has no effect here and is ignored.
(APIServer pid=54127) INFO 03-12 15:14:05 [model.py:531] Resolved architecture: Step3p5ForCausalLM
(APIServer pid=54127) INFO 03-12 15:14:05 [model.py:1554] Using max model len 8192
(APIServer pid=54127) INFO 03-12 15:14:06 [scheduler.py:231] Chunked prefill is enabled with max_num_batched_tokens=2048.
(APIServer pid=54127) WARNING 03-12 15:14:06 [vllm.py:742] Async scheduling will be disabled because it is not supported with the `ray` distributed executor backend (only `mp`, `uni`, and `external_launcher` are supported).
(APIServer pid=54127) INFO 03-12 15:14:06 [vllm.py:753] Asynchronous scheduling is disabled.
(APIServer pid=54127) The tokenizer you are loading from '/home/nvidia/workspaces/models/stepfun-ai/Step-3.5-Flash-FP8' with an incorrect regex pattern: https://huggingface.co/mistralai/Mistral-Small-3.1-24B-Instruct-2503/discussions/84#69121093e8b480e709447d5e. This will lead to incorrect tokenization. You should set the `fix_mistral_regex=True` flag when loading this tokenizer to fix this issue.
(APIServer pid=54127) The argument `trust_remote_code` is to be used with Auto classes. It has no effect here and is ignored.
(APIServer pid=54127) The argument `trust_remote_code` is to be used with Auto classes. It has no effect here and is ignored.
(EngineCore_DP0 pid=54151) INFO 03-12 15:14:09 [core.py:104] Initializing a V1 LLM engine (v0.17.0rc1.dev105+g86e1060b1) with config: model='/home/nvidia/workspaces/models/stepfun-ai/Step-3.5-Flash-FP8', speculative_config=None, tokenizer='/home/nvidia/workspaces/models/stepfun-ai/Step-3.5-Flash-FP8', skip_tokenizer_init=False, tokenizer_mode=auto, revision=None, tokenizer_revision=None, trust_remote_code=True, dtype=torch.bfloat16, max_seq_len=8192, download_dir=None, load_format=auto, tensor_parallel_size=1, pipeline_parallel_size=2, data_parallel_size=1, decode_context_parallel_size=1, dcp_comm_backend=ag_rs, disable_custom_all_reduce=False, quantization=fp8, enforce_eager=False, enable_return_routed_experts=False, kv_cache_dtype=auto, device_config=cuda, structured_outputs_config=StructuredOutputsConfig(backend='auto', disable_fallback=False, disable_any_whitespace=False, disable_additional_properties=False, reasoning_parser='', reasoning_parser_plugin='', enable_in_reasoning=False), observability_config=ObservabilityConfig(show_hidden_metrics_for_version=None, otlp_traces_endpoint=None, collect_detailed_traces=None, kv_cache_metrics=False, kv_cache_metrics_sample=0.01, cudagraph_metrics=False, enable_layerwise_nvtx_tracing=False, enable_mfu_metrics=False, enable_mm_processor_stats=False, enable_logging_iteration_details=False), seed=0, served_model_name=step3p5-flash, enable_prefix_caching=True, enable_chunked_prefill=True, pooler_config=None, compilation_config={'mode': <CompilationMode.VLLM_COMPILE: 3>, 'debug_dump_path': None, 'cache_dir': '', 'compile_cache_save_format': 'binary', 'backend': 'inductor', 'custom_ops': ['+quant_fp8', 'none', '+quant_fp8'], 'splitting_ops': ['vllm::unified_attention', 'vllm::unified_attention_with_output', 'vllm::unified_mla_attention', 'vllm::unified_mla_attention_with_output', 'vllm::mamba_mixer2', 'vllm::mamba_mixer', 'vllm::short_conv', 'vllm::linear_attention', 'vllm::plamo2_mamba_mixer', 'vllm::gdn_attention_core', 'vllm::olmo_hybrid_gdn_full_forward', 'vllm::kda_attention', 'vllm::sparse_attn_indexer', 'vllm::rocm_aiter_sparse_attn_indexer', 'vllm::unified_kv_cache_update', 'vllm::unified_mla_kv_cache_update'], 'compile_mm_encoder': False, 'compile_sizes': [], 'compile_ranges_split_points': [2048], 'inductor_compile_config': {'enable_auto_functionalized_v2': False, 'combo_kernels': True, 'benchmark_combo_kernel': True}, 'inductor_passes': {}, 'cudagraph_mode': <CUDAGraphMode.FULL_AND_PIECEWISE: (2, 1)>, 'cudagraph_num_of_warmups': 1, 'cudagraph_capture_sizes': [1, 2, 4, 8, 16, 24, 32, 40, 48, 56, 64, 72, 80, 88, 96, 104, 112, 120, 128, 136, 144, 152, 160, 168, 176, 184, 192, 200, 208, 216, 224, 232, 240, 248, 256, 272, 288, 304, 320, 336, 352, 368, 384, 400, 416, 432, 448, 464, 480, 496, 512], 'cudagraph_copy_inputs': False, 'cudagraph_specialize_lora': True, 'use_inductor_graph_partition': False, 'pass_config': {'fuse_norm_quant': True, 'fuse_act_quant': True, 'fuse_attn_quant': False, 'enable_sp': False, 'fuse_gemm_comms': False, 'fuse_allreduce_rms': False}, 'max_cudagraph_capture_size': 512, 'dynamic_shapes_config': {'type': <DynamicShapesType.BACKED: 'backed'>, 'evaluate_guards': False, 'assume_32_bit_indexing': False}, 'local_cache_dir': None, 'fast_moe_cold_start': False, 'static_all_moe_layers': []}
(EngineCore_DP0 pid=54151) WARNING 03-12 15:14:09 [ray_utils.py:377] Tensor parallel size (2) exceeds available GPUs (1). This may result in Ray placement group allocation failures. Consider reducing tensor_parallel_size to 1 or less, or ensure your Ray cluster has 2 GPUs available.
(EngineCore_DP0 pid=54151) 2026-03-12 15:14:09,622      INFO worker.py:1669 -- Using address 169.254.72.234:6379 set in the environment variable RAY_ADDRESS
(EngineCore_DP0 pid=54151) 2026-03-12 15:14:09,626      INFO worker.py:1810 -- Connecting to existing Ray cluster at address: 169.254.72.234:6379...
(EngineCore_DP0 pid=54151) 2026-03-12 15:14:09,658      INFO worker.py:2004 -- Connected to Ray cluster. View the dashboard at http://127.0.0.1:8265
(EngineCore_DP0 pid=54151) /root/miniconda3/envs/vllm-spark/lib/python3.11/site-packages/ray/_private/worker.py:2052: FutureWarning: Tip: In future versions of Ray, Ray will no longer override accelerator visible devices env var if num_gpus=0 or num_gpus=None (default). To enable this behavior and turn off this error message, set RAY_ACCEL_ENV_VAR_OVERRIDE_ON_ZERO=0
(EngineCore_DP0 pid=54151)   warnings.warn(
(EngineCore_DP0 pid=54151) INFO 03-12 15:14:09 [ray_utils.py:442] No current placement group found. Creating a new placement group.
(EngineCore_DP0 pid=54151) INFO 03-12 15:14:15 [ray_env.py:100] Env var prefixes to copy: ['HF_', 'HUGGING_FACE_', 'LMCACHE_', 'NCCL_', 'UCX_', 'VLLM_']
(EngineCore_DP0 pid=54151) INFO 03-12 15:14:15 [ray_env.py:101] Copying the following environment variables to workers: ['CUDA_HOME', 'LD_LIBRARY_PATH', 'NCCL_SOCKET_IFNAME', 'VLLM_WORKER_MULTIPROC_METHOD']
(EngineCore_DP0 pid=54151) INFO 03-12 15:14:15 [ray_env.py:111] To exclude env vars from copying, add them to /root/.config/vllm/ray_non_carry_over_env_vars.json
(EngineCore_DP0 pid=54151) (RayWorkerWrapper pid=14526, ip=169.254.12.148) WARNING 03-12 15:14:15 [system_utils.py:38] Overwriting environment variable LD_LIBRARY_PATH from '/root/miniconda3/envs/vllm-spark/lib/python3.11/site-packages/cv2/../../lib64:/usr/local/cuda-13.0/lib64:' to '/root/miniconda3/envs/vllm-spark/lib/python3.11/site-packages/cv2/../../lib64:/root/miniconda3/envs/vllm-spark/lib/python3.11/site-packages/cv2/../../lib64:/usr/local/cuda-13.0/lib64:'
(EngineCore_DP0 pid=54151) (RayWorkerWrapper pid=54244) WARNING 03-12 15:14:16 [worker_base.py:291] Missing `shared_worker_lock` argument from executor. This argument is needed for mm_processor_cache_type='shm'.
(EngineCore_DP0 pid=54151) (RayWorkerWrapper pid=14526, ip=169.254.12.148) INFO 03-12 15:14:17 [parallel_state.py:1395] world_size=2 rank=1 local_rank=0 distributed_init_method=tcp://169.254.72.234:42405 backend=nccl
(EngineCore_DP0 pid=54151) (RayWorkerWrapper pid=14526, ip=169.254.12.148) [W312 15:14:17.022773829 socket.cpp:207] [c10d] The hostname of the client socket cannot be retrieved. err=-3
(EngineCore_DP0 pid=54151) (RayWorkerWrapper pid=54244) INFO 03-12 15:14:18 [pynccl.py:111] vLLM is using nccl==2.29.3
(EngineCore_DP0 pid=54151) (RayWorkerWrapper pid=14526, ip=169.254.12.148) INFO 03-12 15:14:18 [parallel_state.py:1717] rank 1 in world size 2 is assigned as DP rank 0, PP rank 1, PCP rank 0, TP rank 0, EP rank 0, EPLB rank N/A
(EngineCore_DP0 pid=54151) (RayWorkerWrapper pid=54244) INFO 03-12 15:14:19 [gpu_model_runner.py:4258] Starting to load model /home/nvidia/workspaces/models/stepfun-ai/Step-3.5-Flash-FP8...
(EngineCore_DP0 pid=54151) (RayWorkerWrapper pid=14526, ip=169.254.12.148) INFO 03-12 15:14:19 [utils.py:129] Hidden layers were unevenly partitioned: [23,22]. This can be manually overridden using the VLLM_PP_LAYER_PARTITION environment variable
(EngineCore_DP0 pid=54151) (RayWorkerWrapper pid=14526, ip=169.254.12.148) INFO 03-12 15:14:19 [cuda.py:405] Using FLASH_ATTN attention backend out of potential backends: ['FLASH_ATTN', 'FLASHINFER', 'TRITON_ATTN', 'FLEX_ATTENTION'].
(EngineCore_DP0 pid=54151) (RayWorkerWrapper pid=14526, ip=169.254.12.148) INFO 03-12 15:14:19 [flash_attn.py:593] Using FlashAttention version 2
(EngineCore_DP0 pid=54151) (RayWorkerWrapper pid=14526, ip=169.254.12.148) WARNING 03-12 15:14:19 [step3p5.py:501] Disable custom fused all reduce...
(EngineCore_DP0 pid=54151) (RayWorkerWrapper pid=14526, ip=169.254.12.148) INFO 03-12 15:14:19 [fp8.py:390] Using TRITON Fp8 MoE backend out of potential backends: ['AITER', 'FLASHINFER_TRTLLM', 'FLASHINFER_CUTLASS', 'DEEPGEMM', 'TRITON', 'MARLIN', 'BATCHED_DEEPGEMM', 'BATCHED_TRITON', 'XPU'].
(EngineCore_DP0 pid=54151) (RayWorkerWrapper pid=54244) WARNING 03-12 15:14:22 [compilation.py:1114] Op 'quant_fp8' not present in model, enabling with '+quant_fp8' has no effect
(EngineCore_DP0 pid=54151) (RayWorkerWrapper pid=54244) WARNING 03-12 15:14:15 [system_utils.py:38] Overwriting environment variable LD_LIBRARY_PATH from '/root/miniconda3/envs/vllm-spark/lib/python3.11/site-packages/cv2/../../lib64:/usr/local/cuda-13.0/lib64:' to '/root/miniconda3/envs/vllm-spark/lib/python3.11/site-packages/cv2/../../lib64:/root/miniconda3/envs/vllm-spark/lib/python3.11/site-packages/cv2/../../lib64:/usr/local/cuda-13.0/lib64:'
(EngineCore_DP0 pid=54151) (RayWorkerWrapper pid=14526, ip=169.254.12.148) WARNING 03-12 15:14:16 [worker_base.py:291] Missing `shared_worker_lock` argument from executor. This argument is needed for mm_processor_cache_type='shm'.
(EngineCore_DP0 pid=54151) (RayWorkerWrapper pid=54244) INFO 03-12 15:14:17 [parallel_state.py:1395] world_size=2 rank=0 local_rank=0 distributed_init_method=tcp://169.254.72.234:42405 backend=nccl
Loading safetensors checkpoint shards:   0% Completed | 0/44 [00:00<?, ?it/s]
(EngineCore_DP0 pid=54151) (RayWorkerWrapper pid=54244) [W312 15:14:17.711220570 socket.cpp:207] [c10d] The hostname of the client socket cannot be retrieved. err=-3
Loading safetensors checkpoint shards:   2% Completed | 1/44 [00:35<25:28, 35.55s/it]
Loading safetensors checkpoint shards:   5% Completed | 2/44 [00:36<10:28, 14.97s/it]
Loading safetensors checkpoint shards:   7% Completed | 3/44 [00:49<09:49, 14.37s/it]
Loading safetensors checkpoint shards:   9% Completed | 4/44 [01:03<09:29, 14.24s/it]
Loading safetensors checkpoint shards:  11% Completed | 5/44 [01:17<09:13, 14.18s/it]
Loading safetensors checkpoint shards:  14% Completed | 6/44 [01:31<08:56, 14.11s/it]
Loading safetensors checkpoint shards:  16% Completed | 7/44 [01:45<08:40, 14.05s/it]
Loading safetensors checkpoint shards:  18% Completed | 8/44 [01:59<08:27, 14.09s/it]
Loading safetensors checkpoint shards:  20% Completed | 9/44 [02:13<08:12, 14.06s/it]
Loading safetensors checkpoint shards:  23% Completed | 10/44 [02:27<07:57, 14.05s/it]
Loading safetensors checkpoint shards:  25% Completed | 11/44 [02:42<07:44, 14.08s/it]
Loading safetensors checkpoint shards:  27% Completed | 12/44 [02:56<07:30, 14.07s/it]
Loading safetensors checkpoint shards:  30% Completed | 13/44 [03:10<07:15, 14.06s/it]
Loading safetensors checkpoint shards:  32% Completed | 14/44 [03:24<07:02, 14.08s/it]
Loading safetensors checkpoint shards:  34% Completed | 15/44 [03:38<06:48, 14.08s/it]
Loading safetensors checkpoint shards:  36% Completed | 16/44 [03:52<06:34, 14.08s/it]
Loading safetensors checkpoint shards:  39% Completed | 17/44 [04:06<06:19, 14.06s/it]
Loading safetensors checkpoint shards:  41% Completed | 18/44 [04:20<06:06, 14.10s/it]
Loading safetensors checkpoint shards:  43% Completed | 19/44 [04:34<05:53, 14.13s/it]
Loading safetensors checkpoint shards:  45% Completed | 20/44 [04:49<05:39, 14.14s/it]
Loading safetensors checkpoint shards:  48% Completed | 21/44 [05:03<05:24, 14.10s/it]
Loading safetensors checkpoint shards:  50% Completed | 22/44 [05:16<05:07, 14.00s/it]
Loading safetensors checkpoint shards: 100% Completed | 44/44 [05:16<00:00,  7.20s/it]
(EngineCore_DP0 pid=54151) (RayWorkerWrapper pid=54244)
(EngineCore_DP0 pid=54151) (RayWorkerWrapper pid=54244) INFO 03-12 15:19:39 [default_loader.py:293] Loading weights took 317.24 seconds
(EngineCore_DP0 pid=54151) (RayWorkerWrapper pid=54244) INFO 03-12 15:19:39 [fp8.py:539] Using MoEPrepareAndFinalizeNoDPEPModular
(EngineCore_DP0 pid=54151) (RayWorkerWrapper pid=54244) INFO 03-12 15:14:18 [parallel_state.py:1717] rank 0 in world size 2 is assigned as DP rank 0, PP rank 0, PCP rank 0, TP rank 0, EP rank 0, EPLB rank N/A
(EngineCore_DP0 pid=54151) (RayWorkerWrapper pid=54244) INFO 03-12 15:14:19 [utils.py:129] Hidden layers were unevenly partitioned: [23,22]. This can be manually overridden using the VLLM_PP_LAYER_PARTITION environment variable
(EngineCore_DP0 pid=54151) (RayWorkerWrapper pid=54244) INFO 03-12 15:14:19 [cuda.py:405] Using FLASH_ATTN attention backend out of potential backends: ['FLASH_ATTN', 'FLASHINFER', 'TRITON_ATTN', 'FLEX_ATTENTION'].
(EngineCore_DP0 pid=54151) (RayWorkerWrapper pid=54244) INFO 03-12 15:14:19 [flash_attn.py:593] Using FlashAttention version 2
(EngineCore_DP0 pid=54151) (RayWorkerWrapper pid=54244) WARNING 03-12 15:14:19 [step3p5.py:501] Disable custom fused all reduce...
(EngineCore_DP0 pid=54151) (RayWorkerWrapper pid=54244) INFO 03-12 15:14:19 [fp8.py:390] Using TRITON Fp8 MoE backend out of potential backends: ['AITER', 'FLASHINFER_TRTLLM', 'FLASHINFER_CUTLASS', 'DEEPGEMM', 'TRITON', 'MARLIN', 'BATCHED_DEEPGEMM', 'BATCHED_TRITON', 'XPU'].
(EngineCore_DP0 pid=54151) (RayWorkerWrapper pid=14526, ip=169.254.12.148) WARNING 03-12 15:14:22 [compilation.py:1114] Op 'quant_fp8' not present in model, enabling with '+quant_fp8' has no effect
(EngineCore_DP0 pid=54151) (RayWorkerWrapper pid=54244) INFO 03-12 15:19:39 [gpu_model_runner.py:4341] Model loading took 91.24 GiB memory and 320.313217 seconds
(EngineCore_DP0 pid=54151) (RayWorkerWrapper pid=14526, ip=169.254.12.148) INFO 03-12 15:20:52 [default_loader.py:293] Loading weights took 389.33 seconds
(EngineCore_DP0 pid=54151) (RayWorkerWrapper pid=14526, ip=169.254.12.148) INFO 03-12 15:20:52 [fp8.py:539] Using MoEPrepareAndFinalizeNoDPEPModular
(EngineCore_DP0 pid=54151) (RayWorkerWrapper pid=14526, ip=169.254.12.148) INFO 03-12 15:20:52 [gpu_model_runner.py:4341] Model loading took 99.76 GiB memory and 392.842387 seconds
(EngineCore_DP0 pid=54151) (RayWorkerWrapper pid=14526, ip=169.254.12.148) INFO 03-12 15:20:53 [decorators.py:465] Directly load AOT compilation from path /root/.cache/vllm/torch_compile_cache/torch_aot_compile/b103951f49e6120f93226a38e8a98f37838e37e606b55d85052750121d19bbbe/rank_1_0/model
(EngineCore_DP0 pid=54151) (RayWorkerWrapper pid=54244) INFO 03-12 15:20:54 [backends.py:913] Using cache directory: /root/.cache/vllm/torch_compile_cache/4736cbb7bc/rank_0_0/backbone for vLLM's torch.compile
(EngineCore_DP0 pid=54151) (RayWorkerWrapper pid=54244) INFO 03-12 15:20:54 [backends.py:973] Dynamo bytecode transform time: 2.20 s
(EngineCore_DP0 pid=54151) (RayWorkerWrapper pid=14526, ip=169.254.12.148) INFO 03-12 15:20:57 [backends.py:283] Directly load the compiled graph(s) for compile range (1, 2048) from the cache, took 2.265 s
(EngineCore_DP0 pid=54151) (RayWorkerWrapper pid=14526, ip=169.254.12.148) WARNING 03-12 15:20:58 [fused_moe.py:1093] Using default MoE config. Performance might be sub-optimal! Config file not found at /home/nvidia/workspaces/vllm/vllm/model_executor/layers/fused_moe/configs/E=288,N=1280,device_name=NVIDIA_GB10,dtype=fp8_w8a8,block_shape=[128,128].json
(EngineCore_DP0 pid=54151) (RayWorkerWrapper pid=54244) INFO 03-12 15:20:53 [decorators.py:465] Directly load AOT compilation from path /root/.cache/vllm/torch_compile_cache/torch_aot_compile/55964fae7296c9bf8ac71610b565b1611db1cc6ea07b34ae8785462e86a1e546/rank_0_0/model
(EngineCore_DP0 pid=54151) (RayWorkerWrapper pid=14526, ip=169.254.12.148) /root/miniconda3/envs/vllm-spark/lib/python3.11/site-packages/torch/utils/_config_module.py:540: FutureWarning: torch._dynamo.config.skip_code_recursive_on_recompile_limit_hit is deprecated and does not do anything. It will be removed in a future version of PyTorch.
(EngineCore_DP0 pid=54151) (RayWorkerWrapper pid=14526, ip=169.254.12.148)   config[key] = copy.deepcopy(getattr(self, key))
(EngineCore_DP0 pid=54151) (RayWorkerWrapper pid=14526, ip=169.254.12.148) INFO 03-12 15:20:59 [monitor.py:35] torch.compile and initial profiling run took 6.57 s in total
(EngineCore_DP0 pid=54151) (RayWorkerWrapper pid=14526, ip=169.254.12.148) INFO 03-12 15:20:59 [gpu_worker.py:425] Available KV cache memory: 0.91 GiB
(EngineCore_DP0 pid=54151) (RayWorkerWrapper pid=14526, ip=169.254.12.148) INFO 03-12 15:20:54 [backends.py:913] Using cache directory: /root/.cache/vllm/torch_compile_cache/5369359fc9/rank_1_0/backbone for vLLM's torch.compile
(EngineCore_DP0 pid=54151) (RayWorkerWrapper pid=14526, ip=169.254.12.148) INFO 03-12 15:20:54 [backends.py:973] Dynamo bytecode transform time: 2.21 s
(EngineCore_DP0 pid=54151) WARNING 03-12 15:20:59 [kv_cache_utils.py:1054] Add 3 padding layers, may waste at most 9.09% KV cache memory
(EngineCore_DP0 pid=54151) INFO 03-12 15:20:59 [kv_cache_utils.py:1314] GPU KV cache size: 9,984 tokens
(EngineCore_DP0 pid=54151) INFO 03-12 15:20:59 [kv_cache_utils.py:1319] Maximum concurrency for 8,192 tokens per request: 2.51x
(EngineCore_DP0 pid=54151) (RayWorkerWrapper pid=14526, ip=169.254.12.148) 2026-03-12 15:20:59,913 - INFO - autotuner.py:256 - flashinfer.jit: [Autotuner]: Autotuning process starts ...
(EngineCore_DP0 pid=54151) (RayWorkerWrapper pid=14526, ip=169.254.12.148) 2026-03-12 15:21:00,047 - INFO - autotuner.py:262 - flashinfer.jit: [Autotuner]: Autotuning process ends
Capturing CUDA graphs (mixed prefill-decode, PIECEWISE):   0%|          | 0/51 [00:00<?, ?it/s]
Capturing CUDA graphs (mixed prefill-decode, PIECEWISE):   2%|▏         | 1/51 [00:00<00:10,  4.77it/s]
Capturing CUDA graphs (mixed prefill-decode, PIECEWISE):   4%|▍         | 2/51 [00:00<00:08,  5.99it/s]
Capturing CUDA graphs (mixed prefill-decode, PIECEWISE):   6%|▌         | 3/51 [00:00<00:07,  6.60it/s]
Capturing CUDA graphs (mixed prefill-decode, PIECEWISE):   8%|▊         | 4/51 [00:00<00:06,  7.11it/s]
Capturing CUDA graphs (mixed prefill-decode, PIECEWISE):  10%|▉         | 5/51 [00:00<00:06,  7.28it/s]
Capturing CUDA graphs (mixed prefill-decode, PIECEWISE):  12%|█▏        | 6/51 [00:00<00:06,  7.18it/s]
Capturing CUDA graphs (mixed prefill-decode, PIECEWISE):  14%|█▎        | 7/51 [00:01<00:06,  7.28it/s]
Capturing CUDA graphs (mixed prefill-decode, PIECEWISE):  16%|█▌        | 8/51 [00:01<00:05,  7.27it/s]
Capturing CUDA graphs (mixed prefill-decode, PIECEWISE):  18%|█▊        | 9/51 [00:01<00:05,  7.32it/s]
Capturing CUDA graphs (mixed prefill-decode, PIECEWISE):  20%|█▉        | 10/51 [00:01<00:05,  7.81it/s]
Capturing CUDA graphs (mixed prefill-decode, PIECEWISE):  22%|██▏       | 11/51 [00:01<00:04,  8.16it/s]
Capturing CUDA graphs (mixed prefill-decode, PIECEWISE):  24%|██▎       | 12/51 [00:01<00:04,  8.49it/s]
Capturing CUDA graphs (mixed prefill-decode, PIECEWISE):  25%|██▌       | 13/51 [00:01<00:04,  8.80it/s]
Capturing CUDA graphs (mixed prefill-decode, PIECEWISE):  27%|██▋       | 14/51 [00:01<00:04,  9.08it/s]
Capturing CUDA graphs (mixed prefill-decode, PIECEWISE):  29%|██▉       | 15/51 [00:01<00:03,  9.23it/s]
Capturing CUDA graphs (mixed prefill-decode, PIECEWISE):  33%|███▎      | 17/51 [00:02<00:03,  9.29it/s]
Capturing CUDA graphs (mixed prefill-decode, PIECEWISE):  37%|███▋      | 19/51 [00:02<00:03,  9.75it/s]
Capturing CUDA graphs (mixed prefill-decode, PIECEWISE):  41%|████      | 21/51 [00:02<00:02, 10.11it/s]
Capturing CUDA graphs (mixed prefill-decode, PIECEWISE):  45%|████▌     | 23/51 [00:02<00:02, 10.37it/s]
Capturing CUDA graphs (mixed prefill-decode, PIECEWISE):  49%|████▉     | 25/51 [00:02<00:02, 10.52it/s]
Capturing CUDA graphs (mixed prefill-decode, PIECEWISE):  53%|█████▎    | 27/51 [00:03<00:02, 10.70it/s]
Capturing CUDA graphs (mixed prefill-decode, PIECEWISE):  57%|█████▋    | 29/51 [00:03<00:02, 10.93it/s]
(EngineCore_DP0 pid=54151) (RayWorkerWrapper pid=54244) /root/miniconda3/envs/vllm-spark/lib/python3.11/site-packages/torch/utils/_config_module.py:540: FutureWarning: torch._dynamo.config.skip_code_recursive_on_recompile_limit_hit is deprecated and does not do anything. It will be removed in a future version of PyTorch.
(EngineCore_DP0 pid=54151) (RayWorkerWrapper pid=54244)   config[key] = copy.deepcopy(getattr(self, key))
Capturing CUDA graphs (mixed prefill-decode, PIECEWISE):  61%|██████    | 31/51 [00:03<00:01, 11.22it/s]
Capturing CUDA graphs (mixed prefill-decode, PIECEWISE):  65%|██████▍   | 33/51 [00:03<00:01, 11.46it/s]
Capturing CUDA graphs (mixed prefill-decode, PIECEWISE):  69%|██████▊   | 35/51 [00:03<00:01, 11.87it/s]
Capturing CUDA graphs (mixed prefill-decode, PIECEWISE):  73%|███████▎  | 37/51 [00:03<00:01, 12.23it/s]
Capturing CUDA graphs (mixed prefill-decode, PIECEWISE):  76%|███████▋  | 39/51 [00:04<00:00, 12.44it/s]
Capturing CUDA graphs (mixed prefill-decode, PIECEWISE):  80%|████████  | 41/51 [00:04<00:00, 12.40it/s]
Capturing CUDA graphs (mixed prefill-decode, PIECEWISE):  84%|████████▍ | 43/51 [00:04<00:00, 12.89it/s]
Capturing CUDA graphs (mixed prefill-decode, PIECEWISE):  88%|████████▊ | 45/51 [00:04<00:00, 13.33it/s]
(EngineCore_DP0 pid=54151) (RayWorkerWrapper pid=54244) 2026-03-12 15:20:59,884 - INFO - autotuner.py:256 - flashinfer.jit: [Autotuner]: Autotuning process starts ...
Capturing CUDA graphs (mixed prefill-decode, PIECEWISE):  92%|█████████▏| 47/51 [00:04<00:00, 13.30it/s]
(EngineCore_DP0 pid=54151) (RayWorkerWrapper pid=54244) 2026-03-12 15:21:00,084 - INFO - autotuner.py:262 - flashinfer.jit: [Autotuner]: Autotuning process ends
Capturing CUDA graphs (mixed prefill-decode, PIECEWISE):  96%|█████████▌| 49/51 [00:04<00:00, 14.14it/s]
Capturing CUDA graphs (mixed prefill-decode, PIECEWISE): 100%|██████████| 51/51 [00:04<00:00, 10.29it/s]
Capturing CUDA graphs (decode, FULL):   0%|          | 0/35 [00:00<?, ?it/s]
Capturing CUDA graphs (decode, FULL):   3%|▎         | 1/35 [00:00<00:08,  3.93it/s]
Capturing CUDA graphs (decode, FULL):   6%|▌         | 2/35 [00:00<00:05,  5.66it/s]
Capturing CUDA graphs (decode, FULL):   9%|▊         | 3/35 [00:00<00:04,  6.62it/s]
Capturing CUDA graphs (decode, FULL):  11%|█▏        | 4/35 [00:00<00:04,  7.24it/s]
Capturing CUDA graphs (decode, FULL):  14%|█▍        | 5/35 [00:00<00:03,  7.65it/s]
Capturing CUDA graphs (decode, FULL):  17%|█▋        | 6/35 [00:00<00:03,  7.90it/s]
Capturing CUDA graphs (decode, FULL):  20%|██        | 7/35 [00:00<00:03,  8.12it/s]
Capturing CUDA graphs (decode, FULL):  23%|██▎       | 8/35 [00:01<00:03,  8.36it/s]
Capturing CUDA graphs (decode, FULL):  26%|██▌       | 9/35 [00:01<00:03,  8.56it/s]
Capturing CUDA graphs (decode, FULL):  29%|██▊       | 10/35 [00:01<00:02,  8.69it/s]
Capturing CUDA graphs (decode, FULL):  31%|███▏      | 11/35 [00:01<00:02,  8.82it/s]
Capturing CUDA graphs (decode, FULL):  34%|███▍      | 12/35 [00:01<00:02,  8.96it/s]
Capturing CUDA graphs (decode, FULL):  37%|███▋      | 13/35 [00:01<00:02,  9.13it/s]
Capturing CUDA graphs (decode, FULL):  40%|████      | 14/35 [00:01<00:02,  9.33it/s]
Capturing CUDA graphs (decode, FULL):  46%|████▌     | 16/35 [00:01<00:01,  9.74it/s]
Capturing CUDA graphs (decode, FULL):  51%|█████▏    | 18/35 [00:02<00:01,  9.90it/s]
Capturing CUDA graphs (decode, FULL):  57%|█████▋    | 20/35 [00:02<00:01, 10.35it/s]
Capturing CUDA graphs (decode, FULL):  63%|██████▎   | 22/35 [00:02<00:01, 10.79it/s]
Capturing CUDA graphs (decode, FULL):  69%|██████▊   | 24/35 [00:02<00:00, 11.22it/s]
Capturing CUDA graphs (decode, FULL):  74%|███████▍  | 26/35 [00:02<00:00, 11.67it/s]
Capturing CUDA graphs (decode, FULL):  80%|████████  | 28/35 [00:02<00:00, 12.15it/s]
Capturing CUDA graphs (decode, FULL):  86%|████████▌ | 30/35 [00:03<00:00, 12.75it/s]
Capturing CUDA graphs (decode, FULL):  91%|█████████▏| 32/35 [00:03<00:00, 13.65it/s]
Capturing CUDA graphs (decode, FULL):  97%|█████████▋| 34/35 [00:03<00:00, 14.01it/s]
(EngineCore_DP0 pid=54151) (RayWorkerWrapper pid=14526, ip=169.254.12.148) INFO 03-12 15:21:08 [gpu_model_runner.py:5363] Graph capturing finished in 9 secs, took 0.40 GiB
(EngineCore_DP0 pid=54151) (RayWorkerWrapper pid=54244) INFO 03-12 15:20:58 [backends.py:283] Directly load the compiled graph(s) for compile range (1, 2048) from the cache, took 2.631 s
(EngineCore_DP0 pid=54151) (RayWorkerWrapper pid=54244) WARNING 03-12 15:20:59 [fused_moe.py:1093] Using default MoE config. Performance might be sub-optimal! Config file not found at /home/nvidia/workspaces/vllm/vllm/model_executor/layers/fused_moe/configs/E=288,N=1280,device_name=NVIDIA_GB10,dtype=fp8_w8a8,block_shape=[128,128].json
(EngineCore_DP0 pid=54151) (RayWorkerWrapper pid=54244) INFO 03-12 15:20:59 [monitor.py:35] torch.compile and initial profiling run took 6.67 s in total
(EngineCore_DP0 pid=54151) (RayWorkerWrapper pid=54244) INFO 03-12 15:20:59 [gpu_worker.py:425] Available KV cache memory: 7.78 GiB
Capturing CUDA graphs (decode, FULL): 100%|██████████| 35/35 [00:03<00:00, 10.32it/s]
(EngineCore_DP0 pid=54151) INFO 03-12 15:21:08 [core.py:293] init engine (profile, create kv cache, warmup model) took 16.60 seconds
(EngineCore_DP0 pid=54151) The tokenizer you are loading from '/home/nvidia/workspaces/models/stepfun-ai/Step-3.5-Flash-FP8' with an incorrect regex pattern: https://huggingface.co/mistralai/Mistral-Small-3.1-24B-Instruct-2503/discussions/84#69121093e8b480e709447d5e. This will lead to incorrect tokenization. You should set the `fix_mistral_regex=True` flag when loading this tokenizer to fix this issue.
(EngineCore_DP0 pid=54151) INFO 03-12 15:21:09 [vllm.py:753] Asynchronous scheduling is disabled.
(APIServer pid=54127) INFO 03-12 15:21:09 [api_server.py:496] Supported tasks: ['generate']
(APIServer pid=54127) The argument `trust_remote_code` is to be used with Auto classes. It has no effect here and is ignored.
(APIServer pid=54127) The argument `trust_remote_code` is to be used with Auto classes. It has no effect here and is ignored.
(APIServer pid=54127) The argument `trust_remote_code` is to be used with Auto classes. It has no effect here and is ignored.
(APIServer pid=54127) The argument `trust_remote_code` is to be used with Auto classes. It has no effect here and is ignored.
(APIServer pid=54127) INFO 03-12 15:21:09 [serving.py:182] Warming up chat template processing...
(APIServer pid=54127) The tokenizer you are loading from '/home/nvidia/workspaces/models/stepfun-ai/Step-3.5-Flash-FP8' with an incorrect regex pattern: https://huggingface.co/mistralai/Mistral-Small-3.1-24B-Instruct-2503/discussions/84#69121093e8b480e709447d5e. This will lead to incorrect tokenization. You should set the `fix_mistral_regex=True` flag when loading this tokenizer to fix this issue.
(APIServer pid=54127) INFO 03-12 15:21:09 [hf.py:318] Detected the chat template content format to be 'string'. You can set `--chat-template-content-format` to override this.
(APIServer pid=54127) INFO 03-12 15:21:09 [serving.py:207] Chat template warmup completed in 257.9ms
(APIServer pid=54127) The argument `trust_remote_code` is to be used with Auto classes. It has no effect here and is ignored.
(APIServer pid=54127) The argument `trust_remote_code` is to be used with Auto classes. It has no effect here and is ignored.
(APIServer pid=54127) The argument `trust_remote_code` is to be used with Auto classes. It has no effect here and is ignored.
(APIServer pid=54127) The argument `trust_remote_code` is to be used with Auto classes. It has no effect here and is ignored.
(APIServer pid=54127) INFO 03-12 15:21:09 [api_server.py:501] Starting vLLM server on http://0.0.0.0:8000
(APIServer pid=54127) INFO 03-12 15:21:09 [launcher.py:37] Available routes are:
(APIServer pid=54127) INFO 03-12 15:21:09 [launcher.py:46] Route: /openapi.json, Methods: GET, HEAD
(APIServer pid=54127) INFO 03-12 15:21:09 [launcher.py:46] Route: /docs, Methods: GET, HEAD
(APIServer pid=54127) INFO 03-12 15:21:09 [launcher.py:46] Route: /docs/oauth2-redirect, Methods: GET, HEAD
(APIServer pid=54127) INFO 03-12 15:21:09 [launcher.py:46] Route: /redoc, Methods: GET, HEAD
(APIServer pid=54127) INFO 03-12 15:21:09 [launcher.py:46] Route: /tokenize, Methods: POST
(APIServer pid=54127) INFO 03-12 15:21:09 [launcher.py:46] Route: /detokenize, Methods: POST
(APIServer pid=54127) INFO 03-12 15:21:09 [launcher.py:46] Route: /load, Methods: GET
(APIServer pid=54127) INFO 03-12 15:21:09 [launcher.py:46] Route: /version, Methods: GET
(APIServer pid=54127) INFO 03-12 15:21:09 [launcher.py:46] Route: /health, Methods: GET
(APIServer pid=54127) INFO 03-12 15:21:09 [launcher.py:46] Route: /metrics, Methods: GET
(APIServer pid=54127) INFO 03-12 15:21:09 [launcher.py:46] Route: /v1/models, Methods: GET
(APIServer pid=54127) INFO 03-12 15:21:09 [launcher.py:46] Route: /ping, Methods: GET
(APIServer pid=54127) INFO 03-12 15:21:09 [launcher.py:46] Route: /ping, Methods: POST
(APIServer pid=54127) INFO 03-12 15:21:09 [launcher.py:46] Route: /invocations, Methods: POST
(APIServer pid=54127) INFO 03-12 15:21:09 [launcher.py:46] Route: /v1/chat/completions, Methods: POST
(APIServer pid=54127) INFO 03-12 15:21:09 [launcher.py:46] Route: /v1/chat/completions/render, Methods: POST
(APIServer pid=54127) INFO 03-12 15:21:09 [launcher.py:46] Route: /v1/responses, Methods: POST
(APIServer pid=54127) INFO 03-12 15:21:09 [launcher.py:46] Route: /v1/responses/{response_id}, Methods: GET
(APIServer pid=54127) INFO 03-12 15:21:09 [launcher.py:46] Route: /v1/responses/{response_id}/cancel, Methods: POST
(APIServer pid=54127) INFO 03-12 15:21:09 [launcher.py:46] Route: /v1/completions, Methods: POST
(APIServer pid=54127) INFO 03-12 15:21:09 [launcher.py:46] Route: /v1/completions/render, Methods: POST
(APIServer pid=54127) INFO 03-12 15:21:09 [launcher.py:46] Route: /v1/messages, Methods: POST
(APIServer pid=54127) INFO 03-12 15:21:09 [launcher.py:46] Route: /v1/messages/count_tokens, Methods: POST
(APIServer pid=54127) INFO 03-12 15:21:09 [launcher.py:46] Route: /inference/v1/generate, Methods: POST
(APIServer pid=54127) INFO 03-12 15:21:09 [launcher.py:46] Route: /scale_elastic_ep, Methods: POST
(APIServer pid=54127) INFO 03-12 15:21:09 [launcher.py:46] Route: /is_scaling_elastic_ep, Methods: POST
(APIServer pid=54127) INFO:     Started server process [54127]
(APIServer pid=54127) INFO:     Waiting for application startup.
(APIServer pid=54127) INFO:     Application startup complete.


(EngineCore_DP0 pid=54151) INFO 03-12 15:22:51 [ray_executor.py:567] RAY_CGRAPH_get_timeout is set to 300
(EngineCore_DP0 pid=54151) INFO 03-12 15:22:51 [ray_executor.py:571] VLLM_USE_RAY_COMPILED_DAG_CHANNEL_TYPE = auto
(EngineCore_DP0 pid=54151) INFO 03-12 15:22:51 [ray_executor.py:575] VLLM_USE_RAY_COMPILED_DAG_OVERLAP_COMM = False
(EngineCore_DP0 pid=54151) INFO 03-12 15:22:51 [ray_executor.py:634] Using RayPPCommunicator (which wraps vLLM _PP GroupCoordinator) for Ray Compiled Graph communication.
(EngineCore_DP0 pid=54151) 2026-03-12 15:22:51,551      INFO torch_tensor_accelerator_channel.py:807 -- Creating communicator group f73064ed-6020-47c5-8a24-3b9250686e76 on actors: [Actor(RayWorkerWrapper, 7eab06c3fd3796d2c9c9bba602000000), Actor(RayWorkerWrapper, 065a10d5c095d20c25eefb8802000000)]
(EngineCore_DP0 pid=54151) 2026-03-12 15:22:51,863      INFO torch_tensor_accelerator_channel.py:833 -- Communicator group initialized.


(APIServer pid=54127) INFO 03-12 15:23:00 [loggers.py:259] Engine 000: Avg prompt throughput: 24.2 tokens/s, Avg generation throughput: 54.2 tokens/s, Running: 15 reqs, Waiting: 0 reqs, GPU KV cache usage: 9.9%, Prefix cache hit rate: 64.9%
(APIServer pid=54127) INFO 03-12 15:23:10 [loggers.py:259] Engine 000: Avg prompt throughput: 0.0 tokens/s, Avg generation throughput: 60.0 tokens/s, Running: 15 reqs, Waiting: 0 reqs, GPU KV cache usage: 14.7%, Prefix cache hit rate: 64.9%
(APIServer pid=54127) INFO 03-12 15:23:20 [loggers.py:259] Engine 000: Avg prompt throughput: 0.0 tokens/s, Avg generation throughput: 54.0 tokens/s, Running: 15 reqs, Waiting: 0 reqs, GPU KV cache usage: 19.6%, Prefix cache hit rate: 64.9%
(APIServer pid=54127) INFO 03-12 15:23:30 [loggers.py:259] Engine 000: Avg prompt throughput: 0.0 tokens/s, Avg generation throughput: 53.8 tokens/s, Running: 15 reqs, Waiting: 0 reqs, GPU KV cache usage: 26.8%, Prefix cache hit rate: 64.9%
(APIServer pid=54127) INFO 03-12 15:23:40 [loggers.py:259] Engine 000: Avg prompt throughput: 0.0 tokens/s, Avg generation throughput: 55.7 tokens/s, Running: 15 reqs, Waiting: 0 reqs, GPU KV cache usage: 31.6%, Prefix cache hit rate: 64.9%
(APIServer pid=54127) INFO 03-12 15:23:50 [loggers.py:259] Engine 000: Avg prompt throughput: 0.0 tokens/s, Avg generation throughput: 56.8 tokens/s, Running: 15 reqs, Waiting: 0 reqs, GPU KV cache usage: 36.4%, Prefix cache hit rate: 64.9%
(APIServer pid=54127) INFO 03-12 15:24:00 [loggers.py:259] Engine 000: Avg prompt throughput: 0.0 tokens/s, Avg generation throughput: 54.2 tokens/s, Running: 15 reqs, Waiting: 0 reqs, GPU KV cache usage: 43.6%, Prefix cache hit rate: 64.9%
(APIServer pid=54127) INFO 03-12 15:24:10 [loggers.py:259] Engine 000: Avg prompt throughput: 0.0 tokens/s, Avg generation throughput: 55.5 tokens/s, Running: 15 reqs, Waiting: 0 reqs, GPU KV cache usage: 48.4%, Prefix cache hit rate: 64.9%
(APIServer pid=54127) INFO 03-12 15:24:20 [loggers.py:259] Engine 000: Avg prompt throughput: 0.0 tokens/s, Avg generation throughput: 63.0 tokens/s, Running: 15 reqs, Waiting: 0 reqs, GPU KV cache usage: 53.2%, Prefix cache hit rate: 64.9%
(APIServer pid=54127) INFO 03-12 15:24:30 [loggers.py:259] Engine 000: Avg prompt throughput: 0.0 tokens/s, Avg generation throughput: 62.8 tokens/s, Running: 15 reqs, Waiting: 0 reqs, GPU KV cache usage: 60.4%, Prefix cache hit rate: 64.9%
(APIServer pid=54127) INFO 03-12 15:24:40 [loggers.py:259] Engine 000: Avg prompt throughput: 0.0 tokens/s, Avg generation throughput: 58.7 tokens/s, Running: 15 reqs, Waiting: 0 reqs, GPU KV cache usage: 67.7%, Prefix cache hit rate: 64.9%
(APIServer pid=54127) INFO 03-12 15:24:50 [loggers.py:259] Engine 000: Avg prompt throughput: 0.0 tokens/s, Avg generation throughput: 57.0 tokens/s, Running: 15 reqs, Waiting: 0 reqs, GPU KV cache usage: 72.5%, Prefix cache hit rate: 64.9%
(APIServer pid=54127) INFO 03-12 15:25:00 [loggers.py:259] Engine 000: Avg prompt throughput: 0.0 tokens/s, Avg generation throughput: 59.8 tokens/s, Running: 15 reqs, Waiting: 0 reqs, GPU KV cache usage: 77.2%, Prefix cache hit rate: 64.9%
(APIServer pid=54127) INFO 03-12 15:25:10 [loggers.py:259] Engine 000: Avg prompt throughput: 0.0 tokens/s, Avg generation throughput: 58.5 tokens/s, Running: 15 reqs, Waiting: 0 reqs, GPU KV cache usage: 80.6%, Prefix cache hit rate: 64.9%
(APIServer pid=54127) INFO 03-12 15:25:20 [loggers.py:259] Engine 000: Avg prompt throughput: 0.0 tokens/s, Avg generation throughput: 55.7 tokens/s, Running: 15 reqs, Waiting: 0 reqs, GPU KV cache usage: 81.8%, Prefix cache hit rate: 64.9%
(APIServer pid=54127) INFO 03-12 15:25:30 [loggers.py:259] Engine 000: Avg prompt throughput: 0.0 tokens/s, Avg generation throughput: 60.0 tokens/s, Running: 15 reqs, Waiting: 0 reqs, GPU KV cache usage: 83.6%, Prefix cache hit rate: 64.9%
(APIServer pid=54127) INFO 03-12 15:25:40 [loggers.py:259] Engine 000: Avg prompt throughput: 0.0 tokens/s, Avg generation throughput: 61.5 tokens/s, Running: 15 reqs, Waiting: 0 reqs, GPU KV cache usage: 84.8%, Prefix cache hit rate: 64.9%
(APIServer pid=54127) INFO 03-12 15:25:50 [loggers.py:259] Engine 000: Avg prompt throughput: 0.0 tokens/s, Avg generation throughput: 58.5 tokens/s, Running: 15 reqs, Waiting: 0 reqs, GPU KV cache usage: 86.7%, Prefix cache hit rate: 64.9%
(APIServer pid=54127) INFO 03-12 15:26:00 [loggers.py:259] Engine 000: Avg prompt throughput: 0.0 tokens/s, Avg generation throughput: 57.0 tokens/s, Running: 15 reqs, Waiting: 0 reqs, GPU KV cache usage: 87.9%, Prefix cache hit rate: 64.9%
(APIServer pid=54127) INFO 03-12 15:26:10 [loggers.py:259] Engine 000: Avg prompt throughput: 0.0 tokens/s, Avg generation throughput: 58.5 tokens/s, Running: 15 reqs, Waiting: 0 reqs, GPU KV cache usage: 87.3%, Prefix cache hit rate: 64.9%
(APIServer pid=54127) INFO 03-12 15:26:20 [loggers.py:259] Engine 000: Avg prompt throughput: 0.0 tokens/s, Avg generation throughput: 61.3 tokens/s, Running: 15 reqs, Waiting: 0 reqs, GPU KV cache usage: 90.9%, Prefix cache hit rate: 64.9%
(APIServer pid=54127) INFO 03-12 15:26:30 [loggers.py:259] Engine 000: Avg prompt throughput: 0.0 tokens/s, Avg generation throughput: 55.7 tokens/s, Running: 15 reqs, Waiting: 0 reqs, GPU KV cache usage: 92.1%, Prefix cache hit rate: 64.9%
(APIServer pid=54127) INFO 03-12 15:26:40 [loggers.py:259] Engine 000: Avg prompt throughput: 0.0 tokens/s, Avg generation throughput: 58.5 tokens/s, Running: 15 reqs, Waiting: 0 reqs, GPU KV cache usage: 93.9%, Prefix cache hit rate: 64.9%
(APIServer pid=54127) INFO 03-12 15:26:50 [loggers.py:259] Engine 000: Avg prompt throughput: 0.0 tokens/s, Avg generation throughput: 58.5 tokens/s, Running: 15 reqs, Waiting: 0 reqs, GPU KV cache usage: 95.1%, Prefix cache hit rate: 64.9%
(APIServer pid=54127) INFO 03-12 15:27:00 [loggers.py:259] Engine 000: Avg prompt throughput: 0.0 tokens/s, Avg generation throughput: 60.0 tokens/s, Running: 15 reqs, Waiting: 0 reqs, GPU KV cache usage: 96.9%, Prefix cache hit rate: 64.9%
(APIServer pid=54127) INFO 03-12 15:27:10 [loggers.py:259] Engine 000: Avg prompt throughput: 0.0 tokens/s, Avg generation throughput: 57.0 tokens/s, Running: 15 reqs, Waiting: 0 reqs, GPU KV cache usage: 98.1%, Prefix cache hit rate: 64.9%
(APIServer pid=54127) INFO:     127.0.0.1:34894 - "POST /v1/chat/completions HTTP/1.1" 200 OK
(APIServer pid=54127) INFO:     127.0.0.1:34904 - "POST /v1/chat/completions HTTP/1.1" 200 OK
(APIServer pid=54127) INFO:     127.0.0.1:34910 - "POST /v1/chat/completions HTTP/1.1" 200 OK
(APIServer pid=54127) INFO:     127.0.0.1:34922 - "POST /v1/chat/completions HTTP/1.1" 200 OK
(APIServer pid=54127) INFO:     127.0.0.1:34934 - "POST /v1/chat/completions HTTP/1.1" 200 OK
(APIServer pid=54127) INFO:     127.0.0.1:34936 - "POST /v1/chat/completions HTTP/1.1" 200 OK
(APIServer pid=54127) INFO:     127.0.0.1:34950 - "POST /v1/chat/completions HTTP/1.1" 200 OK
(APIServer pid=54127) INFO:     127.0.0.1:34956 - "POST /v1/chat/completions HTTP/1.1" 200 OK
(APIServer pid=54127) INFO:     127.0.0.1:34960 - "POST /v1/chat/completions HTTP/1.1" 200 OK
(APIServer pid=54127) INFO:     127.0.0.1:34972 - "POST /v1/chat/completions HTTP/1.1" 200 OK
(APIServer pid=54127) INFO:     127.0.0.1:34980 - "POST /v1/chat/completions HTTP/1.1" 200 OK
(APIServer pid=54127) INFO:     127.0.0.1:34982 - "POST /v1/chat/completions HTTP/1.1" 200 OK
(APIServer pid=54127) INFO:     127.0.0.1:34994 - "POST /v1/chat/completions HTTP/1.1" 200 OK
(APIServer pid=54127) INFO:     127.0.0.1:35010 - "POST /v1/chat/completions HTTP/1.1" 200 OK
(APIServer pid=54127) INFO:     127.0.0.1:35018 - "POST /v1/chat/completions HTTP/1.1" 200 OK
(APIServer pid=54127) INFO 03-12 15:27:20 [loggers.py:259] Engine 000: Avg prompt throughput: 0.0 tokens/s, Avg generation throughput: 29.8 tokens/s, Running: 0 reqs, Waiting: 0 reqs, GPU KV cache usage: 0.0%, Prefix cache hit rate: 64.9%
(APIServer pid=54127) INFO 03-12 15:27:30 [loggers.py:259] Engine 000: Avg prompt throughput: 0.0 tokens/s, Avg generation throughput: 0.0 tokens/s, Running: 0 reqs, Waiting: 0 reqs, GPU KV cache usage: 0.0%, Prefix cache hit rate: 64.9%
(APIServer pid=54127) INFO:     127.0.0.1:41294 - "POST /v1/chat/completions HTTP/1.1" 200 OK
(APIServer pid=54127) INFO 03-12 15:31:30 [loggers.py:259] Engine 000: Avg prompt throughput: 2.2 tokens/s, Avg generation throughput: 2.6 tokens/s, Running: 1 reqs, Waiting: 0 reqs, GPU KV cache usage: 0.5%, Prefix cache hit rate: 62.9%


(APIServer pid=54127) INFO 03-12 15:31:40 [loggers.py:259] Engine 000: Avg prompt throughput: 0.0 tokens/s, Avg generation throughput: 11.9 tokens/s, Running: 1 reqs, Waiting: 0 reqs, GPU KV cache usage: 1.8%, Prefix cache hit rate: 62.9%
(APIServer pid=54127) INFO 03-12 15:31:50 [loggers.py:259] Engine 000: Avg prompt throughput: 0.0 tokens/s, Avg generation throughput: 11.9 tokens/s, Running: 1 reqs, Waiting: 0 reqs, GPU KV cache usage: 2.9%, Prefix cache hit rate: 62.9%
(APIServer pid=54127) INFO 03-12 15:32:00 [loggers.py:259] Engine 000: Avg prompt throughput: 0.0 tokens/s, Avg generation throughput: 11.9 tokens/s, Running: 1 reqs, Waiting: 0 reqs, GPU KV cache usage: 4.2%, Prefix cache hit rate: 62.9%
(APIServer pid=54127) INFO 03-12 15:32:10 [loggers.py:259] Engine 000: Avg prompt throughput: 0.0 tokens/s, Avg generation throughput: 11.6 tokens/s, Running: 1 reqs, Waiting: 0 reqs, GPU KV cache usage: 5.3%, Prefix cache hit rate: 62.9%
(APIServer pid=54127) INFO 03-12 15:32:20 [loggers.py:259] Engine 000: Avg prompt throughput: 0.0 tokens/s, Avg generation throughput: 10.1 tokens/s, Running: 0 reqs, Waiting: 0 reqs, GPU KV cache usage: 0.0%, Prefix cache hit rate: 62.9%
(APIServer pid=54127) INFO 03-12 15:32:30 [loggers.py:259] Engine 000: Avg prompt throughput: 0.0 tokens/s, Avg generation throughput: 0.0 tokens/s, Running: 0 reqs, Waiting: 0 reqs, GPU KV cache usage: 0.0%, Prefix cache hit rate: 62.9%
(APIServer pid=54127) INFO:     127.0.0.1:42238 - "POST /v1/chat/completions HTTP/1.1" 200 OK
(APIServer pid=54127) INFO 03-12 15:39:30 [loggers.py:259] Engine 000: Avg prompt throughput: 0.6 tokens/s, Avg generation throughput: 2.6 tokens/s, Running: 1 reqs, Waiting: 0 reqs, GPU KV cache usage: 0.5%, Prefix cache hit rate: 63.2%


(APIServer pid=54127) INFO 03-12 15:39:40 [loggers.py:259] Engine 000: Avg prompt throughput: 0.0 tokens/s, Avg generation throughput: 12.0 tokens/s, Running: 1 reqs, Waiting: 0 reqs, GPU KV cache usage: 1.8%, Prefix cache hit rate: 63.2%
(APIServer pid=54127) INFO 03-12 15:39:50 [loggers.py:259] Engine 000: Avg prompt throughput: 0.0 tokens/s, Avg generation throughput: 11.7 tokens/s, Running: 1 reqs, Waiting: 0 reqs, GPU KV cache usage: 2.9%, Prefix cache hit rate: 63.2%
(APIServer pid=54127) INFO 03-12 15:40:00 [loggers.py:259] Engine 000: Avg prompt throughput: 0.0 tokens/s, Avg generation throughput: 11.8 tokens/s, Running: 1 reqs, Waiting: 0 reqs, GPU KV cache usage: 4.2%, Prefix cache hit rate: 63.2%
(APIServer pid=54127) INFO 03-12 15:40:10 [loggers.py:259] Engine 000: Avg prompt throughput: 0.0 tokens/s, Avg generation throughput: 11.8 tokens/s, Running: 1 reqs, Waiting: 0 reqs, GPU KV cache usage: 5.3%, Prefix cache hit rate: 63.2%
(APIServer pid=54127) INFO 03-12 15:40:20 [loggers.py:259] Engine 000: Avg prompt throughput: 0.0 tokens/s, Avg generation throughput: 10.1 tokens/s, Running: 0 reqs, Waiting: 0 reqs, GPU KV cache usage: 0.0%, Prefix cache hit rate: 63.2%
(APIServer pid=54127) INFO 03-12 15:40:30 [loggers.py:259] Engine 000: Avg prompt throughput: 0.0 tokens/s, Avg generation throughput: 0.0 tokens/s, Running: 0 reqs, Waiting: 0 reqs, GPU KV cache usage: 0.0%, Prefix cache hit rate: 63.2%
(APIServer pid=54127) INFO 03-12 15:51:10 [loggers.py:259] Engine 000: Avg prompt throughput: 24.2 tokens/s, Avg generation throughput: 63.1 tokens/s, Running: 15 reqs, Waiting: 0 reqs, GPU KV cache usage: 10.0%, Prefix cache hit rate: 64.0%
(APIServer pid=54127) INFO 03-12 15:51:20 [loggers.py:259] Engine 000: Avg prompt throughput: 0.0 tokens/s, Avg generation throughput: 73.5 tokens/s, Running: 15 reqs, Waiting: 0 reqs, GPU KV cache usage: 17.2%, Prefix cache hit rate: 64.0%
(APIServer pid=54127) INFO 03-12 15:51:30 [loggers.py:259] Engine 000: Avg prompt throughput: 0.0 tokens/s, Avg generation throughput: 64.5 tokens/s, Running: 15 reqs, Waiting: 0 reqs, GPU KV cache usage: 24.4%, Prefix cache hit rate: 64.0%
(APIServer pid=54127) INFO 03-12 15:51:40 [loggers.py:259] Engine 000: Avg prompt throughput: 0.0 tokens/s, Avg generation throughput: 67.5 tokens/s, Running: 15 reqs, Waiting: 0 reqs, GPU KV cache usage: 31.7%, Prefix cache hit rate: 64.0%
(APIServer pid=54127) INFO 03-12 15:51:50 [loggers.py:259] Engine 000: Avg prompt throughput: 0.0 tokens/s, Avg generation throughput: 64.5 tokens/s, Running: 15 reqs, Waiting: 0 reqs, GPU KV cache usage: 36.5%, Prefix cache hit rate: 64.0%
(APIServer pid=54127) INFO 03-12 15:52:00 [loggers.py:259] Engine 000: Avg prompt throughput: 0.0 tokens/s, Avg generation throughput: 66.0 tokens/s, Running: 15 reqs, Waiting: 0 reqs, GPU KV cache usage: 43.7%, Prefix cache hit rate: 64.0%


(APIServer pid=54127) INFO 03-12 15:52:10 [loggers.py:259] Engine 000: Avg prompt throughput: 0.0 tokens/s, Avg generation throughput: 60.0 tokens/s, Running: 15 reqs, Waiting: 0 reqs, GPU KV cache usage: 48.7%, Prefix cache hit rate: 64.0%
八、运维操作
8.1 优雅停机
bash
# 找出并终止 api_server 进程
ps aux | grep api_server | awk '{print $2}' | xargs kill -9

# 清理所有 Python/Ray 残留进程
pkill -9 python
ray stop -f
sync; sudo bash -c "echo 3 > /proc/sys/vm/drop_caches"
8.2 日志实时监控
bash
# 监控 vLLM 服务日志(后台运行时)
tail -f /home/nvidia/workspaces/ray/vllm_server.log

# 仅看吞吐量报告
tail -f /home/nvidia/workspaces/ray/vllm_server.log | grep 'throughput\|tokens/s'

# 监控统一内存使用情况(GB10 统一内存,无独立显存)
nvidia-smi

# 监控网卡流量(PP 通信带宽)
ifstat -i enp1s0f1np1 1
8.3 Ray Dashboard
bash
# 本机访问(spark-7 上)
# 在浏览器打开:http://127.0.0.1:8265

# 如需从其他机器访问,在 spark-7 启动 ray 时添加:
# ray start --head ... --dashboard-host=0.0.0.0
# 然后访问:http://169.254.72.234:8265
九、已知问题与后续优化
9.1 已知问题
| 问题 | 影响 | 状态 |
|---|---|---|
--enforce-eager 限制速度 |
~11 tokens/s,去掉后预期 25~35 tokens/s | 待 Triton sm_121 支持稳定后去除 |
| MoE 配置文件缺失 | 使用默认 MoE 配置,性能次优 | 需手动调优生成 GB10 专用配置 |
| 层分配不均等 23, 22 | spark-7 多计算 1 层,轻微负载不平衡 | 可通过 VLLM_PP_LAYER_PARTITION 手动均等 |
| PP 通信走 Ray Compiled DAG TCP | 跨节点延迟较高,但通信量极小(~230 KB/s)不是瓶颈 | 可尝试 VLLM_USE_RAY_COMPILED_DAG_CHANNEL_TYPE=nccl |
| Ray Compiled DAG 跨节点挂起风险 | 长时间高负载下存在 hang 风险(Ray #58426) | 关注 Ray 上游修复 |
| tokenizer 正则警告 | tokenization 可能有轻微偏差(无害) | 可通过 fix_mistral_regex=True 修复 |
| spark-6 SSH 需密码 | 运维不便 | 配置 ssh-copy-id 实现免密登录 |
9.2 MoE 调优配置(待完成)
系统启动时警告缺少 GB10 专用的 MoE 调优配置文件:
# 缺失的配置文件路径:
/home/nvidia/workspaces/vllm/vllm/model_executor/layers/fused_moe/configs/
E=288,N=1280,device_name=NVIDIA_GB10,dtype=fp8_w8a8,block_shape=[128,128].json
9.3 去除 enforce-eager(下一步优化)
去掉 --enforce-eager 参数后,vLLM 将启用 CUDA Graphs 进行批量推理优化,预期速度明显提升。
⚠️ 已知风险:Triton 在 GB10(sm_121a)上调用
ptxas时存在"Value 'sm_121a' is not defined for option 'gpu-name'"的错误(triton #9181),导致torch.compile/ TorchInductor 路径失败并回退。去掉 enforce-eager 后请密切观察启动日志和运行稳定性。
bash
# 测试时从脚本中移除该行:
#   --enforce-eager \

# 去掉后 vLLM 会尝试启用 CUDAGraphs,启动时间增加约 2~5 分钟
十、关键技术洞察
10.1 PP 通信架构与 NCCL 的关系
这是一个常见误区,必须澄清:
| 通信类型 | 使用的技术 | 说明 |
|---|---|---|
| PP 层间激活值传递 | Ray Compiled DAG(默认 auto 通道) | 由 VLLM_USE_RAY_COMPILED_DAG_CHANNEL_TYPE 控制,默认 auto |
| 各节点内部 TP 通信(TP>1 时) | NCCL | 本次 TP=1,此路径不存在 |
| Gloo all-reduce(部分同步操作) | Gloo over TCP | 走 GLOO_SOCKET_IFNAME 指定的网卡 |
实际测量 :PP 通信期间 enp1s0f1np1 的 TX 带宽仅约 150~230 KB/s,远低于网卡理论带宽,说明跨节点激活值传输量极小,网络带宽完全不是推理性能瓶颈。
Ray Compiled DAG 通道类型可通过环境变量切换:
bash
# 默认 auto:由 Ray 自动选择最优通道
export VLLM_USE_RAY_COMPILED_DAG_CHANNEL_TYPE=auto

# 强制使用 NCCL(需要 RDMA 支持,可获得更低延迟)
export VLLM_USE_RAY_COMPILED_DAG_CHANNEL_TYPE=nccl

# 强制使用共享内存(单节点场景有效)
export VLLM_USE_RAY_COMPILED_DAG_CHANNEL_TYPE=shm
若使用 nccl 通道类型,可通过 NCCL_DEBUG=TRACE 确认实际传输路径:
[send] via NET/IB/GDRDMA→ 走 InfiniBand / RDMA,高效[send] via NET/Socket→ 走 TCP Socket,次优
10.2 NCCL 变量的实际作用范围
| 环境变量 | 实际作用 | 对当前配置(TP=1, PP=2)的影响 |
|---|---|---|
NCCL_SOCKET_IFNAME=enp1s0f1np1 |
绑定 NCCL Socket 通信到指定网卡 | 有效(保留) |
GLOO_SOCKET_IFNAME=enp1s0f1np1 |
绑定 Gloo 通信网卡 | 有效(保留) |
NCCL_IB_DISABLE=0 |
允许 RDMA/RoCE 传输 | 对 PP DAG 通道无直接效果 |
NCCL_NET_GDR_LEVEL=5 |
控制 GPUDirect RDMA 级别 | 对 PP DAG 通道无直接效果 |
RAY_CGRAPH_get_timeout |
Ray Compiled DAG 操作超时(默认 300s) | 多节点时可适当调大 |
VLLM_USE_RAY_COMPILED_DAG_CHANNEL_TYPE |
控制 PP 通信底层通道类型 | 核心变量,默认 auto |
10.3 为什么 VLLM_HOST_IP 的修复如此关键
本次修复的核心问题本质上都是同一个:DGX Spark 同时有多块网卡(管理网 192.168.x.x、高速直连网 169.254.x.x),Python 标准的 socket 路由探测会选择默认路由网卡(管理网),返回错误 IP。
vLLM v0.17.0rc1 在三个不同位置调用了 get_ip(),每处都可能返回错误 IP。正确做法是在所有相关调用处优先读取 VLLM_HOST_IP 环境变量,绕过自动探测。
10.4 GB10 统一内存架构对推理性能的影响
| 特性 | 传统 PCIe GPU(如 H100 PCIe) | GB10 统一内存 |
|---|---|---|
| CPU↔GPU 数据传输 | 需要通过 PCIe(~64 GB/s) | 无需拷贝,直接访问 |
| 内存容量 | 最高 80GB HBM3 | 128GB LPDDR5X |
| 内存带宽 | ~3.35 TB/s(HBM3) | 273 GB/s |
| 推理瓶颈 | 算力 | 内存带宽(主要瓶颈) |
| 大模型适配性 | 需多卡才能装载 | 单机可装 200B 参数模型 |
内存带宽(273 GB/s)是 GB10 在 LLM 推理中的主要性能上限,尤其对于大 Batch Size 或高并发场景影响显著。