【云原生】可观测性系统---Prometheus---EFK
一个现代的可观测性体系(Observability)通常包含三部分:
-
指标(Metrics):Prometheus(告诉你系统现在怎么了)。
-
日志(Logs):Elastic Stack(告诉你为什么会这样)。
-
链路追踪(Traces):Jaeger 或 Zipkin(告诉你一次请求在各个服务之间的完整路径)。【istio安装了】
Prometheus
0、概述
Prometheus:指标监控与告警专家
Prometheus 是一个以指标(Metrics)为中心的监控系统及告警工具包。它的设计初衷是实时地采集和存储应用的性能数据,如CPU使用率、请求延迟、内存消耗等数值型的时间序列数据。
核心用处:实时监控系统状态,并通过强大的查询语言 PromQL 对数据进行聚合、分析,及时发现异常并触发告警。
典型场景:监控Kubernetes集群、微服务架构、云原生应用的运行状态,是云原生计算基金会(CNCF)的顶级项目。也是 Kubernetes 监控的事实标准。
- 核心概念:基于指标(Metrics)。它关注的是数字。比如:
-
CPU 使用率现在是 75%。
-
QPS(每秒请求数)现在是 1000。
-
服务 A 的延迟 P99(99%的请求延迟)是 200ms。
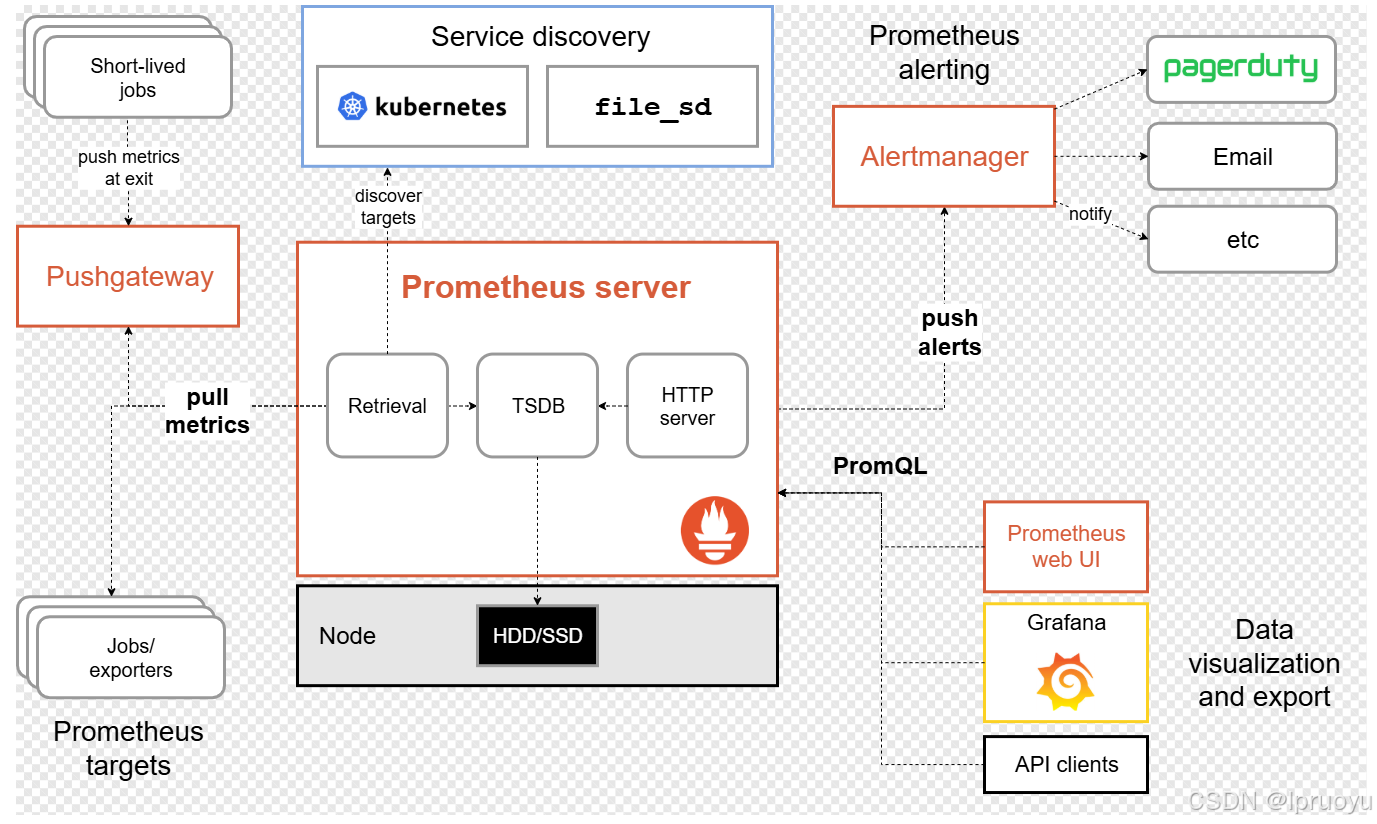
- 主要组件
-
Prometheus Server:核心服务器,负责拉取(Pull)和存储指标数据。
-
Client Libraries:用于对业务代码进行埋点,暴露指标。
-
Exporters:用于监控第三方系统(如 MySQL, Nginx, Linux 主机),它们负责将第三方系统的指标转换成 Prometheus 能理解的格式。
-
Alertmanager:处理告警,负责去重、分组、静默和发送通知(如邮件、钉钉、微信)。
-
Grafana:通常是可视化层,用于创建仪表盘(Dashboard),展示 Prometheus 中的数据。虽然 Prometheus 自带简单的 UI,但生产环境几乎都会搭配 Grafana。
- 数据模型
-
时间序列数据:每一个数据点都是由指标名和标签(键值对)唯一标识的。
-
例如:http_requests_total{method="GET", endpoint="/api/v1/users"}
-
查询语言:PromQL:PromQL 是 Prometheus 的查询语言,非常强大,可以灵活地对采集到的指标数据进行聚合、计算和分析。
-
适合的场景
-
微服务和云原生架构(特别是 Kubernetes)。
-
需要实时告警的系统。
-
SRE(网站可靠性工程)黄金指标:延迟、流量、错误、饱和度。
- 不适合的场景
-
存储和检索详细的日志文本。
-
处理非结构化的数据。
-
需要高精度(毫秒级以下)的事件追踪。
是一个 time series data 时间序列数据库
1、docker版本
sh
docker run -d --name prometheus --restart=always \
    -p 9090:9090 \
    -v /app/prometheus/config:/etc/prometheus \
    prom/prometheus
sh
mkdir -p /app/prometheus/config
cd /app/prometheus/config
vi prometheus.yml
yaml
# my global config
global:
  scrape_interval:     15s # Set the scrape interval to every 15 seconds. Default is every 1 minute.
  evaluation_interval: 15s # Evaluate rules every 15 seconds. The default is every 1 minute.
  # scrape_timeout is set to the global default (10s).

# Alertmanager configuration
alerting:
  alertmanagers:
  - static_configs:
    - targets:
       - alertmanager:9093

# Load rules once and periodically evaluate them according to the global 'evaluation_interval'.
rule_files:
  # - "first_rules.yml"
  # - "second_rules.yml"

# A scrape configuration containing exactly one endpoint to scrape:
# Here it's Prometheus itself.
scrape_configs:
  # The job name is added as a label `job=<job_name>` to any timeseries scraped from this config.
  - job_name: 'prometheus'
    # metrics_path defaults to '/metrics' # expression:要看metrics有哪些进行编写
    # scheme defaults to 'http'.
    scrape_interval: 5s
    static_configs:
    - targets: ['127.0.0.1:9090']

  - job_name: 'docker'
    scrape_interval: 10s
    static_configs:
      - targets: ['10.120.82.4:8080'] ## 这个安装了下面cadvisor才有,自动访问/metrics
  - job_name: 'node'  ## ; node_exporter
    scrape_interval: 5s
    static_configs:
    - targets: ['10.120.82.4:9100']
sh
# 运行cadvisor 导出docker节点数据,访问 8080/metrics即可
docker run -v /:/rootfs:ro \
-v /var/run:/var/run:rw \
-v /sys:/sys:ro \
-v /var/lib/docker/:/var/lib/docker:ro \
-p 8080:8080 -d  --name=cadvisor  google/cadvisor
sh
#主机监控,参照如下网址
https://grafana.com/grafana/dashboards/13978?src=grafana_gettingstarted&pg=dashboards&plcmt=featured-sub1

#创建开机启动服务.为啥不行???? 可以用 nohup node_exporter &
#nohup node_exporter >> node_exporter.output.log 2>&1 &
vi /etc/systemd/system/node-exporter.service
## 内容如下,如下的配置算了
[Unit]
Description=Node Exporter

[Service]
User=node-exporter
ExecStart=/usr/local/bin/node_exporter  --config.file=agent-config.yaml
##ExecStart=/usr/local/bin/node_exporter
Restart=always

[Install]
WantedBy=multi-user.target

##创建用户
useradd --no-create-home --shell /bin/false node-exporter

## 启动
sudo systemctl daemon-reload
sudo systemctl enable node-exporter.service --now
sudo systemctl start node-exporter.service
sudo systemctl status node-exporter.service
sh
docker run -d --name=grafana --restart=always -p 3000:3000 grafana/grafana准备一个程序能暴露 /metrics k v
mysql【云原生出来以前的,找exporter】:mysql_exporter
java: 引入Actuator【spring-boot-starter-actuator】,也会暴露 metrics信息
云原生的一些组件,直接就能抓
2、k8s中安装
kube-prometheus-stack包含
- prometheus
- stack-charts
- prometheus-community/kube-state-metrics
- prometheus-community/prometheus-node-exporter
- grafana/grafana
1、charts下载
sh
helm repo add prometheus-community https://prometheus-community.github.io/helm-charts
helm repo update
helm pull prometheus-community/kube-prometheus-stack --version 16.0.0
ls
tar -xvf kube-prometheus-stack-16.0.0.tgz
cd kube-prometheus-stack/
2、定制化配置
1、配置ingress访问证书
全局做过的就可以跳过;
只需要给全局
*.itdachang.com加上域名的证书即可
2、配置定制化文件
yaml
vi override.yaml  #基于他的values.yaml改的

alertmanager:
  ingress:
    enabled: true
    ingressClassName: nginx
    hosts:
      - alertmanager.itdachang.com
    paths:
      - /
    pathType: Prefix
    # tls:
    #  - secretName: itdachang.com
    #    hosts:
    #     - alertmanager.itdachang.com
grafana:
  enabled: true
  defaultDashboardsEnabled: true
  adminPassword: Admin123456
  ingress:
    enabled: true
    hosts:
    - grafana.itdachang.com
    path: /
    pathType: Prefix
    # tls:
    #   - secretName: itdachang.com
    #     hosts:
    #       - grafana.itdachang.com

prometheus:
  prometheusSpec:
    additionalPodMonitors:
      - name: registry.cn-hangzhou.aliyuncs.com/lfy_k8s_images/kube-state-metrics:v2.0.0
  ingress:
    enabled: true
    hosts: [prometheus.itdachang.com]
    paths:
      - /
    pathType: Prefix
    # tls:
    #   - secretName: itdachang.com
    #     hosts:
    #       - prometheus.itdachang.com
3、安装
sh
kubectl create ns monitor
helm install -f values.yaml -f override.yaml prometheus-stack ./ -n monitor
NAME: prometheus-stack
LAST DEPLOYED: Thu May 27 11:39:52 2021
NAMESPACE: monitor
STATUS: deployed
REVISION: 1
NOTES:
kube-prometheus-stack has been installed. Check its status by running:
kubectl --namespace monitor get pods -l "release=prometheus-stack"
Visit https://github.com/prometheus-operator/kube-prometheus for instructions on how to create & configure Alertmanager and Prometheus instances using the Operator.
4、访问
grafana.itdachang.com 【密码:admin Admin123456】
5、其他想查看的
去grafana官网找对应的dashboard,拿到他的id【比如13105】,然后导入进来即可
https://grafana.com/grafana/dashboards/
EFK
0、概念
ELK Stack 专注于日志管理和分析(基于日志 Logs)。ELK 是三个开源项目的首字母缩写,后来加入了轻量级数据采集器 Beats,演变为 Elastic Stack。它是一个端到端的日志分析和数据可视化平台。
ECK (Elastic Cloud on Kubernetes):这是 Elastic 公司官方推出的 Kubernetes Operator,本质上是Elastic Stack在K8s上的"自动化管家"。它的核心职责是让你能通过简单的 YAML 配置文件,在 Kubernetes 上轻松地部署、管理和运维一整套 Elasticsearch、Kibana 等组件。你只需要告诉 ECK 想要一个什么样的 Elasticsearch 集群(比如几个节点、多大存储),ECK 就会自动帮你完成所有复杂的部署和配置工作。
Logstash:服务器端的数据处理管道,能够从多个来源采集数据,并实时对数据进行转换、过滤和丰富,然后发送到 Elasticsearch。
Elasticsearch:核心存储和检索引擎。它是一个分布式、RESTful 风格的搜索和分析引擎,能对海量数据进行近乎实时的存储、搜索和分析。
Kibana:可视化层。提供数据探索、仪表盘、图表和地图等功能,让用户通过 Web 界面与 Elasticsearch 中的数据进行交互。
Beats:轻量级数据采集器。部署在服务器上作为代理,将各种类型的数据发送给 Logstash 或 Elasticsearch。例如:
Filebeat:用于采集日志文件。
Metricbeat:用于采集指标数据(与 Prometheus 功能有重叠)。
Packetbeat:用于采集网络数据。
部署前预习
- ElasticSearch 的配置文件位置: https://www.elastic.co/guide/en/elasticsearch/reference/7.13/settings.html#config-files-location
- 简单的 ElasticSearch 配置管理章节:https://www.elastic.co/guide/cn/elasticsearch/guide/current/_configuration_management.html
- ElasticStack 安装:https://www.elastic.co/guide/en/elastic-stack/current/installing-elastic-stack.html#install-order-elastic-stack
- kompose 转换 compose 为k8s文件:https://github.com/kubernetes/kompose/tree/v1.21.0
- kubectl get pvc -n devops| grep es | awk '{print $1}' | xargs kubectl delete pvc -n devops
1、安装operator
安装: https://www.elastic.co/guide/en/cloud-on-k8s/current/k8s-quickstart.html
ECK安装的每个组件如何配置: https://www.elastic.co/guide/en/cloud-on-k8s/current/k8s-orchestrating-elastic-stack-applications.html
sh
kubectl apply -f https://download.elastic.co/downloads/eck/1.6.0/all-in-one.yaml

watch kubectl -n elastic-system get pod
2、部署ES集群
yaml
apiVersion: elasticsearch.k8s.elastic.co/v1
kind: Elasticsearch
metadata:
  name: es-cluster
  # 可以指定名称空间
spec:
  version: 7.13.1
  nodeSets:
  - name: masters
    count: 3
    config:
      node.roles: ["master"]
      xpack.ml.enabled: true
    volumeClaimTemplates:
    - metadata:
        name: es-master
      spec:
        accessModes:
        - ReadWriteOnce
        resources:
          requests:
            storage: 5Gi
        storageClassName: "rook-ceph-block"
  - name: data
    count: 4
    config:
      node.roles: ["data", "ingest", "ml", "transform"]
    volumeClaimTemplates:
    - metadata:
        name: es-node
      spec:
        accessModes:
        - ReadWriteOnce
        resources:
          requests:
            storage: 5Gi
        storageClassName: "rook-ceph-block"
1、本地访问密码测试
sh
## elastic的访问
kubectl get secret es-cluster-es-elastic-user -o=jsonpath='{.data.elastic}' | base64 --decode; echo

## 1、集群内组件访问
###账号 elastic
###密码 2WC5On8Xio6EK4x4ph1T7Q54
curl -u "elastic:2WC5On8Xio6EK4x4ph1T7Q54" -k "https://es-cluster-es-http:9200"
curl -u "elastic:2WC5On8Xio6EK4x4ph1T7Q54" -k "https://10.96.9.9:9200"

## 2、集群本地访问
kubectl port-forward service/es-cluster-es-http 9200
curl -u "elastic:$PASSWORD" -k "https://localhost:9200"

## 3、做成下面的Ingress访问
2、部署ingress访问
yaml
apiVersion: networking.k8s.io/v1
kind: Ingress
metadata:
  name: elastic-ingress
  annotations:
    kubernetes.io/ingress.class: "nginx"
    nginx.ingress.kubernetes.io/backend-protocol: "HTTPS"
    nginx.ingress.kubernetes.io/server-snippet: |
      proxy_ssl_verify off;
spec:
  tls:
  - hosts:
      - elastic.itdachang.com
    secretName: itdachang.com
  rules:
  - host: elastic.itdachang.com
    http:
      paths:
      - path: /
        pathType: Prefix
        backend:
          service:
            name: es-cluster-es-http
            port:
              number: 9200
3、部署kibana
yaml
apiVersion: kibana.k8s.elastic.co/v1
kind: Kibana
metadata:
  name: kibana
spec:
  version: 7.13.1
  count: 1
  elasticsearchRef:
    name: es-cluster
配置Ingress
yaml
apiVersion: networking.k8s.io/v1
kind: Ingress
metadata:
  name: kibana-ingress
  annotations:
    kubernetes.io/ingress.class: "nginx"
    nginx.ingress.kubernetes.io/backend-protocol: "HTTPS"
    nginx.ingress.kubernetes.io/server-snippet: |
      proxy_ssl_verify off;
spec:
  tls:
  - hosts:
      - kibana.itdachang.com
    secretName: itdachang.com
  rules:
  - host: kibana.itdachang.com
    http:
      paths:
      - path: /
        pathType: Prefix
        backend:
          service:
            name: kibana-kb-http
            port:
              number: 5601
4、部署FileBeats
yaml
apiVersion: beat.k8s.elastic.co/v1beta1
kind: Beat
metadata:
  name: beats
spec:
  type: filebeat
  version: 7.13.1
  elasticsearchRef:
    name: es-cluster
  config:
    filebeat.inputs:
    - type: container
      paths:
      - /var/log/containers/*.log
  daemonSet:
    podTemplate:
      spec:
        dnsPolicy: ClusterFirstWithHostNet
        hostNetwork: true
        securityContext:
          runAsUser: 0
        containers:
        - name: filebeat
          volumeMounts:
          - name: varlogcontainers
            mountPath: /var/log/containers
          - name: varlogpods
            mountPath: /var/log/pods
          - name: varlibdockercontainers
            mountPath: /var/lib/docker/containers
        volumes:
        - name: varlogcontainers
          hostPath:
            path: /var/log/containers
        - name: varlogpods
          hostPath:
            path: /var/log/pods
        - name: varlibdockercontainers
          hostPath:
            path: /var/lib/docker/containers