本人在2023年研究生秋招后离毕业前的自学内容,正是因为在秋招求职开发过程中深感自己的本科操作系统基础并不扎实。在学习MIT 6.S081课程中,更感慨于该课程之优良,MIT的操作系统课程真的是实现(补全)一个简易版操作系统,许多国内学校的课程真不如直接放6.S081的视频。本人在编写该实验的过程中也是波折不断,那时大模型还不成熟,并且相比于MIT 6.828课程,6.S081更加难以调试。几乎所有的lab都没有办法全部通过,受限于时间有限,作者当时也搜索了许多博客的实现对照着进行了修改。
本人仓库代码:xv6-labs-2020 。参考价值很低,建议多搜索其他博客
主要说明
主要资源:
- 课程地址:【操作系统工程】精译【MIT 公开课 MIT6.S081】_哔哩哔哩_bilibili 或 MIT 6.S081 2020 操作系统 中英文字幕_哔哩哔哩_bilibili
- 对应2020版课程:6.S081: Operating System Engineering
- 旧版 xv6 中文文档(2012版):GitHub - ranxian/xv6-chinese: 中文版的 MIT xv6 文档
- 新版 xv6 中文文档(2020版):GitHub - FrankZn/xv6-riscv-book-Chinese
- 课程翻译(和6.824是同一个哥们翻译的):简介 - MIT6.S081
注意:
- 其实和MIT6.824一样,看视频课程前要先看Prepare
环境安装:
- 正常来说要参考:https://pdos.csail.mit.edu/6.828/2020/tools.html
- 实际上由于我在之前做了一些MIT 6.824的实验,所以刚好还可以用WSL,我是参考的Mit6.s081环境配置踩坑之旅WSL2+VScode-CSDN博客
日常启动WSL:
bash
cd D:\WSLUbuntu\Ubuntu
.\ubuntu2004.exe
QEMU:
- 编译xv6并开启模拟器:
make qemu - 退出qemu:按下
ctrl+a松开后再按x退出qemu。 - 使用
Ctrl+p打印进程信息 - 启动qemu后按
ctrl+a``c可以进入qemu monitor。
实验说明
Lab:
- 由于不同的子实验要切换不同分支,所以不能删除.git文件,通过修改远程仓库地址来切换。
- 本人实验地址:GitHub - StevenGerrad/xv6-labs-2020
- GDB的使用放在LEC 2 C and gdb中。
- 注意,实验不一定是马上做,基本上给出Assign后的LEC只要还没有截至,课上的内容可能也是关于实验的,比如Lab 2 是LEC 2 提出来的,但是应该在看完LEC 3 之后做。
- 整个Lab代码中,
kernel/下为内核代码,user/下为用户态代码。 - 整个项目汇编和c混杂,内核又涉及大量寄存器,所以在学完LEC 6/LEC 7前做Lab可能会很痛苦。这两个课程的内容也要好好整理下。
GDB:
- 调试主要采用命令地址断点
b *0x[地址],一般用户命令地址查看user/sh.sam,内核命令地址查看kernel/kernel.asm。或直接指定文件地址 eg.b trap.c:207 - 使用
where/bt打印函数调用栈 - 有时
print无法打印当前函数内的临时变量,但如果该变量也是全局变量的一部分,可以打印全局变量 print打印寄存器要加$符号,如print $pcinfo frame/i frame,查看当前Stack Frame的信息。- 使用
info b查看现有的断点,使用delete删除。 - 添加条件断点:
break *0x80002882 if $scause != 8 - 添加临时断点
tbreak,触发一次后消失。
有些实验过程中帮助调试的代码(由于实验间代码不继承,拷到这里方便自己用):
backtrace(来自Lab: traps)
c
static inline uint64
r_fp()
{
  uint64 x;
  asm volatile("mv %0, s0" : "=r" (x) );
  return x;
}
c
void
backtrace(void)
{
  uint64 fp = r_fp();
  while(fp != PGROUNDUP(fp)){
    uint64 ra = *(uint64*)(fp - 8);
    printf("%p\n", ra);
    fp = *(uint64*)(fp - 16);
  }
}vmprint(来自Lab: page tables)
c
int
exec(char *path, char **argv)
{
  ...

  if(p->pid == 1) vmprint(p->pagetable, 0);

  return argc; // this ends up in a0, the first argument to main(argc, argv)

  ...
}
c
void
vmprint(pagetable_t pagetable, int level)
{
  if(level == 0){
    printf("page table %p\n", pagetable);
  }
  // there are 2^9 = 512 PTEs in a page table.
  for(int i = 0; i < 512; i++){
    pte_t pte = pagetable[i];
    if(pte & PTE_V){
      // this PTE points to a lower-level page table.
      uint64 child = PTE2PA(pte);
      for(int j=0;j<level;j++){
        printf(".. ");
      }
      printf("..%d: pte %p pa %p\n", i, pte, child);
      if(level < 2) vmprint((pagetable_t)child, level + 1);
    }
  }
}
Lab guidance
官方Lab说明:https://pdos.csail.mit.edu/6.828/2020/labs/guidance.html
Here are some tips for debugging your solutions:
- Make sure you understand C and pointers. The book "The C programming language (second edition)" by Kernighan and Ritchie is a succinct description of C. Some useful pointer exercises are here. Unless you are already thoroughly versed in C, do not skip or skim the pointer exercises above. If you do not really understand pointers in C, you will suffer untold pain and misery in the labs, and then eventually come to understand them the hard way. Trust us; you don't want to find out what "the hard way" is.A few pointer common idioms are in particular worth remembering: 确保你理解C语言和指针。Kernighan和Ritchie的《C编程语言(第二版)》一书对C进行了简明的描述。除非你已经完全精通C语言,否则不要跳过或略读上面的指针练习。如果您不真正理解C中的指针,那么您将在实验室中遭受无尽的痛苦和痛苦,然后最终以艰难的方式理解它们。相信我们;你不会想知道"艰难的方式"是什么。一些常用的指针习语特别值得记住
- If
<font style="color:rgb(0, 0, 0);">int *p = (int*)100</font>, then<font style="color:rgb(0, 0, 0);">(int)p + 1</font>and<font style="color:rgb(0, 0, 0);">(int)(p + 1)</font>are different numbers: the first is 101 but the second is 104. When adding an integer to a pointer, as in the second case, the integer is implicitly multiplied by the size of the object the pointer points to. 第一个是101,第二个是104。当向指针添加整数时,如第二种情况,该整数隐式地乘以指针所指向的对象的大小。 <font style="color:rgb(0, 0, 0);">p[i]</font>is defined to be the same as<font style="color:rgb(0, 0, 0);">*(p+i)</font>, referring to the i'th object in the memory pointed to by p. The above rule for addition helps this definition work when the objects are larger than one byte. pi被定义为与*(p+i)相同,指向p所指向的内存中的第i个对象。当对象大于一个字节时,上述加法规则有助于此定义。<font style="color:rgb(0, 0, 0);">&p[i]</font>is the same as<font style="color:rgb(0, 0, 0);">(p+i)</font>, yielding the address of the i'th object in the memory pointed to by p.&p[i]与(p+i)相同,产生p所指向的内存中第i个对象的地址。
- If
- Although most C programs never need to cast between pointers and integers, operating systems frequently do. Whenever you see an addition involving a memory address, ask yourself whether it is an integer addition or pointer addition and make sure the value being added is appropriately multiplied or not. 尽管大多数C程序从不需要在指针和整数之间进行强制转换,但操作系统经常需要这样做。每当您看到涉及内存地址的加法时,请问问自己它是整数加法还是指针加法,并确保所添加的值是否被适当地乘以。
- If you have an exercise partially working, checkpoint your progress by committing your code. If you break something later, you can then roll back to your checkpoint and go forward in smaller steps. To learn more about Git, take a look at the Git user's manual, or, you may find this CS-oriented overview of Git useful. 如果您的练习部分有效,请通过提交代码来检查您的进度。如果您稍后破坏了某些内容,那么您可以回滚到检查点并以较小的步骤继续前进。要了解有关Git的更多信息,请查看Git用户手册,或者,您可能会发现这个面向cs的Git概述很有用。
- If you fail a test, make sure you understand why your code fails the test. Insert print statements until you understand what is going on. 如果您没有通过测试,请确保您理解代码没有通过测试的原因。插入print语句,直到您理解发生了什么。
- You may find that your print statements may produce much output that you would like to search through; one way to do that is to run
<font style="color:rgb(0, 0, 0);">make qemu</font>inside of script (run man script on your machine), which logs all console output to a file, which you can then search. Don't forget to exit script. 你可能会发现你的print语句可能会产生很多你想要搜索的输出;一种方法是在script中运行make qemu(在您的机器上运行man script),它将所有控制台输出记录到一个文件中,然后您可以搜索该文件。不要忘记退出脚本。 - In many cases, print statements will be sufficient, but sometimes being able to single step through some assembly code or inspecting the variables on the stack is helpful. To use gdb with xv6, run make make qemu-gdb in one window, run gdb (or riscv64-linux-gnu-gdb ) in another window, set a break point, followed by followed by 'c' (continue), and xv6 will run until it hits the breakpoint. (See Using the GNU Debugger for helpful GDB tips.) 在许多情况下,print语句就足够了,但有时能够单步执行一些汇编代码或检查堆栈上的变量是有帮助的。要将gdb与xv6一起使用,请在一个窗口中运行 make
make qemu-gdb,在另一个窗口中运行gdb(或riscv64-linux-gnu-gdb),设置断点,后面跟着'c' (continue),然后xv6将运行直到到达断点。(参见 使用GNU调试器 获得有用的GDB提示。) - If you want to see what the assembly is that the compiler generates for the kernel or to find out what the instruction is at a particular kernel address, see the file
<font style="color:rgb(0, 0, 0);">kernel.asm</font>, which the Makefile produces when it compiles the kernel. (The Makefile also produces .asm for all user programs.) 如果您想了解编译器为内核生成的程序集是什么,或者想了解特定内核地址上的指令是什么,请参阅文件kernel。它是Makefile在编译内核时生成的。(Makefile还为所有用户程序生成.asm。) - If the kernel panics, it will print an error message listing the value of the program counter when it crashed; you can search
<font style="color:rgb(0, 0, 0);">kernel.asm</font>to find out in which function the program counter was when it crashed, or you can run addr2line -e kernel/kernel pc-value (run man addr2line for details). If you want to get backtrace, restart using gdb: run 'make qemu-gdb' in one window, run gdb (or riscv64-linux-gnu-gdb) in another window, set breakpoint in panic ('b panic'), followed by followed by 'c' (continue). When the kernel hits the break point, type 'bt' to get a backtrace. 如果内核出现恐慌,它将打印一条错误消息,列出程序计数器在崩溃时的值;你可以搜索kernel。Asm查找程序计数器崩溃时在哪个函数中,或者可以运行addr2line -e kernel/kernel pc-value(运行man addr2line了解详情)。如果你想获得回溯,使用gdb重新启动:在一个窗口中运行'make qemu-gdb',在另一个窗口中运行gdb(或riscv64-linux-gnu-gdb),在panic ('b panic')中设置断点,然后在后面跟着'c' (continue)。当内核到达断点时,键入'bt'以获得回溯。 - If your kernel hangs (e.g., due to a deadlock) or cannot execute further (e.g., due to a page fault when executing a kernel instruction), you can use gdb to find out where it is hanging. Run run 'make qemu-gdb' in one window, run gdb (riscv64-linux-gnu-gdb) in another window, followed by followed by 'c' (continue). When the kernel appears to hang hit Ctrl-C in the qemu-gdb window and type 'bt' to get a backtrace. 如果内核挂起(例如,由于死锁)或不能继续执行(例如,由于在执行内核指令时出现页面错误),您可以使用gdb找出它挂起的位置。在一个窗口中运行Run 'make qemu-gdb',在另一个窗口中运行gdb (riscv64-linux-gnu-gdb),后面跟着'c'(继续)。当内核出现挂起时,在qemu-gdb窗口中按Ctrl-C并键入'bt'以获得回溯。
- qemu has a "monitor" that lets you query the state of the emulated machine. You can get at it by typing control-a c (the "c" is for console). A particularly useful monitor command is info mem to print the page table. You may need to use the cpu command to select which core info mem looks at, or you could start qemu with make CPUS=1 qemu to cause there to be just one core. Qemu有一个"监视器",可以让您查询模拟机器的状态。您可以通过输入control-a c("c"表示控制台)来获取它。一个特别有用的监视器命令是info mem,用于打印页表。您可能需要使用cpu命令来选择mem查看哪个内核信息,或者您可以使用make CPUS=1 qemu启动qemu,以使只有一个内核。
实验提示
- 使用
git diff:You can keep track of your changes by using the git diff command. Running git diff will display the changes to your code since your last commit, and git diff origin/util will display the changes relative to the initial xv6-labs-2020 code. Here, origin/xv6-labs-2020 is the name of the git branch with the initial code you downloaded for the class. - xv6 has no ps command, but, if you type Ctrl-p, the kernel will print information about each process. If you try it now, you'll see two lines: one for init, and one for sh. xv6没有ps命令,但是,如果您键入Ctrl-p,内核将打印关于每个进程的信息。如果现在尝试一下,将看到两行:一行用于init,另一行用于sh。
GDB调试
GDB基础请看LEC 2。这里简要记录一些有用的过程
LEC 5: 查看Stack Frame
info frame/i frame,查看当前Stack Frame的信息。(摘录自LEC 5)
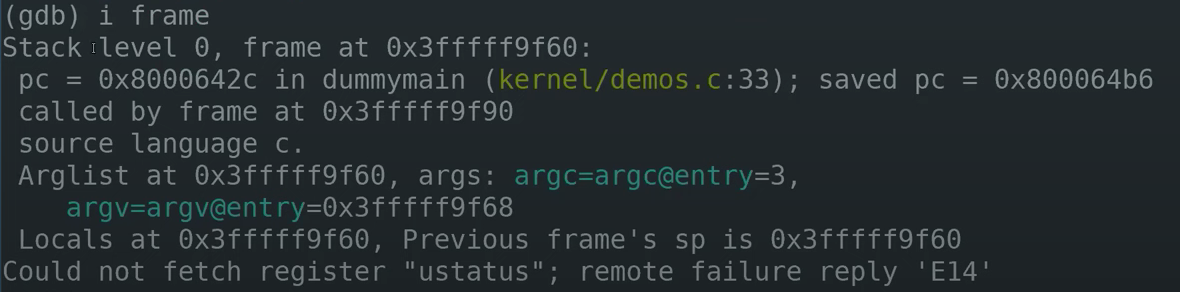
- Stack level 0,表明这是调用栈的最底层。我们可以跳转到,然后帧frame在...
- pc(program counter),当前的程序计数器
- saved pc,demo4的位置,表明当前函数要返回的位置
- source language c,表明这是C代码
- Arglist at,表明参数的起始地址。当前的参数都在寄存器中,可以看到argc=3,argv是一个地址。可以使用
i args查看有关参数的信息
如果输入backtrace(简写bt)可以看到从当前调用栈开始的所有Stack Frame。
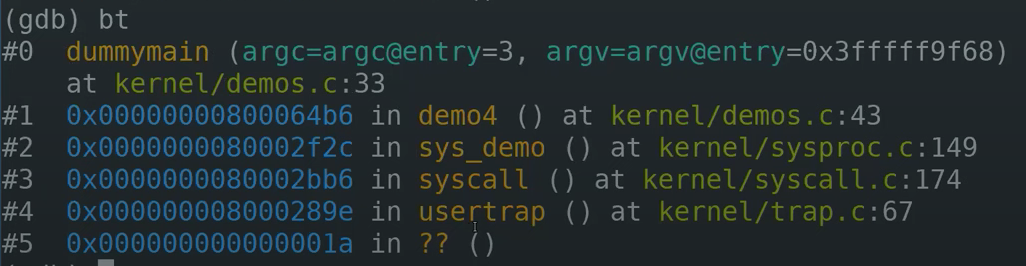
我们可以发现,我们先后到达usertrap、syscall、sys_demo、demo4函数,最后转到dummymain。
如果对某一个Stack Frame感兴趣,可以先定位到那个frame再输入info frame ,假设对syscall的Stack Frame感兴趣。(使用frame 3,这里的标号3就是backtrace命令输出的标号),然后查看栈帧。
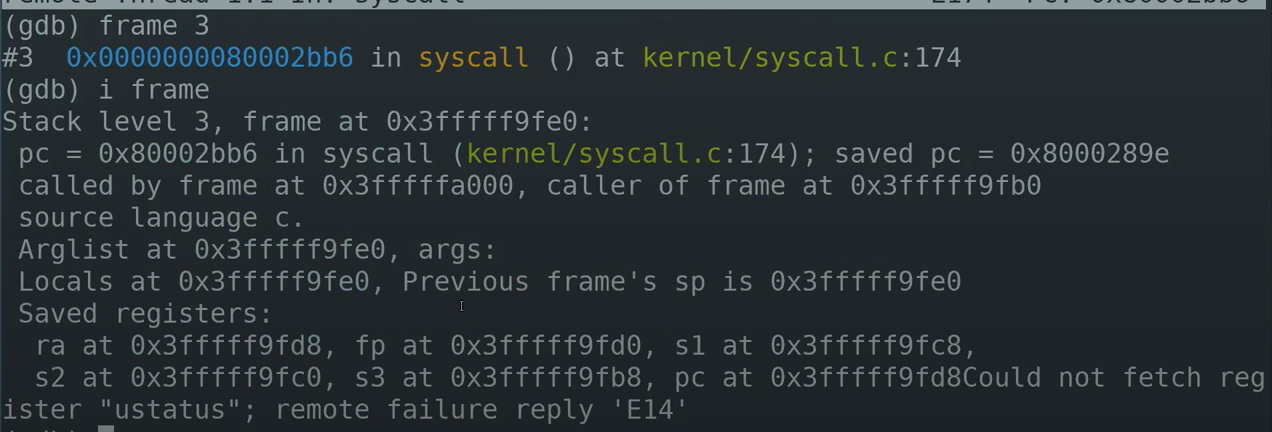
在这个Stack Frame中有更多的信息,有一堆的Saved Registers,有一些本地变量,这个函数没有参数,可以看到程序计数器应该跳回哪里(0x8000289e)等等。这些信息对于调试代码来说超级重要。(下一个实验就是实现自己的backtrace help)。所以backtrace非常有用。
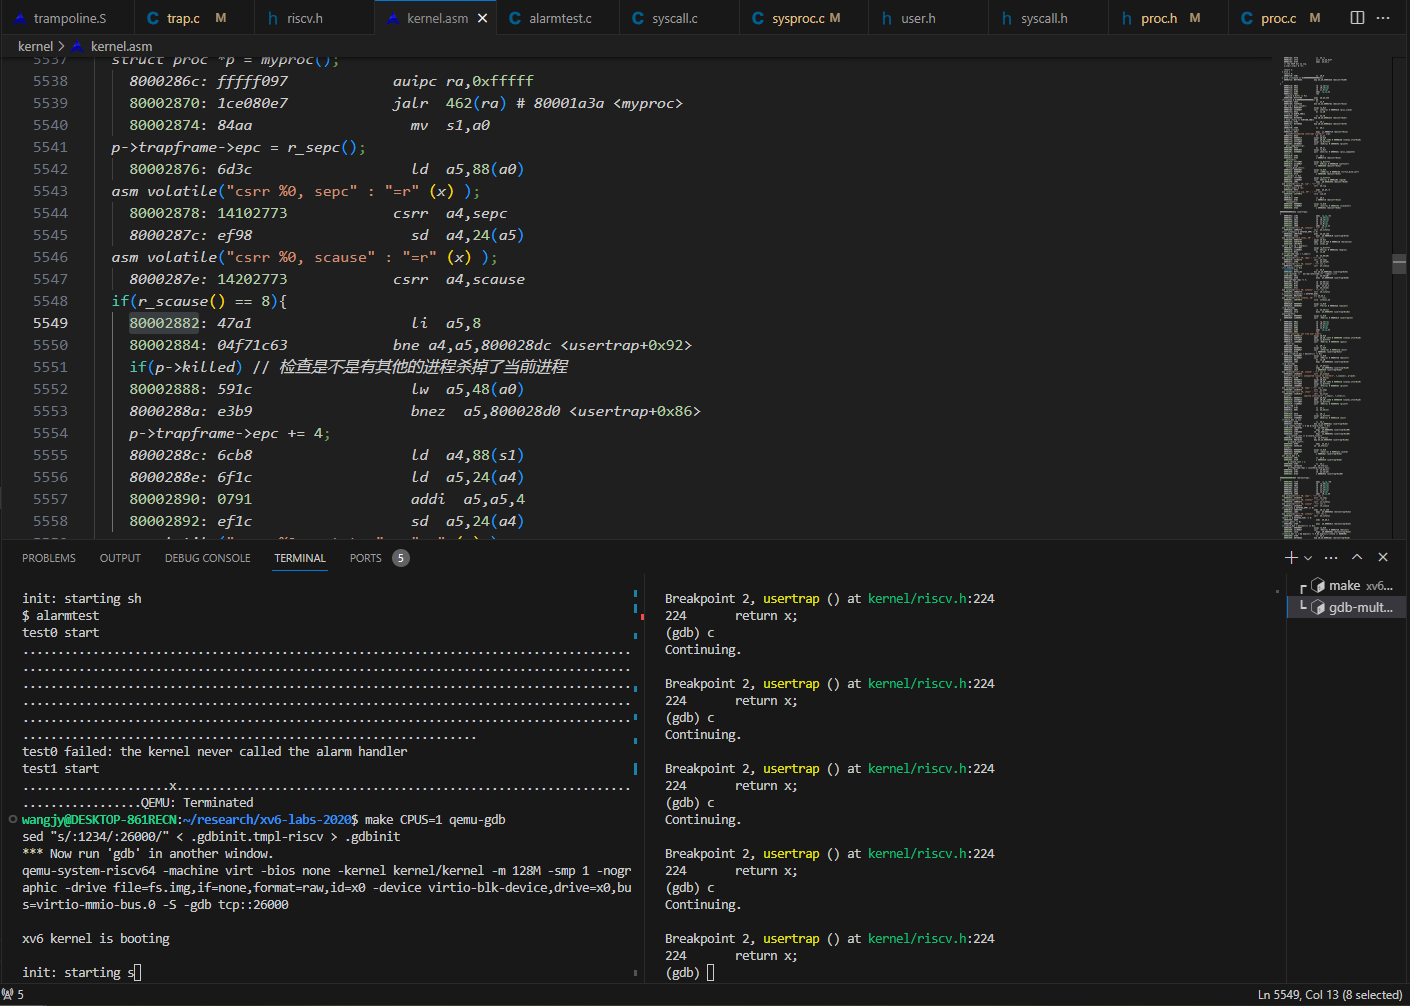
Lab traps:普通调试
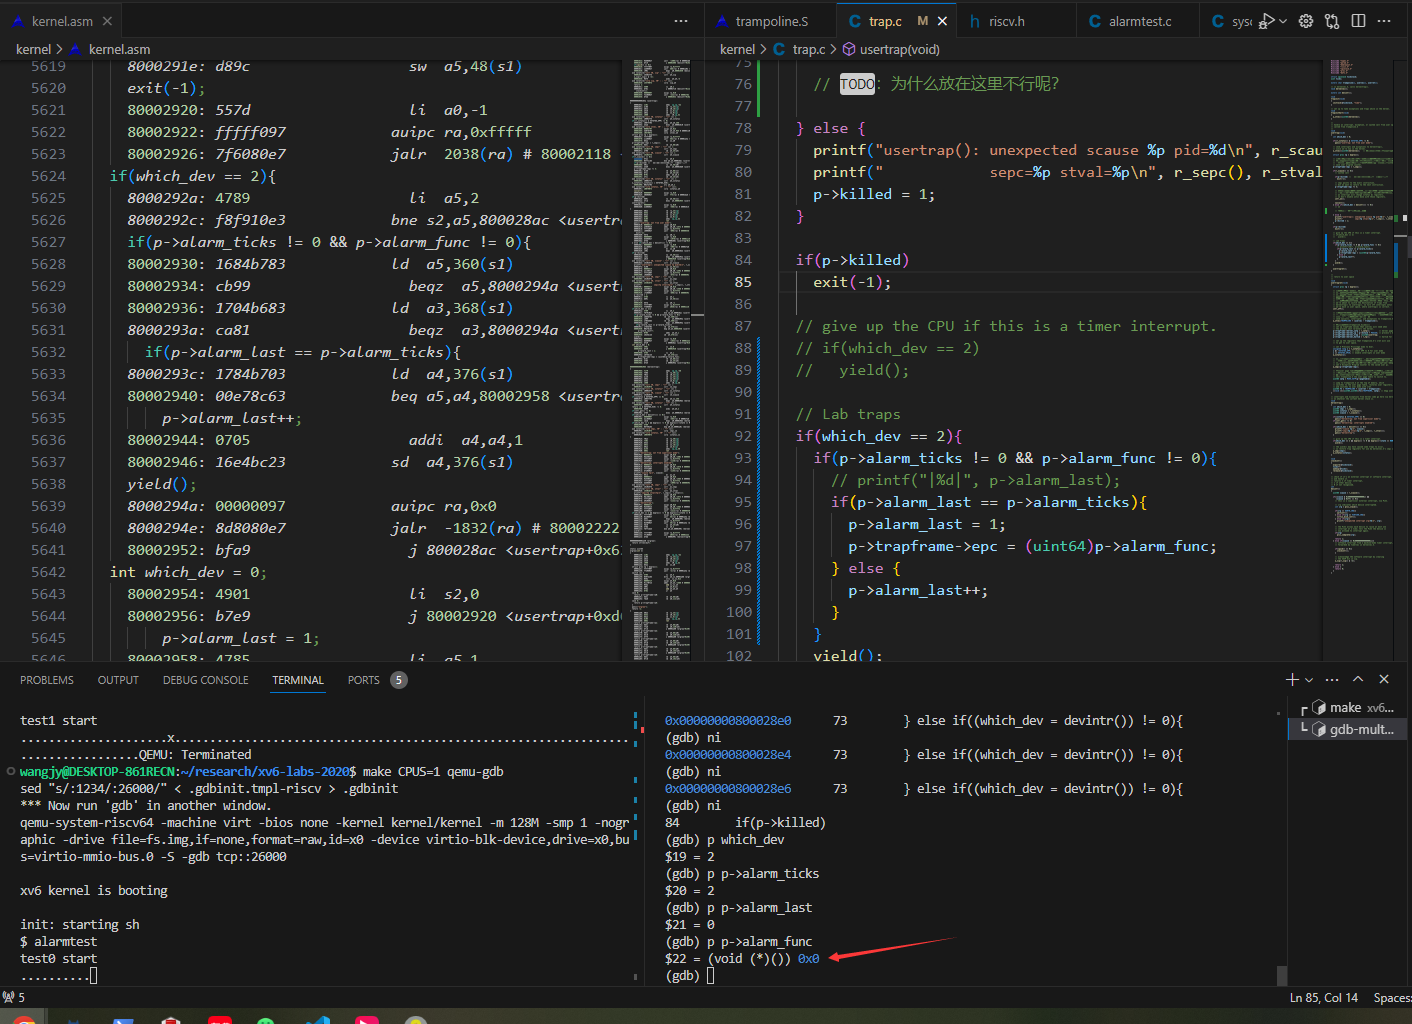
Lab traps 实验:在kernel.asm文件中找内核地址加断点,如b *0x80002882加在了
发现一件事,每次continue只打印一个字母,难道打印每个字符都陷入了内核?真是夸张。
使用info b查看现有的断点,使用delete删除。
大部分调用都是系统调用,为了专门查看timer interrupt,添加条件断点:break *0x80002882 if $scause != 8
发现现在的bug是:用户的函数指针指向了0