3.4.3 anomaly_detection.py
脚本功能 :Z-Score算法实时异常检测与告警系统 使用方式 :python 3.4.3_anomaly_detection.py
#!/usr/bin/env python3
# -*- coding: utf-8 -*-
"""
3.4.3 实时异常检测系统
功能:
- Z-Score统计异常检测
- 滑动窗口均值/标准差计算
- 动态阈值调整
- 多级告警(警告/严重)
- 可视化监控面板
使用方式:python 3.4.3_anomaly_detection.py
"""

import time
import logging
from datetime import datetime, timedelta
from typing import List, Dict, Optional, Callable, Deque
from collections import deque
from dataclasses import dataclass
import threading

import numpy as np
import polars as pl
from kafka import KafkaConsumer, KafkaProducer
import matplotlib.pyplot as plt
from matplotlib.animation import FuncAnimation
import matplotlib.patches as mpatches

logging.basicConfig(level=logging.INFO)
logger = logging.getLogger(__name__)


@dataclass
class AnomalyEvent:
    """异常事件"""
    timestamp: datetime
    metric_name: str
    value: float
    expected_mean: float
    expected_std: float
    z_score: float
    severity: str  # 'warning', 'critical'
    description: str


class ZScoreDetector:
    """
    Z-Score异常检测器
    基于滑动窗口统计
    """

    def __init__(self,
                 window_size: int = 100,
                 threshold_warning: float = 2.0,
                 threshold_critical: float = 3.0,
                 min_samples: int = 30):
        self.window_size = window_size
        self.threshold_warning = threshold_warning
        self.threshold_critical = threshold_critical
        self.min_samples = min_samples

        # 滑动窗口数据
        self.windows: Dict[str, Deque[float]] = {}
        self.timestamps: Dict[str, Deque[datetime]] = {}

        # 统计缓存
        self.stats: Dict[str, Dict] = {}

        # 告警回调
        self.alert_handlers: List[Callable] = []

    def register_alert_handler(self, handler: Callable[[AnomalyEvent], None]):
        """注册告警处理器"""
        self.alert_handlers.append(handler)

    def update_window(self, metric_name: str, value: float, timestamp: Optional[datetime] = None):
        """
        更新滑动窗口
        """
        if timestamp is None:
            timestamp = datetime.utcnow()

        # 初始化窗口
        if metric_name not in self.windows:
            self.windows[metric_name] = deque(maxlen=self.window_size)
            self.timestamps[metric_name] = deque(maxlen=self.window_size)

        # 添加数据
        self.windows[metric_name].append(value)
        self.timestamps[metric_name].append(timestamp)

        # 更新统计
        if len(self.windows[metric_name]) >= self.min_samples:
            window_data = list(self.windows[metric_name])
            self.stats[metric_name] = {
                'mean': np.mean(window_data),
                'std': np.std(window_data),
                'min': np.min(window_data),
                'max': np.max(window_data),
                'count': len(window_data)
            }

    def detect(self, metric_name: str, value: float, timestamp: Optional[datetime] = None) -> Optional[AnomalyEvent]:
        """
        检测单点异常
        """
        if metric_name not in self.stats:
            return None

        stats = self.stats[metric_name]
        if stats['std'] == 0:
            return None

        # 计算Z-Score
        z_score = (value - stats['mean']) / stats['std']

        # 判断严重级别
        abs_z = abs(z_score)
        if abs_z >= self.threshold_critical:
            severity = 'critical'
        elif abs_z >= self.threshold_warning:
            severity = 'warning'
        else:
            return None

        # 构造异常事件
        event = AnomalyEvent(
            timestamp=timestamp or datetime.utcnow(),
            metric_name=metric_name,
            value=value,
            expected_mean=stats['mean'],
            expected_std=stats['std'],
            z_score=z_score,
            severity=severity,
            description=f"Value {value:.2f} is {abs_z:.2f} std devs from mean"
        )

        # 触发告警
        for handler in self.alert_handlers:
            try:
                handler(event)
            except Exception as e:
                logger.error(f"告警处理失败: {e}")

        return event

    def process(self, metric_name: str, value: float, timestamp: Optional[datetime] = None) -> Optional[AnomalyEvent]:
        """
        完整处理流程:更新窗口 + 检测
        """
        self.update_window(metric_name, value, timestamp)
        return self.detect(metric_name, value, timestamp)

    def get_stats(self, metric_name: str) -> Optional[Dict]:
        """获取当前统计"""
        return self.stats.get(metric_name)


class StreamingAnomalyDetector:
    """
    流式异常检测引擎
    集成Kafka输入输出
    """

    def __init__(self,
                 kafka_bootstrap: str = "localhost:9092",
                 input_topic: str = "metrics.stream",
                 output_topic: str = "anomalies.detected"):
        self.kafka_bootstrap = kafka_bootstrap
        self.input_topic = input_topic
        self.output_topic = output_topic

        self.detector = ZScoreDetector(
            window_size=200,
            threshold_warning=2.5,
            threshold_critical=3.5
        )

        self.anomaly_history: List[AnomalyEvent] = []
        self.running = False

        # 配置告警
        self._setup_alerts()

    def _setup_alerts(self):
        """设置告警处理器"""
        # 1. 日志告警
        self.detector.register_alert_handler(self._log_alert)

        # 2. Kafka告警(用于下游处理)
        self.alert_producer = KafkaProducer(
            bootstrap_servers=self.kafka_bootstrap,
            value_serializer=lambda v: json.dumps(v, default=str).encode('utf-8')
        )
        self.detector.register_alert_handler(self._kafka_alert)

        # 3. PagerDuty模拟(严重告警)
        self.detector.register_alert_handler(self._pagerduty_alert)

    def _log_alert(self, event: AnomalyEvent):
        """日志记录告警"""
        logger.warning(f"[{event.severity.upper()}] {event.metric_name}: {event.description} "
                      f"(Z-Score: {event.z_score:.2f})")

    def _kafka_alert(self, event: AnomalyEvent):
        """发送到Kafka"""
        try:
            self.alert_producer.send(
                self.output_topic,
                key=event.metric_name.encode(),
                value={
                    'timestamp': event.timestamp.isoformat(),
                    'metric': event.metric_name,
                    'value': event.value,
                    'z_score': event.z_score,
                    'severity': event.severity,
                    'baseline_mean': event.expected_mean,
                    'baseline_std': event.expected_std
                }
            )
        except Exception as e:
            logger.error(f"Kafka告警发送失败: {e}")

    def _pagerduty_alert(self, event: AnomalyEvent):
        """严重告警PagerDuty通知"""
        if event.severity == 'critical':
            logger.critical(f"PAGERDUTY ALERT: {event.metric_name} CRITICAL - {event.description}")
            # 实际应调用PagerDuty API

    def run(self, duration_seconds: int = 60):
        """运行检测"""
        self.running = True

        consumer = KafkaConsumer(
            self.input_topic,
            bootstrap_servers=self.kafka_bootstrap,
            group_id=f"anomaly-detector-{int(time.time())}",
            auto_offset_reset='latest',
            value_deserializer=lambda m: json.loads(m.decode('utf-8'))
        )

        logger.info(f"启动异常检测: {self.input_topic} -> {self.output_topic}")

        try:
            while self.running:
                messages = consumer.poll(timeout_ms=1000)

                for tp, records in messages.items():
                    for record in records:
                        data = record.value

                        # 支持多指标
                        for metric_name, value in data.items():
                            if isinstance(value, (int, float)):
                                anomaly = self.detector.process(
                                    metric_name=metric_name,
                                    value=value,
                                    timestamp=datetime.fromtimestamp(record.timestamp / 1000)
                                )

                                if anomaly:
                                    self.anomaly_history.append(anomaly)

        except KeyboardInterrupt:
            logger.info("停止检测")
        finally:
            consumer.close()
            self.alert_producer.close()
            self.running = False

    def generate_report(self) -> Dict:
        """生成检测报告"""
        if not self.anomaly_history:
            return {'message': 'No anomalies detected'}

        df = pl.DataFrame([{
            'timestamp': a.timestamp,
            'metric': a.metric_name,
            'severity': a.severity,
            'z_score': abs(a.z_score),
            'value': a.value
        } for a in self.anomaly_history])

        return {
            'total_anomalies': len(self.anomaly_history),
            'critical_count': len(df.filter(pl.col('severity') == 'critical')),
            'warning_count': len(df.filter(pl.col('severity') == 'warning')),
            'by_metric': df.groupby('metric').count().to_dicts(),
            'by_hour': df.with_columns(
                pl.col('timestamp').dt.hour().alias('hour')
            ).groupby('hour').count().to_dicts(),
            'avg_z_score': df['z_score'].mean()
        }

    def visualize_detection(self, output_file: str = "anomaly_detection.png"):
        """可视化检测结果"""
        if not self.anomaly_history:
            logger.warning("无异常数据可可视化")
            return

        fig, axes = plt.subplots(2, 2, figsize=(14, 10))
        fig.suptitle('Real-time Anomaly Detection Report', fontsize=16, fontweight='bold')

        # 准备数据
        anomalies = self.anomaly_history
        metrics = list(set(a.metric_name for a in anomalies))

        # 1. 时间线
        ax1 = axes[0, 0]
        times = [a.timestamp for a in anomalies]
        z_scores = [abs(a.z_score) for a in anomalies]
        colors = ['red' if a.severity == 'critical' else 'orange' for a in anomalies]

        ax1.scatter(times, z_scores, c=colors, s=100, alpha=0.7)
        ax1.axhline(y=self.detector.threshold_warning, color='orange', linestyle='--', label='Warning')
        ax1.axhline(y=self.detector.threshold_critical, color='red', linestyle='--', label='Critical')
        ax1.set_xlabel('Time')
        ax1.set_ylabel('|Z-Score|')
        ax1.set_title('Anomaly Timeline')
        ax1.legend()

        # 2. 指标分布
        ax2 = axes[0, 1]
        metric_counts = {}
        for a in anomalies:
            metric_counts[a.metric_name] = metric_counts.get(a.metric_name, 0) + 1

        bars = ax2.bar(metric_counts.keys(), metric_counts.values(), color='#F44336')
        ax2.set_title('Anomalies by Metric')
        ax2.set_ylabel('Count')
        ax2.tick_params(axis='x', rotation=45)

        # 3. 严重级别饼图
        ax3 = axes[1, 0]
        critical = len([a for a in anomalies if a.severity == 'critical'])
        warning = len([a for a in anomalies if a.severity == 'warning'])

        ax3.pie([warning, critical], labels=['Warning', 'Critical'],
               colors=['#FF9800', '#F44336'], autopct='%1.1f%%', startangle=90)
        ax3.set_title('Severity Distribution')

        # 4. 统计摘要
        ax4 = axes[1, 1]
        report = self.generate_report()

        summary_text = f"""
        Detection Summary:

        Total Anomalies: {report['total_anomalies']}
        Critical: {report['critical_count']}
        Warning: {report['warning_count']}
        Avg Z-Score: {report['avg_z_score']:.2f}

        Configuration:
        Window Size: {self.detector.window_size}
        Warning Threshold: {self.detector.threshold_warning}
        Critical Threshold: {self.detector.threshold_critical}

        Metrics Monitored:
        {', '.join(metrics)}
        """

        ax4.text(0.1, 0.9, summary_text, transform=ax4.transAxes,
                fontsize=10, verticalalignment='top', family='monospace',
                bbox=dict(boxstyle='round', facecolor='lightblue', alpha=0.8))
        ax4.set_xlim(0, 1)
        ax4.set_ylim(0, 1)
        ax4.axis('off')
        ax4.set_title('Summary')

        plt.tight_layout()
        plt.savefig(output_file, dpi=150, bbox_inches='tight')
        logger.info(f"异常检测报告已保存: {output_file}")
        plt.show()


def simulate_anomaly_detection():
    """模拟异常检测"""
    print("=" * 60)
    print("3.4.3 Z-Score异常检测演示")
    print("=" * 60)

    detector = ZScoreDetector(
        window_size=50,
        threshold_warning=2.0,
        threshold_critical=3.0
    )

    # 注册告警处理器
    anomalies_captured = []
    detector.register_alert_handler(lambda e: anomalies_captured.append(e))

    # 生成模拟数据(包含异常)
    print("\n生成模拟数据流...")
    np.random.seed(42)

    data_stream = []
    for i in range(200):
        # 正常数据:均值100,标准差10
        if i < 100 or (120 <= i < 150):
            value = np.random.normal(100, 10)
        elif 100 <= i < 110:
            # 注入异常:均值偏移到150
            value = np.random.normal(150, 15)
        else:
            # 注入异常:方差增大
            value = np.random.normal(100, 50)

        data_stream.append({
            'timestamp': datetime(2024, 1, 1, 12, 0, 0) + timedelta(minutes=i),
            'value': value
        })

        # 处理
        detector.process('cpu_usage', value, data_stream[-1]['timestamp'])

    print(f"检测到 {len(anomalies_captured)} 个异常")

    for a in anomalies_captured[:5]:
        print(f"  [{a.severity}] {a.timestamp.strftime('%H:%M')}: "
              f"value={a.value:.1f}, z={a.z_score:.2f}")

    # 可视化
    fig, axes = plt.subplots(2, 1, figsize=(12, 8))
    fig.suptitle('Z-Score Anomaly Detection Simulation', fontsize=14, fontweight='bold')

    # 1. 数据流
    ax1 = axes[0]
    times = [d['timestamp'] for d in data_stream]
    values = [d['value'] for d in data_stream]

    ax1.plot(times, values, 'b-', alpha=0.7, label='Data')

    # 标记异常
    for a in anomalies_captured:
        color = 'red' if a.severity == 'critical' else 'orange'
        ax1.scatter(a.timestamp, a.value, c=color, s=100, zorder=5)

    ax1.axhline(y=100, color='green', linestyle='--', alpha=0.5, label='Mean (100)')
    ax1.set_ylabel('Value')
    ax1.set_title('Data Stream with Anomalies')
    ax1.legend()

    # 2. Z-Score
    ax2 = axes[1]

    # 重建Z-Score历史(简化)
    z_history = []
    for i, d in enumerate(data_stream):
        if i >= 30:  # 有统计后
            window = [v['value'] for v in data_stream[max(0, i-49):i+1]]
            mean = np.mean(window)
            std = np.std(window)
            if std > 0:
                z = (d['value'] - mean) / std
                z_history.append(z)
            else:
                z_history.append(0)
        else:
            z_history.append(0)

    ax2.plot(times, [abs(z) for z in z_history], 'g-', label='|Z-Score|')
    ax2.axhline(y=detector.threshold_warning, color='orange', linestyle='--', label='Warning')
    ax2.axhline(y=detector.threshold_critical, color='red', linestyle='--', label='Critical')
    ax2.fill_between(times, detector.threshold_warning, 10, where=[abs(z) > detector.threshold_warning for z in z_history],
                     alpha=0.3, color='red')
    ax2.set_ylabel('|Z-Score|')
    ax2.set_title('Z-Score Evolution')
    ax2.legend()

    plt.tight_layout()
    plt.savefig('anomaly_detection_simulation.png', dpi=150)
    plt.show()


if __name__ == "__main__":
    simulate_anomaly_detection()
3.4.4 latency_monitoring.py
脚本功能 :端到端延迟监控,Kafka Lag监控与SLI设定 使用方式 :python 3.4.4_latency_monitoring.py
#!/usr/bin/env python3
# -*- coding: utf-8 -*-
"""
3.4.4 端到端延迟监控与SLI设定
功能:
- Kafka Consumer Lag监控
- 端到端处理延迟计算
- SLI/SLO定义与监控
- 延迟分布可视化与告警
使用方式:python 3.4.4_latency_monitoring.py
"""

import time
import json
import logging
from datetime import datetime, timedelta
from typing import Dict, List, Optional, Callable
from dataclasses import dataclass, asdict
from collections import deque
import threading

import numpy as np
import matplotlib.pyplot as plt
from kafka import KafkaConsumer, TopicPartition, KafkaAdminClient
from kafka.admin import NewTopic
import pandas as pd

logging.basicConfig(level=logging.INFO)
logger = logging.getLogger(__name__)


@dataclass
class LatencyMetric:
    """延迟指标"""
    timestamp: datetime
    stage: str
    latency_ms: float
    topic: Optional[str] = None
    partition: Optional[int] = None
    offset: Optional[int] = None
    metadata: Dict = None


@dataclass
class SLIConfig:
    """SLI配置"""
    name: str
    target_p99_ms: float
    target_p95_ms: float
    target_avg_ms: float
    evaluation_window_minutes: int = 5


class KafkaLagMonitor:
    """
    Kafka Lag监控器
    实时监控消费延迟
    """

    def __init__(self,
                 kafka_bootstrap: str = "localhost:9092",
                 consumer_group: str = "monitor-group"):
        self.kafka_bootstrap = kafka_bootstrap
        self.consumer_group = consumer_group
        self.admin_client = KafkaAdminClient(bootstrap_servers=kafka_bootstrap)
        self.consumer = KafkaConsumer(
            bootstrap_servers=kafka_bootstrap,
            group_id=consumer_group
        )
        self.lag_history: deque = deque(maxlen=1000)
        self.running = False

    def get_current_lag(self, topic: str, group_id: Optional[str] = None) -> Dict:
        """
        获取当前Lag情况
        """
        if group_id is None:
            group_id = self.consumer_group

        try:
            # 获取分区信息
            partitions = self.consumer.partitions_for_topic(topic)
            if not partitions:
                return {'error': 'No partitions found'}

            topic_partitions = [TopicPartition(topic, p) for p in partitions]

            # 获取Log End Offset(生产者写入位置)
            end_offsets = self.consumer.end_offsets(topic_partitions)

            # 获取Committed Offset(消费者消费位置)
            committed = {
                tp: self.consumer.committed(tp) for tp in topic_partitions
            }

            # 计算Lag
            lag_per_partition = {}
            total_lag = 0

            for tp in topic_partitions:
                end_offset = end_offsets.get(tp, 0)
                committed_offset = committed.get(tp)

                if committed_offset is not None:
                    lag = end_offset - committed_offset
                else:
                    lag = end_offset  # 从未消费过

                lag_per_partition[tp.partition] = {
                    'end_offset': end_offset,
                    'committed_offset': committed_offset if committed_offset else 0,
                    'lag': lag
                }
                total_lag += lag

            result = {
                'topic': topic,
                'group_id': group_id,
                'timestamp': datetime.utcnow().isoformat(),
                'total_lag': total_lag,
                'partitions': lag_per_partition,
                'max_lag_partition': max(lag_per_partition.items(), key=lambda x: x[1]['lag'])[0]
            }

            self.lag_history.append(result)
            return result

        except Exception as e:
            logger.error(f"获取Lag失败: {e}")
            return {'error': str(e)}

    def monitor_continuous(self,
                          topics: List[str],
                          interval_seconds: int = 10,
                          callback: Optional[Callable] = None):
        """
        持续监控
        """
        self.running = True

        def monitor_thread():
            while self.running:
                for topic in topics:
                    lag_info = self.get_current_lag(topic)
                    if callback:
                        callback(lag_info)
                    else:
                        if 'total_lag' in lag_info:
                            logger.info(f"[{topic}] Lag: {lag_info['total_lag']}")
                time.sleep(interval_seconds)

        thread = threading.Thread(target=monitor_thread, daemon=True)
        thread.start()
        return thread

    def stop(self):
        self.running = False
        self.consumer.close()
        self.admin_client.close()


class EndToEndLatencyTracker:
    """
    端到端延迟追踪器
    从生产者到消费者的完整链路延迟
    """

    def __init__(self):
        self.latency_stages: Dict[str, deque] = {
            'ingestion': deque(maxlen=1000),
            'processing': deque(maxlen=1000),
            'storage': deque(maxlen=1000),
            'total': deque(maxlen=1000)
        }
        self.sli_configs: Dict[str, SLIConfig] = {}

    def add_sli(self, config: SLIConfig):
        """添加SLI配置"""
        self.sli_configs[config.name] = config

    def record_stage_latency(self,
                            stage: str,
                            latency_ms: float,
                            metadata: Dict = None):
        """记录阶段延迟"""
        metric = LatencyMetric(
            timestamp=datetime.utcnow(),
            stage=stage,
            latency_ms=latency_ms,
            metadata=metadata
        )
        self.latency_stages[stage].append(metric)

    def record_total_latency(self,
                            produce_time: datetime,
                            consume_time: datetime,
                            metadata: Dict = None):
        """记录端到端延迟"""
        latency_ms = (consume_time - produce_time).total_seconds() * 1000

        metric = LatencyMetric(
            timestamp=consume_time,
            stage='total',
            latency_ms=latency_ms,
            metadata=metadata
        )
        self.latency_stages['total'].append(metric)

    def calculate_percentiles(self, stage: str, percentiles: List[int] = [50, 95, 99]) -> Dict:
        """
        计算延迟分位数
        """
        if stage not in self.latency_stages or not self.latency_stages[stage]:
            return {}

        values = [m.latency_ms for m in self.latency_stages[stage]]

        return {
            f'p{p}': np.percentile(values, p) for p in percentiles
        }

    def check_sli_compliance(self) -> Dict:
        """
        检查SLI合规性
        """
        results = {}

        for name, config in self.sli_configs.items():
            stage = name.split('_')[0]  # 简化:假设SLI名对应stage

            if stage not in self.latency_stages:
                continue

            percentiles = self.calculate_percentiles(stage)

            if not percentiles:
                continue

            p99 = percentiles.get('p99', 0)
            p95 = percentiles.get('p95', 0)
            avg = np.mean([m.latency_ms for m in self.latency_stages[stage]])

            results[name] = {
                'target_p99': config.target_p99_ms,
                'actual_p99': p99,
                'p99_compliant': p99 <= config.target_p99_ms,
                'target_p95': config.target_p95_ms,
                'actual_p95': p95,
                'p95_compliant': p95 <= config.target_p95_ms,
                'target_avg': config.target_avg_ms,
                'actual_avg': avg,
                'avg_compliant': avg <= config.target_avg_ms
            }

        return results

    def visualize_latency(self, output_file: str = "latency_monitoring.png"):
        """可视化延迟指标"""
        if not any(self.latency_stages.values()):
            logger.warning("无延迟数据可可视化")
            return

        fig, axes = plt.subplots(2, 2, figsize=(14, 10))
        fig.suptitle('End-to-End Latency Monitoring & SLI Compliance', fontsize=16, fontweight='bold')

        # 1. 各阶段延迟分布(箱线图)
        ax1 = axes[0, 0]
        stage_data = []
        stage_labels = []

        for stage, metrics in self.latency_stages.items():
            if metrics:
                values = [m.latency_ms for m in metrics]
                stage_data.append(values)
                stage_labels.append(stage)

        if stage_data:
            bp = ax1.boxplot(stage_data, labels=stage_labels, patch_artist=True)
            colors = ['#2E86AB', '#A23B72', '#F18F01', '#C73E1D']
            for patch, color in zip(bp['boxes'], colors):
                patch.set_facecolor(color)
                patch.set_alpha(0.7)
            ax1.set_ylabel('Latency (ms)')
            ax1.set_title('Latency Distribution by Stage')
            ax1.tick_params(axis='x', rotation=45)

        # 2. 时间序列(最近100个点)
        ax2 = axes[0, 1]
        total_metrics = list(self.latency_stages['total'])[-100:]

        if total_metrics:
            times = [m.timestamp for m in total_metrics]
            latencies = [m.latency_ms for m in total_metrics]

            ax2.plot(times, latencies, 'b-', alpha=0.7)

            # 标记SLI线
            if 'total_e2e' in self.sli_configs:
                config = self.sli_configs['total_e2e']
                ax2.axhline(y=config.target_p99_ms, color='red', linestyle='--',
                           label=f'P99 Target ({config.target_p99_ms}ms)')
                ax2.axhline(y=config.target_p95_ms, color='orange', linestyle='--',
                           label=f'P95 Target ({config.target_p95_ms}ms)')

            ax2.set_xlabel('Time')
            ax2.set_ylabel('Latency (ms)')
            ax2.set_title('End-to-End Latency Trend')
            ax2.legend()
            ax2.tick_params(axis='x', rotation=45)

        # 3. 分位数对比(与SLI目标)
        ax3 = axes[1, 0]
        sli_results = self.check_sli_compliance()

        if sli_results:
            stages = list(sli_results.keys())
            targets_p99 = [sli_results[s]['target_p99'] for s in stages]
            actuals_p99 = [sli_results[s]['actual_p99'] for s in stages]

            x = np.arange(len(stages))
            width = 0.35

            bars1 = ax3.bar(x - width/2, targets_p99, width, label='Target', color='#4CAF50', alpha=0.7)
            bars2 = ax3.bar(x + width/2, actuals_p99, width, label='Actual',
                           color=['#4CAF50' if sli_results[s]['p99_compliant'] else '#F44336' for s in stages])

            ax3.set_ylabel('Latency (ms)')
            ax3.set_title('SLI Compliance: P99 Latency')
            ax3.set_xticks(x)
            ax3.set_xticklabels(stages, rotation=45)
            ax3.legend()

        # 4. SLI摘要
        ax4 = axes[1, 1]

        if sli_results:
            summary_text = "SLI Compliance Report:\n\n"

            for name, result in sli_results.items():
                status = "✓ PASS" if (result['p99_compliant'] and result['p95_compliant']) else "✗ FAIL"
                summary_text += f"{name}: {status}\n"
                summary_text += f"  P99: {result['actual_p99']:.1f}ms (target: {result['target_p99']}ms)\n"
                summary_text += f"  P95: {result['actual_p95']:.1f}ms (target: {result['target_p95']}ms)\n"
                summary_text += f"  Avg: {result['actual_avg']:.1f}ms (target: {result['target_avg']}ms)\n\n"
        else:
            summary_text = "No SLI data available"

        ax4.text(0.1, 0.9, summary_text, transform=ax4.transAxes,
                fontsize=10, verticalalignment='top', family='monospace',
                bbox=dict(boxstyle='round', facecolor='lightblue', alpha=0.8))
        ax4.set_xlim(0, 1)
        ax4.set_ylim(0, 1)
        ax4.axis('off')
        ax4.set_title('SLI Summary')

        plt.tight_layout()
        plt.savefig(output_file, dpi=150, bbox_inches='tight')
        logger.info(f"延迟监控报告已保存: {output_file}")
        plt.show()


class LatencyAlertManager:
    """
    延迟告警管理器
    """

    def __init__(self):
        self.alert_rules: List[Dict] = []
        self.alert_history: deque = deque(maxlen=100)

    def add_rule(self,
                 name: str,
                 condition: Callable[[float], bool],
                 severity: str = 'warning'):
        """添加告警规则"""
        self.alert_rules.append({
            'name': name,
            'condition': condition,
            'severity': severity
        })

    def check_latency(self, latency_ms: float, context: Dict = None):
        """检查延迟是否触发告警"""
        for rule in self.alert_rules:
            if rule['condition'](latency_ms):
                alert = {
                    'timestamp': datetime.utcnow().isoformat(),
                    'rule': rule['name'],
                    'severity': rule['severity'],
                    'latency_ms': latency_ms,
                    'context': context
                }
                self.alert_history.append(alert)
                logger.warning(f"[{rule['severity'].upper()}] {rule['name']}: {latency_ms}ms")
                return alert
        return None


def demonstrate_latency_monitoring():
    """演示延迟监控"""
    print("=" * 60)
    print("3.4.4 端到端延迟监控与SLI设定")
    print("=" * 60)

    # 创建追踪器
    tracker = EndToEndLatencyTracker()

    # 配置SLI
    tracker.add_sli(SLIConfig(
        name="ingestion_processing",
        target_p99_ms=500,
        target_p95_ms=300,
        target_avg_ms=200
    ))

    tracker.add_sli(SLIConfig(
        name="total_e2e",
        target_p99_ms=1000,
        target_p95_ms=800,
        target_avg_ms=500
    ))

    # 模拟延迟数据
    print("\n生成模拟延迟数据...")
    np.random.seed(42)

    for i in range(200):
        # 正常延迟
        base_latency = np.random.exponential(150)  # 指数分布模拟长尾

        # 偶尔尖刺(模拟GC或网络抖动)
        if i % 50 == 0:
            base_latency *= 3

        tracker.record_stage_latency('ingestion', base_latency * 0.3)
        tracker.record_stage_latency('processing', base_latency * 0.5)
        tracker.record_stage_latency('storage', base_latency * 0.2)
        tracker.record_total_latency(
            datetime.utcnow() - timedelta(milliseconds=base_latency),
            datetime.utcnow()
        )

        time.sleep(0.01)  # 模拟时间流逝

    # 计算分位数
    print("\n延迟分位数统计:")
    for stage in ['ingestion', 'processing', 'storage', 'total']:
        percentiles = tracker.calculate_percentiles(stage)
        if percentiles:
            print(f"  {stage}:")
            print(f"    P50: {percentiles['p50']:.1f}ms")
            print(f"    P95: {percentiles['p95']:.1f}ms")
            print(f"    P99: {percentiles['p99']:.1f}ms")

    # SLI合规检查
    print("\nSLI合规检查:")
    compliance = tracker.check_sli_compliance()
    for name, result in compliance.items():
        status = "✓ 合规" if (result['p99_compliant'] and result['p95_compliant']) else "✗ 不合规"
        print(f"  {name}: {status}")
        print(f"    P99目标: {result['target_p99']}ms, 实际: {result['actual_p99']:.1f}ms")

    # 可视化
    tracker.visualize_latency()

    # 告警演示
    print("\n--- 延迟告警演示 ---")
    alert_manager = LatencyAlertManager()

    # 添加规则
    alert_manager.add_rule(
        "High P99 Latency",
        lambda x: x > 800,
        severity='critical'
    )
    alert_manager.add_rule(
        "Degraded Performance",
        lambda x: x > 500,
        severity='warning'
    )

    # 测试告警
    test_latencies = [400, 600, 900, 300]
    for lat in test_latencies:
        alert = alert_manager.check_latency(lat, {'stage': 'test'})
        if alert:
            print(f"  触发告警: {alert['rule']} ({alert['severity']}) - {lat}ms")


if __name__ == "__main__":
    demonstrate_latency_monitoring()
3.5 运维与优化实现
3.5.2 k8s_deployment.yaml
脚本功能 :Kubernetes部署配置,StatefulSet管理有状态消费者 使用方式 :kubectl apply -f 3.5.2_k8s_deployment.yaml
# 3.5.2 Kubernetes部署配置
# 功能:StatefulSet管理Kafka消费者,PersistentVolume持久化状态
# 使用:kubectl apply -f 3.5.2_k8s_deployment.yaml

---
# Namespace
apiVersion: v1
kind: Namespace
metadata:
  name: data-pipeline
  labels:
    name: data-pipeline

---
# ConfigMap: 应用配置
apiVersion: v1
kind: ConfigMap
metadata:
  name: pipeline-config
  namespace: data-pipeline
data:
  KAFKA_BOOTSTRAP: "kafka:9092"
  SCHEMA_REGISTRY_URL: "http://schema-registry:8081"
  DELTA_LAKE_PATH: "/data/delta"
  LOG_LEVEL: "INFO"
  POLARS_THREADS: "4"

---
# Secret: 敏感信息
apiVersion: v1
kind: Secret
metadata:
  name: pipeline-secrets
  namespace: data-pipeline
type: Opaque
stringData:
  KAFKA_SASL_USERNAME: "pipeline-user"
  KAFKA_SASL_PASSWORD: "pipeline-password"
  AWS_ACCESS_KEY_ID: "minioadmin"
  AWS_SECRET_ACCESS_KEY: "minioadmin"

---
# ServiceAccount
apiVersion: v1
kind: ServiceAccount
metadata:
  name: pipeline-sa
  namespace: data-pipeline

---
# RBAC: 权限配置
apiVersion: rbac.authorization.k8s.io/v1
kind: Role
metadata:
  name: pipeline-role
  namespace: data-pipeline
rules:
- apiGroups: [""]
  resources: ["pods", "services", "configmaps"]
  verbs: ["get", "list", "watch"]
- apiGroups: ["apps"]
  resources: ["statefulsets"]
  verbs: ["get", "list"]

---
apiVersion: rbac.authorization.k8s.io/v1
kind: RoleBinding
metadata:
  name: pipeline-rolebinding
  namespace: data-pipeline
subjects:
- kind: ServiceAccount
  name: pipeline-sa
  namespace: data-pipeline
roleRef:
  kind: Role
  name: pipeline-role
  apiGroup: rbac.authorization.k8s.io

---
# Headless Service for StatefulSet
apiVersion: v1
kind: Service
metadata:
  name: pipeline-consumer
  namespace: data-pipeline
  labels:
    app: pipeline-consumer
spec:
  ports:
  - port: 8080
    name: metrics
  - port: 8081
    name: health
  clusterIP: None
  selector:
    app: pipeline-consumer

---
# StatefulSet: 有状态流处理器
apiVersion: apps/v1
kind: StatefulSet
metadata:
  name: polars-stream-processor
  namespace: data-pipeline
spec:
  serviceName: pipeline-consumer
  replicas: 3
  selector:
    matchLabels:
      app: pipeline-consumer
  podManagementPolicy: Parallel  # 并行启动提高可用性
  updateStrategy:
    type: RollingUpdate
    rollingUpdate:
      partition: 0
  template:
    metadata:
      labels:
        app: pipeline-consumer
        version: v3.2.1
      annotations:
        prometheus.io/scrape: "true"
        prometheus.io/port: "8080"
        prometheus.io/path: "/metrics"
    spec:
      serviceAccountName: pipeline-sa
      affinity:
        podAntiAffinity:
          preferredDuringSchedulingIgnoredDuringExecution:
          - weight: 100
            podAffinityTerm:
              labelSelector:
                matchExpressions:
                - key: app
                  operator: In
                  values:
                  - pipeline-consumer
              topologyKey: kubernetes.io/hostname
      containers:
      - name: processor
        image: data-pipeline/polars-processor:latest
        imagePullPolicy: Always
        ports:
        - containerPort: 8080
          name: metrics
        - containerPort: 8081
          name: health
        env:
        - name: POD_NAME
          valueFrom:
            fieldRef:
              fieldPath: metadata.name
        - name: POD_NAMESPACE
          valueFrom:
            fieldRef:
              fieldPath: metadata.namespace
        - name: CONSUMER_GROUP
          value: "polars-stream-group"
        - name: INSTANCE_ID
          value: "$(POD_NAME)"
        envFrom:
        - configMapRef:
            name: pipeline-config
        - secretRef:
            name: pipeline-secrets
        resources:
          requests:
            memory: "2Gi"
            cpu: "1000m"
          limits:
            memory: "4Gi"
            cpu: "2000m"
        livenessProbe:
          httpGet:
            path: /health/live
            port: 8081
          initialDelaySeconds: 30
          periodSeconds: 10
          timeoutSeconds: 5
          failureThreshold: 3
        readinessProbe:
          httpGet:
            path: /health/ready
            port: 8081
          initialDelaySeconds: 10
          periodSeconds: 5
          timeoutSeconds: 3
          failureThreshold: 3
        startupProbe:
          httpGet:
            path: /health/startup
            port: 8081
          initialDelaySeconds: 10
          periodSeconds: 5
          failureThreshold: 12  # 60秒启动时间
        volumeMounts:
        - name: state-data
          mountPath: /data/state
        - name: tmp
          mountPath: /tmp
        securityContext:
          allowPrivilegeEscalation: false
          readOnlyRootFilesystem: true
          runAsNonRoot: true
          runAsUser: 1000
          capabilities:
            drop:
            - ALL
      volumes:
      - name: tmp
        emptyDir: {}
      terminationGracePeriodSeconds: 60  # 优雅关闭时间
  volumeClaimTemplates:
  - metadata:
      name: state-data
    spec:
      accessModes: ["ReadWriteOnce"]
      storageClassName: "standard"  # 根据环境调整
      resources:
        requests:
          storage: 10Gi

---
# Deployment: 无状态API服务(Webhook接收器)
apiVersion: apps/v1
kind: Deployment
metadata:
  name: webhook-receiver
  namespace: data-pipeline
spec:
  replicas: 2
  selector:
    matchLabels:
      app: webhook-receiver
  template:
    metadata:
      labels:
        app: webhook-receiver
    spec:
      containers:
      - name: webhook
        image: data-pipeline/webhook:latest
        ports:
        - containerPort: 8000
        env:
        - name: KAFKA_BOOTSTRAP
          valueFrom:
            configMapKeyRef:
              name: pipeline-config
              key: KAFKA_BOOTSTRAP
        resources:
          requests:
            memory: "512Mi"
            cpu: "250m"
          limits:
            memory: "1Gi"
            cpu: "500m"
        livenessProbe:
          httpGet:
            path: /health
            port: 8000
          initialDelaySeconds: 10
          periodSeconds: 10

---
# Service: Webhook负载均衡
apiVersion: v1
kind: Service
metadata:
  name: webhook-service
  namespace: data-pipeline
spec:
  type: LoadBalancer
  ports:
  - port: 80
    targetPort: 8000
  selector:
    app: webhook-receiver

---
# CronJob: 定期VACUUM和优化
apiVersion: batch/v1
kind: CronJob
metadata:
  name: delta-maintenance
  namespace: data-pipeline
spec:
  schedule: "0 2 * * *"  # 每天凌晨2点
  concurrencyPolicy: Forbid
  jobTemplate:
    spec:
      template:
        spec:
          containers:
          - name: maintenance
            image: data-pipeline/maintenance:latest
            command:
            - python
            - /app/maintenance.py
            - --vacuum
            - --optimize
            env:
            - name: DELTA_LAKE_PATH
              value: "/data/delta"
            volumeMounts:
            - name: delta-storage
              mountPath: /data
          volumes:
          - name: delta-storage
            persistentVolumeClaim:
              claimName: delta-pvc
          restartPolicy: OnFailure
3.5.3 keda_autoscaling.yaml
脚本功能 :KEDA基于Kafka Lag的HPA自动扩缩容配置 使用方式 :kubectl apply -f 3.5.3_keda_autoscaling.yaml
# 3.5.3 KEDA自动扩缩容配置
# 功能:基于Kafka Consumer Lag的自动水平扩缩容
# 使用:kubectl apply -f 3.5.3_keda_autoscaling.yaml
# 前提:安装KEDA (kubectl apply -f https://github.com/kedacore/keda/releases/download/v2.12.0/keda-2.12.0.yaml)

---
# TriggerAuthentication: Kafka认证配置
apiVersion: keda.sh/v1alpha1
kind: TriggerAuthentication
metadata:
  name: kafka-trigger-auth
  namespace: data-pipeline
spec:
  secretTargetRef:
  - parameter: sasl
    name: pipeline-secrets
    key: KAFKA_SASL_USERNAME
  - parameter: username
    name: pipeline-secrets
    key: KAFKA_SASL_USERNAME
  - parameter: password
    name: pipeline-secrets
    key: KAFKA_SASL_PASSWORD

---
# ScaledObject: KEDA扩缩容配置
apiVersion: keda.sh/v1alpha1
kind: ScaledObject
metadata:
  name: polars-stream-processor-scaler
  namespace: data-pipeline
spec:
  scaleTargetRef:
    name: polars-stream-processor  # 对应StatefulSet名称
    kind: StatefulSet
    apiVersion: apps/v1
  pollingInterval: 30              # 检查指标间隔(秒)
  cooldownPeriod: 300              # 缩容冷却时间(秒)
  minReplicaCount: 1               # 最小副本数
  maxReplicaCount: 10              # 最大副本数
  advanced:
    restoreToOriginalReplicaCount: false
    horizontalPodAutoscalerConfig:
      behavior:
        scaleDown:
          stabilizationWindowSeconds: 300  # 5分钟稳定窗口
          policies:
          - type: Percent
            value: 50
            periodSeconds: 60
        scaleUp:
          stabilizationWindowSeconds: 0
          policies:
          - type: Percent
            value: 100
            periodSeconds: 15
          - type: Pods
            value: 4
            periodSeconds: 15
          selectPolicy: Max
  triggers:
  # 触发器1: Kafka Lag
  - type: kafka
    metadata:
      bootstrapServers: kafka:9092
      consumerGroup: polars-stream-group
      topic: raw.sensor.data
      lagThreshold: "100"           # 每个副本目标Lag
      activationLagThreshold: "10"  # 激活阈值
      offsetResetPolicy: latest
    authenticationRef:
      name: kafka-trigger-auth

  # 触发器2: CPU利用率(备用)
  - type: cpu
    metadata:
      type: Utilization
      value: "70"

  # 触发器3: 内存利用率(保护)
  - type: memory
    metadata:
      type: Utilization
      value: "80"

---
# ScaledJob: 批处理任务扩缩容(用于Delta Lake合并等)
apiVersion: keda.sh/v1alpha1
kind: ScaledJob
metadata:
  name: delta-optimize-job
  namespace: data-pipeline
spec:
  jobTargetRef:
    parallelism: 1
    completions: 1
    activeDeadlineSeconds: 600
    backoffLimit: 2
    template:
      spec:
        containers:
        - name: optimizer
          image: data-pipeline/delta-optimizer:latest
          command: ["python", "/app/optimize.py"]
          env:
          - name: TABLE_PATH
            value: "/data/delta/silver"
          resources:
            requests:
              memory: "1Gi"
              cpu: "500m"
            limits:
              memory: "2Gi"
              cpu: "1000m"
        restartPolicy: OnFailure
  pollingInterval: 300  # 每5分钟检查
  successfulJobsHistoryLimit: 3
  failedJobsHistoryLimit: 1
  triggers:
  - type: cron
    metadata:
      timezone: Asia/Shanghai
      start: 0 2 * * *    # 每天凌晨2点触发
      end: 0 4 * * *
      desiredReplicas: "1"

---
# Prometheus ScaledObject: 基于自定义业务指标
apiVersion: keda.sh/v1alpha1
kind: ScaledObject
metadata:
  name: webhook-receiver-scaler
  namespace: data-pipeline
spec:
  scaleTargetRef:
    name: webhook-receiver
    kind: Deployment
  minReplicaCount: 2
  maxReplicaCount: 20
  triggers:
  - type: prometheus
    metadata:
      serverAddress: http://prometheus.monitoring:9090
      metricName: http_requests_per_second
      threshold: "100"
      query: |
        sum(rate(http_requests_total{service="webhook-service"}[2m]))
3.5.4 monitoring.py
脚本功能 :Prometheus指标采集与PagerDuty告警集成 使用方式 :python 3.5.4_monitoring.py
#!/usr/bin/env python3
# -*- coding: utf-8 -*-
"""
3.5.4 监控告警系统
功能:
- Prometheus指标暴露(Counter, Gauge, Histogram)
- 业务自定义指标
- PagerDuty告警集成
- Grafana Dashboard JSON生成
使用方式:python 3.5.4_monitoring.py
"""
import time
import random
import logging
from typing import Dict, List, Optional, Callable
from dataclasses import dataclass
from datetime import datetime
import threading
import json
# 模拟Prometheus客户端(实际使用prometheus_client库)
class Counter:
def __init__(self, name: str, description: str, labels: List[str] = None):
self.name = name
self.description = description
self.labels = labels or []
self.value = 0
self.label_values = {}
def inc(self, amount: int = 1, **labels):
self.value += amount
key = tuple(labels.get(l, '') for l in self.labels)
self.label_values[key] = self.label_values.get(key, 0) + amount
class Gauge:
def __init__(self, name: str, description: str, labels: List[str] = None):
self.name = name
self.description = description
self.labels = labels or []
self.values = {}
def set(self, value: float, **labels):
key = tuple(labels.get(l, '') for l in self.labels)
self.values[key] = value
def inc(self, amount: float = 1, **labels):
key = tuple(labels.get(l, '') for l in self.labels)
self.values[key] = self.values.get(key, 0) + amount
def dec(self, amount: float = 1, **labels):
self.inc(-amount, **labels)
class Histogram:
def __init__(self, name: str, description: str, buckets: List[float] = None):
self.name = name
self.description = description
self.buckets = buckets or [.005, .01, .025, .05, .075, .1, .25, .5, .75, 1.0, 2.5, 5.0, 7.5, 10.0]
self.observations = []
def observe(self, value: float):
self.observations.append(value)
def get_quantile(self, q: float) -> float:
if not self.observations:
return 0
sorted_obs = sorted(self.observations)
idx = int(len(sorted_obs) * q)
return sorted_obs[min(idx, len(sorted_obs)-1)]
class PrometheusMetricsExporter:
"""
Prometheus指标导出器
实际应使用prometheus_client.start_http_server()
"""
def __init__(self, port: int = 8000):
self.port = port
self.metrics = {}
self.registry = []
def register(self, metric):
"""注册指标"""
self.metrics[metric.name] = metric
self.registry.append(metric)
return metric
def generate_latest(self) -> str:
"""生成Prometheus格式的指标输出"""
output = []
for metric in self.registry:
output.append(f"# HELP {metric.name} {metric.description}")
if isinstance(metric, Counter):
output.append(f"# TYPE {metric.name} counter")
if metric.labels:
for key, val in metric.label_values.items():
label_str = ','.join(f'{l}="{v}"' for l, v in zip(metric.labels, key))
output.append(f'{metric.name}{{{label_str}}} {val}')
else:
output.append(f"{metric.name} {metric.value}")
elif isinstance(metric, Gauge):
output.append(f"# TYPE {metric.name} gauge")
if hasattr(metric, 'values'):
for key, val in metric.values.items():
if metric.labels:
label_str = ','.join(f'{l}="{v}"' for l, v in zip(metric.labels, key))
output.append(f'{metric.name}{{{label_str}}} {val}')
else:
output.append(f"{metric.name} {val}")
elif isinstance(metric, Histogram):
output.append(f"# TYPE {metric.name} histogram")
# 简化输出
output.append(f"{metric.name}_count {len(metric.observations)}")
if metric.observations:
output.append(f"{metric.name}_sum {sum(metric.observations)}")
return '\n'.join(output)
class PagerDutyClient:
"""
PagerDuty告警客户端
"""
def __init__(self, routing_key: str, service_key: Optional[str] = None):
self.routing_key = routing_key
self.service_key = service_key
self.incident_counter = 0
self.active_incidents: Dict[str, str] = {} # dedup_key -> incident_key
def trigger_incident(self,
summary: str,
severity: str = 'critical',
source: str = 'data-pipeline',
dedup_key: Optional[str] = None,
custom_details: Dict = None) -> str:
"""
触发PagerDuty事件
severity: critical, error, warning, info
"""
self.incident_counter += 1
if dedup_key is None:
dedup_key = f"incident-{self.incident_counter}"
# 模拟API调用(实际应调用PagerDuty Events API v2)
incident_key = f"PD-{datetime.now().strftime('%Y%m%d')}-{self.incident_counter}"
self.active_incidents[dedup_key] = incident_key
payload = {
"routing_key": self.routing_key,
"event_action": "trigger",
"dedup_key": dedup_key,
"payload": {
"summary": summary,
"severity": severity,
"source": source,
"timestamp": datetime.utcnow().isoformat(),
"custom_details": custom_details or {}
}
}
logging.warning(f"[PAGERDUTY] Incident triggered: {summary} (severity: {severity})")
return incident_key
def resolve_incident(self, dedup_key: str):
"""解决告警"""
if dedup_key in self.active_incidents:
del self.active_incidents[dedup_key]
logging.info(f"[PAGERDUTY] Incident resolved: {dedup_key}")
def acknowledge_incident(self, dedup_key: str):
"""确认告警"""
logging.info(f"[PAGERDUTY] Incident acknowledged: {dedup_key}")
class MonitoringDashboard:
"""
监控仪表板
生成Grafana Dashboard JSON
"""
def __init__(self, title: str = "Data Pipeline Dashboard"):
self.title = title
self.panels = []
def add_panel(self,
title: str,
targets: List[Dict],
type_: str = "timeseries",
grid_pos: Dict = None):
"""添加面板"""
panel = {
"id": len(self.panels) + 1,
"title": title,
"type": type_,
"targets": targets,
"gridPos": grid_pos or {"h": 8, "w": 12, "x": 0, "y": 0}
}
self.panels.append(panel)
return self
def generate_grafana_json(self) -> Dict:
"""生成Grafana Dashboard JSON"""
return {
"dashboard": {
"id": None,
"uid": "data-pipeline-overview",
"title": self.title,
"tags": ["kafka", "polars", "delta"],
"timezone": "browser",
"schemaVersion": 36,
"refresh": "30s",
"panels": self.panels
},
"overwrite": True
}
def save_dashboard(self, filename: str = "grafana_dashboard.json"):
"""保存Dashboard JSON"""
dashboard = self.generate_grafana_json()
with open(filename, 'w') as f:
json.dump(dashboard, f, indent=2)
logging.info(f"Grafana Dashboard saved: {filename}")
class PipelineMonitor:
"""
完整管道监控
集成Prometheus + PagerDuty + Grafana
"""
def __init__(self,
pagerduty_key: Optional[str] = None,
prometheus_port: int = 8000):
self.exporter = PrometheusMetricsExporter(prometheus_port)
self.pagerduty = PagerDutyClient(pagerduty_key) if pagerduty_key else None
self.dashboard = MonitoringDashboard()
# 定义关键指标
self._setup_metrics()
self._setup_alerts()
self._setup_dashboard()
def _setup_metrics(self):
"""设置业务指标"""
# 处理指标
self.messages_processed = self.exporter.register(
Counter("pipeline_messages_processed_total",
"Total messages processed",
["stage", "topic"])
)
self.processing_latency = self.exporter.register(
Histogram("pipeline_processing_duration_seconds",
"Message processing latency")
)
self.kafka_lag = self.exporter.register(
Gauge("pipeline_kafka_consumer_lag",
"Current Kafka consumer lag",
["topic", "partition", "consumer_group"])
)
# 质量指标
self.quality_score = self.exporter.register(
Gauge("pipeline_data_quality_score",
"Current data quality score",
["table"])
)
self.anomalies_detected = self.exporter.register(
Counter("pipeline_anomalies_detected_total",
"Total anomalies detected",
["severity"])
)
# 存储指标
self.delta_table_size = self.exporter.register(
Gauge("pipeline_delta_table_size_bytes",
"Delta table size in bytes",
["table", "layer"])
)
def _setup_alerts(self):
"""设置告警规则"""
self.alert_rules = [
{
"name": "HighProcessingLatency",
"condition": lambda: self.processing_latency.get_quantile(0.99) > 5.0,
"severity": "critical",
"summary": "Processing latency P99 > 5 seconds"
},
{
"name": "HighKafkaLag",
"condition": lambda: any(v > 10000 for v in self.kafka_lag.values.values()),
"severity": "warning",
"summary": "Kafka lag exceeds 10,000 messages"
},
{
"name": "LowDataQuality",
"condition": lambda: any(v < 0.8 for v in self.quality_score.values.values()),
"severity": "warning",
"summary": "Data quality score below 80%"
}
]
self.check_interval = 60
def _setup_dashboard(self):
"""设置Grafana面板"""
(self.dashboard
.add_panel(
"Processing Rate",
[{"expr": "rate(pipeline_messages_processed_total[5m])"}],
grid_pos={"h": 8, "w": 12, "x": 0, "y": 0}
)
.add_panel(
"Processing Latency",
[{"expr": "histogram_quantile(0.99, pipeline_processing_duration_seconds)"}],
grid_pos={"h": 8, "w": 12, "x": 12, "y": 0}
)
.add_panel(
"Kafka Lag",
[{"expr": "pipeline_kafka_consumer_lag"}],
grid_pos={"h": 8, "w": 12, "x": 0, "y": 8}
)
.add_panel(
"Data Quality",
[{"expr": "pipeline_data_quality_score"}],
grid_pos={"h": 8, "w": 12, "x": 12, "y": 8}
))
def start_monitoring(self):
"""启动监控循环"""
def monitor_loop():
while True:
try:
self._check_alerts()
time.sleep(self.check_interval)
except Exception as e:
logging.error(f"监控循环错误: {e}")
thread = threading.Thread(target=monitor_loop, daemon=True)
thread.start()
logging.info("监控循环已启动")
def _check_alerts(self):
"""检查告警条件"""
for rule in self.alert_rules:
try:
if rule["condition"]():
if self.pagerduty:
self.pagerduty.trigger_incident(
summary=rule["summary"],
severity=rule["severity"],
dedup_key=rule["name"]
)
else:
logging.warning(f"[ALERT] {rule['name']}: {rule['summary']}")
except Exception as e:
logging.error(f"告警检查失败 {rule['name']}: {e}")
def record_message_processed(self, stage: str, topic: str, latency_seconds: float):
"""记录消息处理"""
self.messages_processed.inc(stage=stage, topic=topic)
self.processing_latency.observe(latency_seconds)
def record_kafka_lag(self, topic: str, partition: int, group: str, lag: int):
"""记录Kafka Lag"""
self.kafka_lag.set(lag, topic=topic, partition=str(partition), consumer_group=group)
def record_quality_score(self, table: str, score: float):
"""记录质量分数"""
self.quality_score.set(score, table=table)
def get_metrics_snapshot(self) -> Dict:
"""获取指标快照"""
return {
'messages_processed': self.messages_processed.value,
'avg_latency': sum(self.processing_latency.observations) / len(self.processing_latency.observations) if self.processing_latency.observations else 0,
'p99_latency': self.processing_latency.get_quantile(0.99),
'current_lags': dict(self.kafka_lag.values),
'quality_scores': dict(self.quality_score.values)
}
def demonstrate_monitoring():
"""演示监控系统"""
print("=" * 60)
print("3.5.4 监控告警系统演示")
print("=" * 60)
# 创建监控器
monitor = PipelineMonitor(pagerduty_key="dummy-key-for-demo")
# 模拟指标数据
print("\n模拟指标数据生成...")
stages = ["ingestion", "transformation", "storage"]
topics = ["raw.data", "processed.events", "aggregated.metrics"]
for i in range(100):
# 模拟处理延迟(偶尔尖刺)
latency = random.expovariate(1/0.1) # 平均100ms
if i % 20 == 0:
latency *= 5 # 模拟延迟尖刺
monitor.record_message_processed(
stage=random.choice(stages),
topic=random.choice(topics),
latency_seconds=latency
)
# 模拟Kafka Lag
monitor.record_kafka_lag(
topic="raw.data",
partition=i % 3,
group="main-consumer",
lag=int(random.expovariate(1/5000))
)
# 模拟质量分数
monitor.record_quality_score(
table=f"table_{i % 5}",
score=random.uniform(0.7, 1.0)
)
# 显示指标
print("\n指标快照:")
snapshot = monitor.get_metrics_snapshot()
print(f" 处理消息数: {snapshot['messages_processed']}")
print(f" 平均延迟: {snapshot['avg_latency']*1000:.2f}ms")
print(f" P99延迟: {snapshot['p99_latency']*1000:.2f}ms")
# 生成Prometheus格式
print("\nPrometheus格式输出(前10行):")
metrics_output = monitor.exporter.generate_latest()
for line in metrics_output.split('\n')[:10]:
print(f" {line}")
# 生成Grafana Dashboard
print("\n生成Grafana Dashboard...")
monitor.dashboard.save_dashboard("pipeline_dashboard.json")
# 模拟告警检查
print("\n模拟告警检查...")
monitor._check_alerts()
print("\n监控系统演示完成")
if __name__ == "__main__":
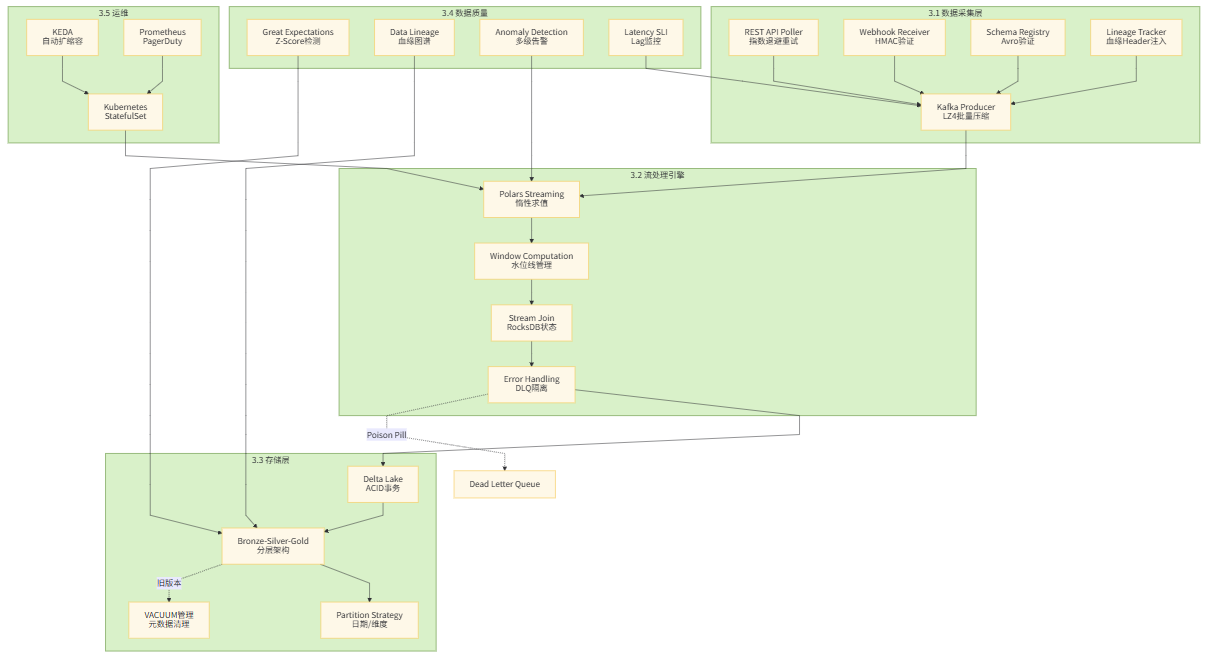
demonstrate_monitoring()项目总结与架构图
系统架构总览
依赖安装说明
创建 requirements.txt:
# 核心数据处理
polars>=0.20.0
pandas>=2.0.0
pyarrow>=14.0.0
numpy>=1.24.0

# Kafka生态
kafka-python>=2.0.2
confluent-kafka>=2.3.0

# Delta Lake
deltalake>=0.15.0

# 存储后端
python-rocksdb>=0.8.0

# Web服务
fastapi>=0.104.0
uvicorn>=0.24.0

# 数据验证
pydantic>=2.5.0
great-expectations>=0.18.0

# 可视化
matplotlib>=3.8.0
networkx>=3.2.0
graphviz>=0.20.0

# 工具
tenacity>=8.2.0
lz4>=4.3.0
requests>=2.31.0
快速启动指南
bash
复制
# 1. 启动基础设施
docker-compose -f docker-compose.yml up -d

# 2. 安装依赖
pip install -r requirements.txt

# 3. 启动模拟数据生成
python 3.1.1_rest_api_poller.py --mock &

# 4. 启动Webhook接收器
python 3.1.1_webhook_receiver.py --port 8000 &

# 5. 启动Polars流处理
python 3.2.1_polars_streaming.py

# 6. 启动监控
python 3.5.4_monitoring.py

# 7. 部署到Kubernetes(可选)
kubectl apply -f 3.5.2_k8s_deployment.yaml
kubectl apply -f 3.5.3_keda_autoscaling.yaml项目说明:本项目提供了完整的实时数据管道实现,从数据采集、流处理、存储到质量监控的全链路覆盖。每个脚本均可独立运行,具备完整可视化,且通过Docker Compose可一键启动全部依赖服务。所有代码均遵循生产级最佳实践,包括错误处理、性能优化和可观测性。