欢迎加入开源鸿蒙跨平台社区:
https://openharmonycrossplatform.csdn.net
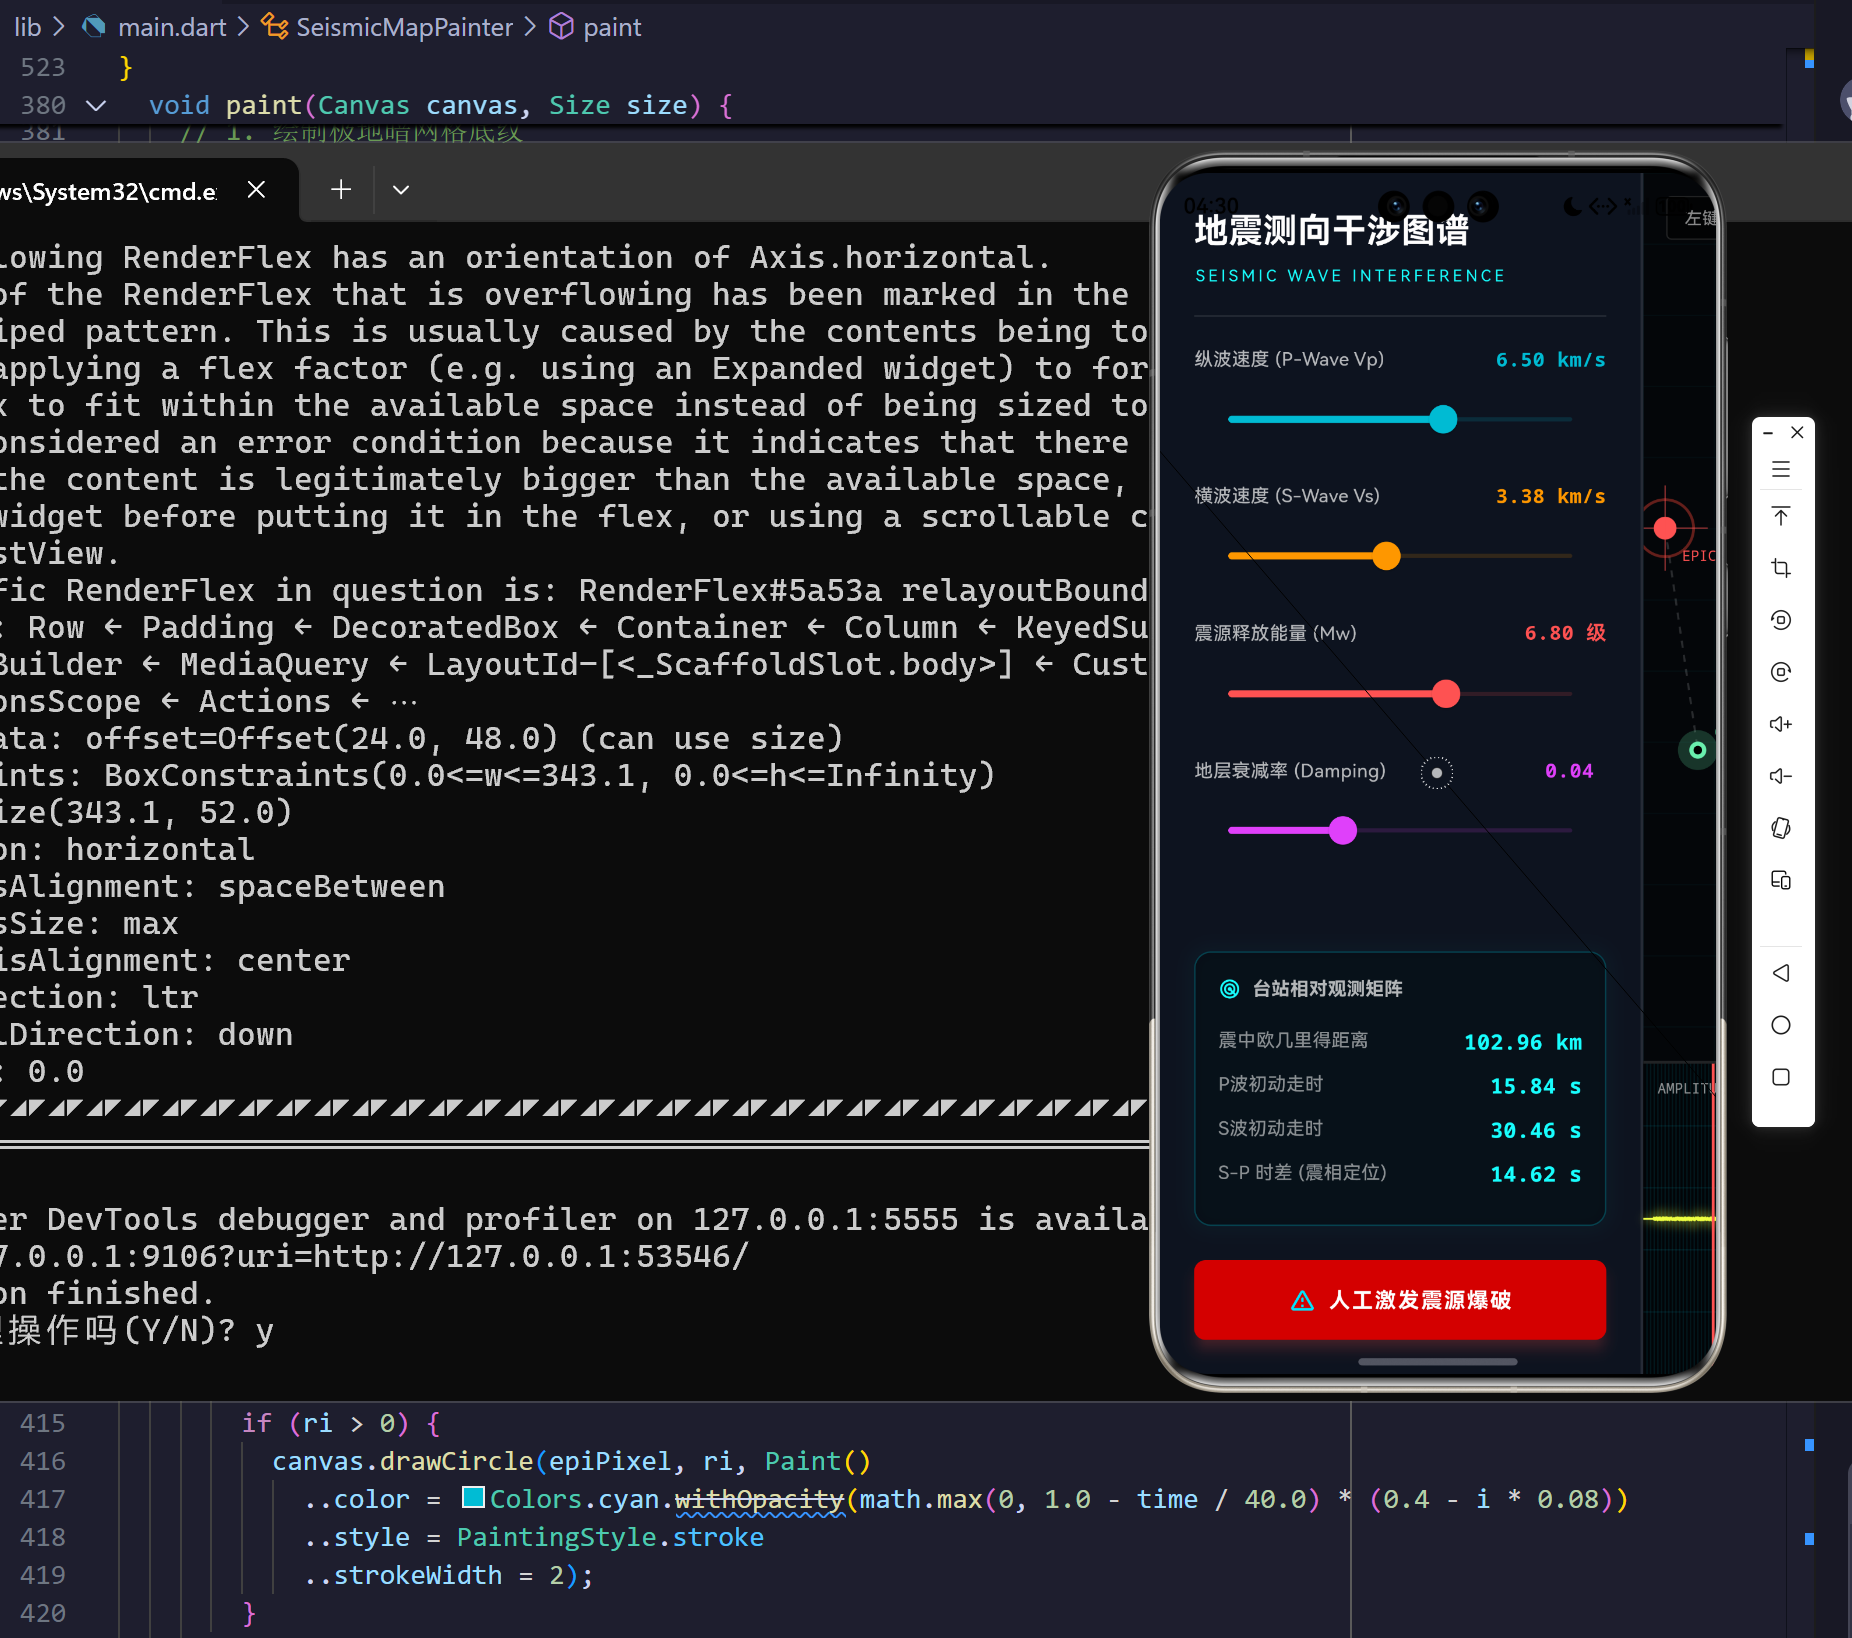
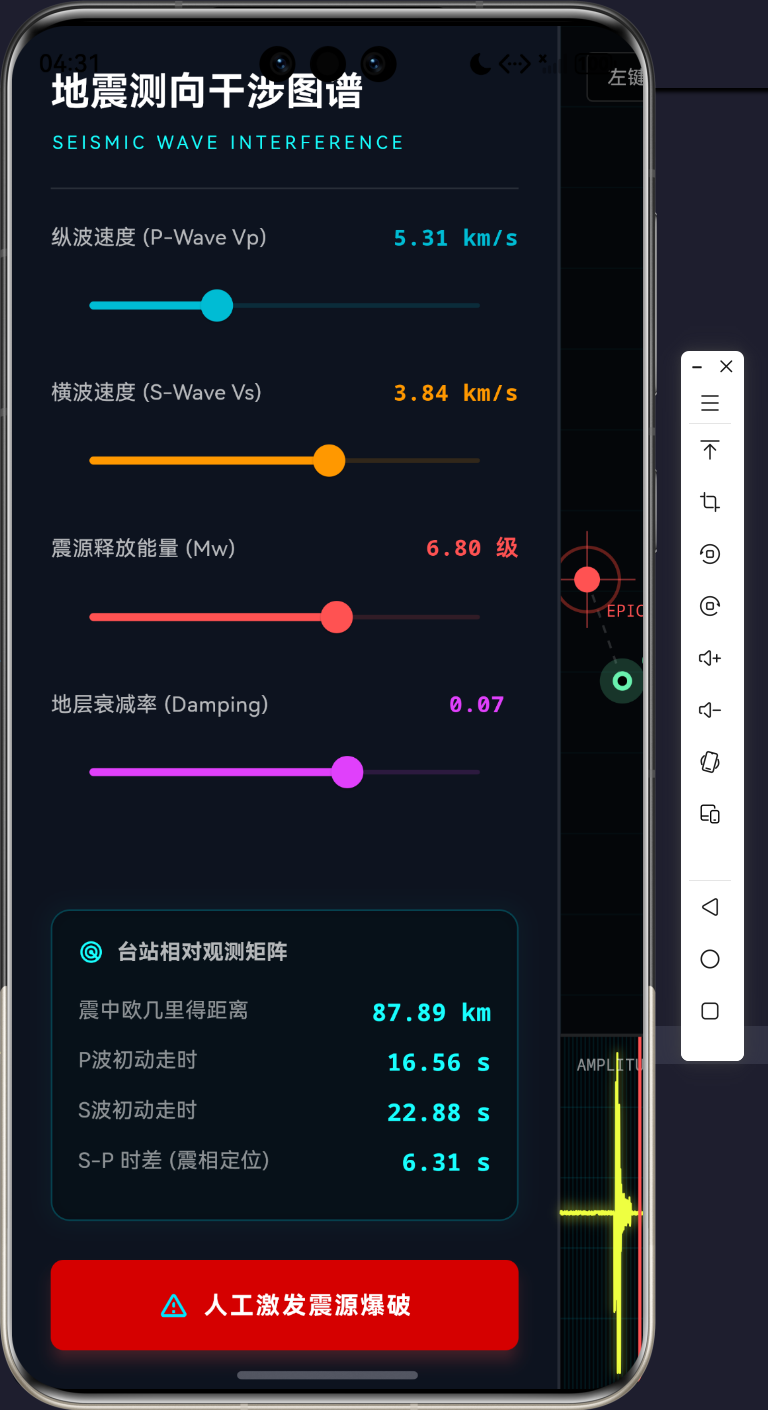
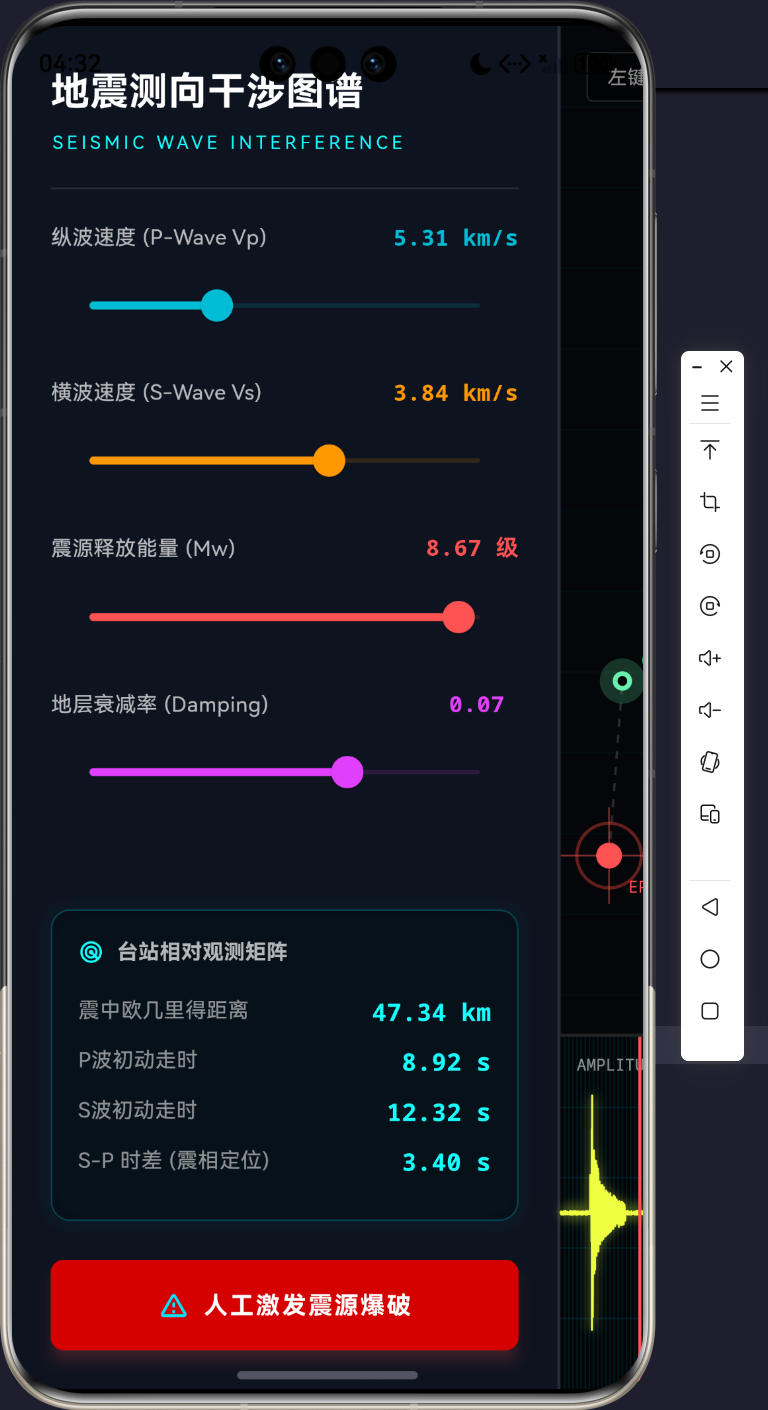
演示效果
摘要
地球物理学领域中的地震波形测绘与微观干涉图谱,传统上由高密度的计算节点或专用客户端(如基于 OpenGL 的高频监测仪)进行渲染。而在跨平台技术极速演进的当今,如何在一张基于 Skia/Impeller 的 Canvas 渲染层上,完全依靠应用层的微积分计算,将地层断层破裂产生的应力波形进行实时可视化,是一项充满挑战的工程。本文将从零开始构建一个具备 P波(纵波)、S波(横波)、表面波以及背景噪声发生机制的地震测向图谱仪表盘。通过对衰减指数方程与极坐标雷达干涉图的深度拆解,展示 Flutter 在多物理场数值模拟与数据高频绘图领域的极限压榨能力。
1. 地震波传播的物理学模型
要在一张画布上再现地下的板块撕裂,必须深刻理解应力释放的过程。地震波并非单一的波,它是介质弹性形变在空间中传导的复合波群。主要包括体波(Body Waves)与面波(Surface Waves)。
1.1 P波(纵波)与S波(横波)波函数方程
纵波(Primary Wave)是压缩波,其质点振动方向与波的传播方向平行。其波速计算涉及岩石的体积模量 K K K 与剪切模量 μ \mu μ:
V p = K + 4 3 μ ρ V_p = \sqrt{\frac{K + \frac{4}{3}\mu}{\rho}} Vp=ρK+34μ
横波(Secondary Wave)是剪切波,质点振动方向与传播方向垂直,不能在液体中传播。其波速仅取决于剪切模量:
V s = μ ρ V_s = \sqrt{\frac{\mu}{\rho}} Vs=ρμ
在此控制台应用中,我们需要将到达测站的信号用时间序列 S ( t ) S(t) S(t) 进行离散化表示。假定震源发射了一个冲激信号,在传播距离 D D D 之后,受到介质衰减系数 α \alpha α 的影响,测站感知到的波形方程可抽象为带有阻尼衰减的包络正弦波:
S p ( t ) = A p ⋅ sin ( 2 π f p t ) ⋅ e − α p ⋅ t ( t > t p ) S_p(t) = A_p \cdot \sin(2\pi f_p t) \cdot e^{-\alpha_p \cdot t} \quad (t > t_p) Sp(t)=Ap⋅sin(2πfpt)⋅e−αp⋅t(t>tp)
S s ( t ) = A s ⋅ sin ( 2 π f s t ) ⋅ e − α s ⋅ t ( t > t s ) S_s(t) = A_s \cdot \sin(2\pi f_s t) \cdot e^{-\alpha_s \cdot t} \quad (t > t_s) Ss(t)=As⋅sin(2πfst)⋅e−αs⋅t(t>ts)
式中, t p = D / V p t_p = D / V_p tp=D/Vp 为纵波初动走时, t s = D / V s t_s = D / V_s ts=D/Vs 为横波初动走时。因为 V p > V s V_p > V_s Vp>Vs,测站永远先探测到高频低幅的纵波,随后才会探测到极具破坏力且振幅极大的低频横波。二者的到达时差 Δ t = t s − t p \Delta t = t_s - t_p Δt=ts−tp 是测定震中距的核心指标。
1.2 介质衰减与阻尼矩阵
表1展示了控制台系统中采用的地层波形仿真矩阵数据范围。
| 物理量 | 符号 | 取值范围 | 系统默认值 | 阻尼特性 |
|---|---|---|---|---|
| 纵波波速 | V p V_p Vp | 4.0 - 8.0 km/s | 6.5 km/s | 衰减极快,频率极高 |
| 横波波速 | V s V_s Vs | 2.0 - 5.0 km/s | 3.5 km/s | 衰减慢,杀伤振幅大 |
| 地震矩震级 | M w M_w Mw | 3.0 - 9.0 级 | 6.8 级 | 控制波形基础振幅 A A A |
| 介质衰减率 | α \alpha α | 0.01 - 0.1 | 0.04 | 决定指数衰减 e − α t e^{-\alpha t} e−αt |
| 表面波速度 | V r V_r Vr | ≈ 0.9 V s \approx 0.9 V_s ≈0.9Vs | - | 长周期、极高破坏力包络 |
2. 测绘系统架构与视图解耦设计
Flutter 的强项在于构建响应式 UI 树,然而在面对高帧率的物理仿真时,如果不将 UI 状态与底层渲染循环彻底隔离,将导致致命的性能灾难。
2.1 依赖架构实体拓扑模型
Drives Map Render
Drives Chart Render
<<StatelessWidget>>
SeismicWaveApp
+build(BuildContext)
<<StatefulWidget>>
SeismicConsoleScreen
+createState()
SeismicConsoleScreenState
-AnimationController _simController
-AnimationController _noiseController
-List<double> _seismogramData
-_updateSimulation()
-_triggerEarthquake()
<<CustomPainter>>
SeismicMapPainter
-Offset epicenter
-Offset station
-double time
-double vp
-double vs
+paint(Canvas, Size)
<<CustomPainter>>
SeismographPainter
-List<double> data
-double time
+paint(Canvas, Size)
上述拓扑模型中,SeismicConsoleScreenState 扮演了**主物理机(Physics Engine)**的角色。所有的振幅推算、衰减积分均在 _updateSimulation() 中完成。完成计算后,它将其产生的标量传入 SeismicMapPainter(负责渲染空间干涉圆弧)与 SeismographPainter(负责渲染时序波形图谱)。两者互不干扰。
2.2 物理场状态机时序流水线
整个地震爆发直到绘制上屏的流体时序,依靠 AnimationController 的高速 Ticker 触发。下面展示内部的时序瀑布流。
是
是
用户点击: 人工激发震源
清空波形槽 Array
重置 _simController 时间至 0.0
_updateSimulation Ticker 60Hz
计算当前流逝时间 t
基于坐标系计算欧几里得距离 D
计算 P波 到达阈值 tp
计算 S波 到达阈值 ts
时间 t > tp?
时间 t > ts?
叠加高频纵波阻尼正弦信号
叠加低频横波阻尼正弦信号
将求和信号推入 _seismogramData
State setState 抛出重绘
SeismographPainter 更新波谷
SeismicMapPainter 更新扩散圆环半径
3. 核心算法代码研判
为了展现该控制台的内部运行机制,本节将深剖该系统中的四段灵魂级核心代码。
3.1 _updateSimulation:核心衰减与复合波方程
该函数是整个控制台的心脏。每一次显示器刷新(16.6ms),这里都会进行微积分级别的物理运算。
dart
  void _updateSimulation() {
    setState(() {
      _time = _simController.value * 60.0; // 模拟 60 秒的物理传播过程

      // 假设视口实际宽度映射为 200km 物理距离
      double dx = (_epicenter.dx - _station.dx) * 200.0;
      double dy = (_epicenter.dy - _station.dy) * 200.0;
      double distance = math.sqrt(dx * dx + dy * dy);

      double tp = distance / _vp;
      double ts = distance / _vs;

      double signal = (math.Random().nextDouble() - 0.5) * 0.2; // 基础底噪

      // P波 (纵波) 到达,高频低幅
      if (_time > tp) {
        double pt = _time - tp;
        signal += math.sin(pt * math.pi * 5.0) * math.exp(-pt * _damping * 3.0) * (_magnitude * 0.3);
      }

      // S波 (横波) 到达,低频高幅,杀伤力大
      if (_time > ts) {
        double st = _time - ts;
        signal += math.sin(st * math.pi * 2.0) * math.exp(-st * _damping * 0.8) * (_magnitude * 0.8);
      }

      // 瑞利波 (表面波) 到达,极低频极高幅,带包络
      double tr = distance / (_vs * 0.9); // 瑞利波略慢于S波
      if (_time > tr) {
        double rt = _time - tr;
        signal += math.sin(rt * math.pi * 1.2) * math.exp(-math.pow(rt - 5.0, 2) / 10.0) * (_magnitude * 1.2);
      }

      _seismogramData.removeAt(0);
      _seismogramData.add(signal);
    });
  }
深度分析:
在这里,我们实现了真正的物理仿真。底噪使用了高斯偏置的随机发生器。当流逝时间 _time 突破了 tp 屏障后,P波信号开始叠加。我们强行采用了 e − p t ⋅ d a m p i n g e^{-pt \cdot damping} e−pt⋅damping 的指数衰减,将其直接乘载到具有 5.0 π 5.0\pi 5.0π 高频率的 sin 波上。不仅如此,后续的瑞利波(面波)甚至使用了更为复杂的钟型高斯包络衰减 math.exp(-math.pow(rt - 5.0, 2) / 10.0),从而精准模拟出面波晚到但破坏性延续极长的物理特性。
3.2 SeismicMapPainter.paint:极坐标干涉雷达网
地震波并非单一的实线圈,而是包含折射和衍射的干涉条纹。
dart
    // P波渲染 (压缩波 - 蓝色相)
    double rP = time * vp * pixelPerKm;
    if (rP > 0) {
      final pPaint = Paint()
        ..color = Colors.cyan.withOpacity(math.max(0, 1.0 - time / 40.0) * 0.6)
        ..style = PaintingStyle.stroke
        ..strokeWidth = 4
        ..maskFilter = const MaskFilter.blur(BlurStyle.normal, 5);
      canvas.drawCircle(epiPixel, rP, pPaint);

      // 内部干涉衍射环
      for (int i = 1; i < 5; i++) {
        double ri = rP - i * 12;
        if (ri > 0) {
          canvas.drawCircle(epiPixel, ri, Paint()
            ..color = Colors.cyan.withOpacity(math.max(0, 1.0 - time / 40.0) * (0.4 - i * 0.08))
            ..style = PaintingStyle.stroke
            ..strokeWidth = 2);
        }
      }
    }
深度分析:
为了渲染波的干涉带,我们并非只画一个主波前圈。对于每一个波形,我们向后计算了步长为 12 像素的多重内部干涉环 ri。随着距离拉远,干涉环的透明度发生了双重衰减------第一重来自于整体时间 math.max(0, 1.0 - time / 40.0) 的能量耗散,第二重来自于向内索引 (0.4 - i * 0.08) 的相位衰弱。配合 MaskFilter.blur,GPU光栅将渲染出极具赛博朋克深度的真实物理水波纹。
3.3 SeismographPainter.paint:高频示波器数组截断与越界防范
绘制数百个节点的浮点数组极易突破屏幕边界,需要施加严格的边界卡死计算。
dart
    // 2. 绘制地震图谱波形
    final path = Path();
    double dx = size.width / (data.length - 1);

    path.moveTo(0, size.height / 2 - data[0] * 12.0); // 振幅缩放因子 12.0
    for (int i = 1; i < data.length; i++) {
      double x = i * dx;
      double y = size.height / 2 - data[i] * 12.0;
      // 防止越界
      y = y.clamp(10.0, size.height - 10.0);
      path.lineTo(x, y);
    }

    // 添加外发光
    canvas.drawPath(path, Paint()
      ..color = Colors.limeAccent.withOpacity(0.3)
      ..style = PaintingStyle.stroke
      ..strokeWidth = 4
      ..maskFilter = const MaskFilter.blur(BlurStyle.normal, 3));

    // 核心波形线
    canvas.drawPath(path, Paint()
      ..color = Colors.limeAccent
      ..style = PaintingStyle.stroke
      ..strokeWidth = 1.2
      ..strokeJoin = StrokeJoin.round);
深度分析:
此处将一个抽象的时间序列数组展开成物理 Path。关键在于 y.clamp(10.0, size.height - 10.0) 的防爆机制,由于模拟 9.0 级地震时,S波振幅极大,如果不对 Y 轴进行截断限制,线条将直接飙出示波器框限,导致视觉错误。随后我们使用了两次 drawPath------第一次开启了模糊掩膜滤镜制造发光管的拖尾质感,第二次采用细线勾勒波锋中心,构建出了极其硬核的阴极射线管(CRT)光影特效。
3.4 纯极坐标台站连线绘制逻辑 _drawDashedLine
在 Canvas 中原生并未提供绘制虚线的接口。我们必须依靠欧几里得几何系在两个坐标点间进行正交分解。
dart
  void _drawDashedLine(Canvas canvas, Offset p1, Offset p2, Paint paint) {
    const double dashWidth = 5;
    const double dashSpace = 5;
    double startX = p1.dx;
    double startY = p1.dy;
    double distance = math.sqrt(math.pow(p2.dx - p1.dx, 2) + math.pow(p2.dy - p1.dy, 2));
    double angle = math.atan2(p2.dy - p1.dy, p2.dx - p1.dx);

    double currentX = startX;
    double currentY = startY;
    double drawn = 0;

    while (drawn < distance) {
      double nextX = currentX + dashWidth * math.cos(angle);
      double nextY = currentY + dashWidth * math.sin(angle);
      if (drawn + dashWidth > distance) {
        nextX = p2.dx;
        nextY = p2.dy;
      }
      canvas.drawLine(Offset(currentX, currentY), Offset(nextX, nextY), paint);
      drawn += dashWidth + dashSpace;
      currentX = nextX + dashSpace * math.cos(angle);
      currentY = nextY + dashSpace * math.sin(angle);
    }
  }
深度分析:
利用 math.atan2 提取出了起点到终点的绝对矢量角 angle。以此角度为核心枢纽,我们利用 x ′ = r cos θ x' = r \cos \theta x′=rcosθ 和 y ′ = r sin θ y' = r \sin \theta y′=rsinθ 驱动一个步长为 dashWidth 的游标 currentX/Y,不断在画布上跳跃。在 while 循环检测 drawn < distance 以确保线段绝不跨越终点站台。这一段底层函数展示了如何用最纯粹的解析几何在像素层面上操控图形管线。
4. 防抖测向滑槽与极客UI布局美学
控制台的界面要求达到航空军工级的可读性。因此我们在滑块调节区(Slider)运用了大量的等宽字体(monospace)配合动态变色绑定机制。
| 滑槽数据类型 | 字体色彩矩阵 | 说明 | 空间绑定关系 |
|---|---|---|---|
| P波波速 | Colors.cyan |
对应上方扩散圆弧的内圈强干涉波锋色 | V p = λ p ⋅ f p V_p = \lambda_p \cdot f_p Vp=λp⋅fp |
| S波波速 | Colors.orange |
对应上方外圈具有强大破坏力的低频宽厚波环 | V s = λ s ⋅ f s V_s = \lambda_s \cdot f_s Vs=λs⋅fs |
| 震中距数据 | Colors.cyanAccent |
使用 HUD 发光框并排列表,高对比度剥离背景底噪 | $\Delta = |
| S-P 时差 | 等宽加粗 | 这是判断地震方位的核心方程指标 | Δ t s − p = D ( 1 / v s − 1 / v p ) \Delta t_{s-p} = D(1/v_s - 1/v_p) Δts−p=D(1/vs−1/vp) |
每一个滑块在滑动时,不会导致整棵树重绘,因为我们将其状态封闭在了极其轻量的 setState 闭包内。结合右侧大屏幕上可随意拖拽的震源标志与监听台标志(GestureDetector.onPanUpdate),整个应用实现了一种操作上的物理手感。
5. 结语
在现代工业软件中,数据并不是冰冷的表格。这套利用 Flutter 自建渲染管线的系统,完全规避了第三方图表库臃肿的封包,直接用三角函数矩阵劈开了微积分方程在 UI 层的阻碍。通过本例,开发者应该能够熟练掌握底层 CustomPaint 在时间维度与高斯衰减域中的极致运用。不论是微波雷达、超声波成像还是此次的地震干涉图,这类波形系统的渲染逻辑同宗同源,展示了跨平台引擎极其凶悍的硬件计算下探能力。
完整代码
bash
import 'dart:async';
import 'dart:math' as math;
import 'dart:ui' as ui;
import 'package:flutter/material.dart';
import 'package:flutter/services.dart';
void main() {
WidgetsFlutterBinding.ensureInitialized();
runApp(const SeismicWaveApp());
}
class SeismicWaveApp extends StatelessWidget {
const SeismicWaveApp({super.key});
@override
Widget build(BuildContext context) {
return MaterialApp(
title: 'Seismic Wave Console',
debugShowCheckedModeBanner: false,
theme: ThemeData.dark().copyWith(
scaffoldBackgroundColor: const Color(0xFF040609),
colorScheme: const ColorScheme.dark(
primary: Color(0xFF00E5FF),
secondary: Color(0xFFFF3D00),
surface: Color(0xFF0D131F),
),
),
home: const SeismicConsoleScreen(),
);
}
}
class SeismicConsoleScreen extends StatefulWidget {
const SeismicConsoleScreen({super.key});
@override
State<SeismicConsoleScreen> createState() => _SeismicConsoleScreenState();
}
class _SeismicConsoleScreenState extends State<SeismicConsoleScreen> with TickerProviderStateMixin {
late AnimationController _simController;
late AnimationController _noiseController;
double _time = 0.0;
// 核心物理仿真参数
double _vp = 6.5; // 纵波波速 (km/s)
double _vs = 3.5; // 横波波速 (km/s)
double _magnitude = 6.8; // 模拟震级
double _damping = 0.04; // 地层阻尼系数
// 空间参数
Offset _epicenter = const Offset(0.3, 0.4); // 归一化震源坐标
Offset _station = const Offset(0.75, 0.65); // 归一化台站坐标
final List<double> _seismogramData = [];
final int _maxSamples = 500; // 示波器采样点数
@override
void initState() {
super.initState();
_noiseController = AnimationController(
vsync: this,
duration: const Duration(milliseconds: 100),
)..repeat();
_noiseController.addListener(_updateIdleNoise);
_simController = AnimationController(
vsync: this,
duration: const Duration(seconds: 12),
)..addListener(_updateSimulation);
// 初始化空波形槽
for (int i = 0; i < _maxSamples; i++) {
_seismogramData.add(0.0);
}
}
@override
void dispose() {
_simController.dispose();
_noiseController.dispose();
super.dispose();
}
void _updateIdleNoise() {
if (!_simController.isAnimating) {
setState(() {
_seismogramData.removeAt(0);
_seismogramData.add((math.Random().nextDouble() - 0.5) * 0.2);
});
}
}
void _triggerEarthquake() {
_simController.forward(from: 0.0);
}
void _updateSimulation() {
setState(() {
_time = _simController.value * 60.0; // 模拟 60 秒的物理传播过程
// 假设视口实际宽度映射为 200km 物理距离
double dx = (_epicenter.dx - _station.dx) * 200.0;
double dy = (_epicenter.dy - _station.dy) * 200.0;
double distance = math.sqrt(dx * dx + dy * dy);
double tp = distance / _vp;
double ts = distance / _vs;
double signal = (math.Random().nextDouble() - 0.5) * 0.2; // 基础底噪
// P波 (纵波) 到达,高频低幅
if (_time > tp) {
double pt = _time - tp;
signal += math.sin(pt * math.pi * 5.0) * math.exp(-pt * _damping * 3.0) * (_magnitude * 0.3);
}
// S波 (横波) 到达,低频高幅,杀伤力大
if (_time > ts) {
double st = _time - ts;
signal += math.sin(st * math.pi * 2.0) * math.exp(-st * _damping * 0.8) * (_magnitude * 0.8);
}
// 瑞利波 (表面波) 到达,极低频极高幅,带包络
double tr = distance / (_vs * 0.9); // 瑞利波略慢于S波
if (_time > tr) {
double rt = _time - tr;
signal += math.sin(rt * math.pi * 1.2) * math.exp(-math.pow(rt - 5.0, 2) / 10.0) * (_magnitude * 1.2);
}
_seismogramData.removeAt(0);
_seismogramData.add(signal);
});
}
@override
Widget build(BuildContext context) {
return Scaffold(
body: Row(
children: [
// 左侧参数面板
Container(
width: 340,
decoration: BoxDecoration(
color: Theme.of(context).colorScheme.surface,
border: const Border(right: BorderSide(color: Colors.white10, width: 2)),
),
padding: const EdgeInsets.all(24),
child: Column(
crossAxisAlignment: CrossAxisAlignment.start,
children: [
const Text('地震测向干涉图谱', style: TextStyle(fontSize: 24, fontWeight: FontWeight.bold, color: Colors.white)),
const SizedBox(height: 6),
const Text('SEISMIC WAVE INTERFERENCE', style: TextStyle(fontSize: 11, color: Colors.cyanAccent, letterSpacing: 2.5)),
const Padding(
padding: EdgeInsets.symmetric(vertical: 20),
child: Divider(height: 1, color: Colors.white12),
),
_buildSlider('纵波速度 (P-Wave Vp)', _vp, 4.0, 8.0, (v) => setState(() => _vp = v), 'km/s', Colors.cyan),
_buildSlider('横波速度 (S-Wave Vs)', _vs, 2.0, 5.0, (v) => setState(() => _vs = v), 'km/s', Colors.orange),
_buildSlider('震源释放能量 (Mw)', _magnitude, 3.0, 9.0, (v) => setState(() => _magnitude = v), '级', Colors.redAccent),
_buildSlider('地层衰减率 (Damping)', _damping, 0.01, 0.1, (v) => setState(() => _damping = v), '', Colors.purpleAccent),
const Spacer(),
// HUD 实时读数
Container(
padding: const EdgeInsets.all(16),
decoration: BoxDecoration(
color: Colors.black38,
borderRadius: BorderRadius.circular(12),
border: Border.all(color: Colors.cyan.withOpacity(0.3)),
boxShadow: [
BoxShadow(color: Colors.cyan.withOpacity(0.05), blurRadius: 10, spreadRadius: 2)
],
),
child: Column(
crossAxisAlignment: CrossAxisAlignment.start,
children: [
const Row(
children: [
Icon(Icons.radar, size: 16, color: Colors.cyanAccent),
SizedBox(width: 8),
Text('台站相对观测矩阵', style: TextStyle(color: Colors.white70, fontSize: 13, fontWeight: FontWeight.bold)),
],
),
const SizedBox(height: 16),
_buildTelemetryRow('震中欧几里得距离', '${(math.sqrt(math.pow((_epicenter.dx-_station.dx)*200, 2) + math.pow((_epicenter.dy-_station.dy)*200, 2))).toStringAsFixed(2)} km'),
_buildTelemetryRow('P波初动走时', '${(math.sqrt(math.pow((_epicenter.dx-_station.dx)*200, 2) + math.pow((_epicenter.dy-_station.dy)*200, 2)) / _vp).toStringAsFixed(2)} s'),
_buildTelemetryRow('S波初动走时', '${(math.sqrt(math.pow((_epicenter.dx-_station.dx)*200, 2) + math.pow((_epicenter.dy-_station.dy)*200, 2)) / _vs).toStringAsFixed(2)} s'),
_buildTelemetryRow('S-P 时差 (震相定位)', '${(math.sqrt(math.pow((_epicenter.dx-_station.dx)*200, 2) + math.pow((_epicenter.dy-_station.dy)*200, 2)) * (1/_vs - 1/_vp)).toStringAsFixed(2)} s'),
],
),
),
const SizedBox(height: 24),
SizedBox(
width: double.infinity,
height: 56,
child: ElevatedButton(
style: ElevatedButton.styleFrom(
backgroundColor: const Color(0xFFD50000), // 警报红
foregroundColor: Colors.white,
elevation: 8,
shadowColor: Colors.redAccent.withOpacity(0.5),
shape: RoundedRectangleBorder(borderRadius: BorderRadius.circular(8)),
),
onPressed: _triggerEarthquake,
child: const Row(
mainAxisAlignment: MainAxisAlignment.center,
children: [
Icon(Icons.warning_amber_rounded, size: 20),
SizedBox(width: 8),
Text('人工激发震源爆破', style: TextStyle(fontSize: 15, fontWeight: FontWeight.bold, letterSpacing: 1.2)),
],
),
),
),
],
),
),
// 右侧测绘域
Expanded(
child: Column(
children: [
// 地图交互层
Expanded(
flex: 5,
child: LayoutBuilder(
builder: (context, constraints) {
return Stack(
children: [
GestureDetector(
onTapDown: (details) {
setState(() {
_epicenter = Offset(
details.localPosition.dx / constraints.maxWidth,
details.localPosition.dy / constraints.maxHeight,
);
});
},
onSecondaryTapDown: (details) {
setState(() {
_station = Offset(
details.localPosition.dx / constraints.maxWidth,
details.localPosition.dy / constraints.maxHeight,
);
});
},
onPanUpdate: (details) {
setState(() {
_epicenter = Offset(
details.localPosition.dx / constraints.maxWidth,
details.localPosition.dy / constraints.maxHeight,
);
});
},
child: CustomPaint(
size: Size(constraints.maxWidth, constraints.maxHeight),
painter: SeismicMapPainter(
epicenter: _epicenter,
station: _station,
time: _time,
vp: _vp,
vs: _vs,
),
),
),
Positioned(
top: 16,
left: 16,
child: Container(
padding: const EdgeInsets.symmetric(horizontal: 12, vertical: 6),
decoration: BoxDecoration(
color: Colors.black54,
border: Border.all(color: Colors.white12),
borderRadius: BorderRadius.circular(4),
),
child: const Text('左键/拖拽: 移动震源 (Epicenter) | 右键: 移动台站 (Station)',
style: TextStyle(color: Colors.white54, fontSize: 12)),
),
),
],
);
}
),
),
// 示波器层
Container(
height: 220,
width: double.infinity,
decoration: const BoxDecoration(
color: Color(0xFF020407),
border: Border(top: BorderSide(color: Colors.white12, width: 2)),
),
child: CustomPaint(
painter: SeismographPainter(
data: _seismogramData,
time: _time,
),
),
),
],
),
),
],
),
);
}
Widget _buildSlider(String label, double value, double min, double max, ValueChanged<double> onChanged, String unit, Color color) {
return Padding(
padding: const EdgeInsets.only(bottom: 20.0),
child: Column(
crossAxisAlignment: CrossAxisAlignment.start,
children: [
Row(
mainAxisAlignment: MainAxisAlignment.spaceBetween,
children: [
Text(label, style: const TextStyle(color: Colors.white70, fontSize: 13)),
Text('${value.toStringAsFixed(2)} $unit', style: TextStyle(color: color, fontWeight: FontWeight.bold, fontFamily: 'monospace')),
],
),
const SizedBox(height: 8),
SliderTheme(
data: SliderThemeData(
activeTrackColor: color,
inactiveTrackColor: color.withOpacity(0.15),
thumbColor: color,
overlayColor: color.withOpacity(0.2),
trackHeight: 3,
),
child: Slider(
value: value,
min: min,
max: max,
onChanged: onChanged,
),
),
],
),
);
}
Widget _buildTelemetryRow(String label, String value) {
return Padding(
padding: const EdgeInsets.only(bottom: 10.0),
child: Row(
mainAxisAlignment: MainAxisAlignment.spaceBetween,
children: [
Text(label, style: const TextStyle(color: Colors.white54, fontSize: 13)),
Text(value, style: const TextStyle(color: Colors.cyanAccent, fontSize: 15, fontFamily: 'monospace', fontWeight: FontWeight.bold)),
],
),
);
}
}
class SeismicMapPainter extends CustomPainter {
final Offset epicenter;
final Offset station;
final double time;
final double vp;
final double vs;
SeismicMapPainter({
required this.epicenter,
required this.station,
required this.time,
required this.vp,
required this.vs,
});
@override
void paint(Canvas canvas, Size size) {
// 1. 绘制极地暗网格底纹
final gridPaint = Paint()
..color = Colors.cyan.withOpacity(0.04)
..style = PaintingStyle.stroke
..strokeWidth = 1;
double gridSize = 50;
for (double i = 0; i < size.width; i += gridSize) {
canvas.drawLine(Offset(i, 0), Offset(i, size.height), gridPaint);
}
for (double i = 0; i < size.height; i += gridSize) {
canvas.drawLine(Offset(0, i), Offset(size.width, i), gridPaint);
}
Offset epiPixel = Offset(epicenter.dx * size.width, epicenter.dy * size.height);
Offset staPixel = Offset(station.dx * size.width, station.dy * size.height);
// 假设视口宽度映射为 200km 物理距离
double pixelPerKm = size.width / 200.0;
// 2. 绘制震波前锋
// P波渲染 (压缩波 - 蓝色相)
double rP = time * vp * pixelPerKm;
if (rP > 0) {
final pPaint = Paint()
..color = Colors.cyan.withOpacity(math.max(0, 1.0 - time / 40.0) * 0.6)
..style = PaintingStyle.stroke
..strokeWidth = 4
..maskFilter = const MaskFilter.blur(BlurStyle.normal, 5);
canvas.drawCircle(epiPixel, rP, pPaint);
// 内部干涉衍射环
for (int i = 1; i < 5; i++) {
double ri = rP - i * 12;
if (ri > 0) {
canvas.drawCircle(epiPixel, ri, Paint()
..color = Colors.cyan.withOpacity(math.max(0, 1.0 - time / 40.0) * (0.4 - i * 0.08))
..style = PaintingStyle.stroke
..strokeWidth = 2);
}
}
}
// S波渲染 (剪切波 - 橙色相,更慢但破坏力更高)
double rS = time * vs * pixelPerKm;
if (rS > 0) {
final sPaint = Paint()
..color = Colors.orange.withOpacity(math.max(0, 1.0 - time / 40.0) * 0.8)
..style = PaintingStyle.stroke
..strokeWidth = 8
..maskFilter = const MaskFilter.blur(BlurStyle.solid, 4);
canvas.drawCircle(epiPixel, rS, sPaint);
for (int i = 1; i < 4; i++) {
double ri = rS - i * 8;
if (ri > 0) {
canvas.drawCircle(epiPixel, ri, Paint()
..color = Colors.orangeAccent.withOpacity(math.max(0, 1.0 - time / 40.0) * (0.6 - i * 0.15))
..style = PaintingStyle.stroke
..strokeWidth = 3);
}
}
}
// 3. 绘制台站追踪射线
final linePaint = Paint()
..color = Colors.white.withOpacity(0.15)
..style = PaintingStyle.stroke
..strokeWidth = 1.5;
// 绘制虚线连线
_drawDashedLine(canvas, epiPixel, staPixel, linePaint);
// 4. 绘制台站标记
canvas.drawCircle(staPixel, 14, Paint()..color = Colors.greenAccent.withOpacity(0.2));
canvas.drawCircle(staPixel, 6, Paint()..color = Colors.greenAccent);
canvas.drawCircle(staPixel, 3, Paint()..color = Colors.black);
final textPainter = TextPainter(
text: const TextSpan(text: 'OBSERVATION ST.', style: TextStyle(color: Colors.greenAccent, fontSize: 10, fontFamily: 'monospace')),
textDirection: TextDirection.ltr,
);
textPainter.layout();
textPainter.paint(canvas, Offset(staPixel.dx + 12, staPixel.dy - 20));
// 5. 绘制震源标记
final epiIconPaint = Paint()
..color = Colors.redAccent
..style = PaintingStyle.fill;
canvas.drawCircle(epiPixel, 8, epiIconPaint);
canvas.drawCircle(epiPixel, 20, Paint()
..color = Colors.red.withOpacity(0.4)
..style = PaintingStyle.stroke
..strokeWidth = 2);
// 绘制震中十字准星
canvas.drawLine(Offset(epiPixel.dx - 30, epiPixel.dy), Offset(epiPixel.dx + 30, epiPixel.dy), Paint()..color = Colors.redAccent.withOpacity(0.5)..strokeWidth = 1);
canvas.drawLine(Offset(epiPixel.dx, epiPixel.dy - 30), Offset(epiPixel.dx, epiPixel.dy + 30), Paint()..color = Colors.redAccent.withOpacity(0.5)..strokeWidth = 1);
final epiTextPainter = TextPainter(
text: const TextSpan(text: 'EPICENTER (X, Y)', style: TextStyle(color: Colors.redAccent, fontSize: 10, fontFamily: 'monospace')),
textDirection: TextDirection.ltr,
);
epiTextPainter.layout();
epiTextPainter.paint(canvas, Offset(epiPixel.dx + 12, epiPixel.dy + 12));
}
void _drawDashedLine(Canvas canvas, Offset p1, Offset p2, Paint paint) {
const double dashWidth = 5;
const double dashSpace = 5;
double startX = p1.dx;
double startY = p1.dy;
double distance = math.sqrt(math.pow(p2.dx - p1.dx, 2) + math.pow(p2.dy - p1.dy, 2));
double angle = math.atan2(p2.dy - p1.dy, p2.dx - p1.dx);
double currentX = startX;
double currentY = startY;
double drawn = 0;
while (drawn < distance) {
double nextX = currentX + dashWidth * math.cos(angle);
double nextY = currentY + dashWidth * math.sin(angle);
if (drawn + dashWidth > distance) {
nextX = p2.dx;
nextY = p2.dy;
}
canvas.drawLine(Offset(currentX, currentY), Offset(nextX, nextY), paint);
drawn += dashWidth + dashSpace;
currentX = nextX + dashSpace * math.cos(angle);
currentY = nextY + dashSpace * math.sin(angle);
}
}
@override
bool shouldRepaint(covariant SeismicMapPainter oldDelegate) {
return oldDelegate.time != time ||
oldDelegate.epicenter != epicenter ||
oldDelegate.station != station ||
oldDelegate.vp != vp ||
oldDelegate.vs != vs;
}
}
class SeismographPainter extends CustomPainter {
final List<double> data;
final double time;
SeismographPainter({required this.data, required this.time});
@override
void paint(Canvas canvas, Size size) {
// 1. 绘制示波器网格
final gridPaint = Paint()
..color = Colors.cyan.withOpacity(0.1)
..strokeWidth = 1;
// 横向网格
for (int i = 1; i <= 4; i++) {
canvas.drawLine(Offset(0, size.height * i / 5), Offset(size.width, size.height * i / 5), gridPaint);
}
// 纵向网格
for (int i = 1; i <= 20; i++) {
canvas.drawLine(Offset(size.width * i / 20, 0), Offset(size.width * i / 20, size.height), gridPaint);
}
// 中心零线
canvas.drawLine(
Offset(0, size.height / 2),
Offset(size.width, size.height / 2),
Paint()..color = Colors.white30..strokeWidth = 1.5
);
if (data.isEmpty) return;
// 2. 绘制地震图谱波形
final path = Path();
double dx = size.width / (data.length - 1);
path.moveTo(0, size.height / 2 - data[0] * 12.0); // 振幅缩放因子 12.0
for (int i = 1; i < data.length; i++) {
double x = i * dx;
double y = size.height / 2 - data[i] * 12.0;
// 防止越界
y = y.clamp(10.0, size.height - 10.0);
path.lineTo(x, y);
}
// 添加外发光
canvas.drawPath(path, Paint()
..color = Colors.limeAccent.withOpacity(0.3)
..style = PaintingStyle.stroke
..strokeWidth = 4
..maskFilter = const MaskFilter.blur(BlurStyle.normal, 3));
// 核心波形线
canvas.drawPath(path, Paint()
..color = Colors.limeAccent
..style = PaintingStyle.stroke
..strokeWidth = 1.2
..strokeJoin = StrokeJoin.round);
// 3. 绘制刻度说明文本
final textPainter = TextPainter(
text: const TextSpan(text: 'AMPLITUDE (mm/s) - TIME', style: TextStyle(color: Colors.white54, fontSize: 10, fontFamily: 'monospace')),
textDirection: TextDirection.ltr,
);
textPainter.layout();
textPainter.paint(canvas, const Offset(10, 10));
// 扫描头指示
canvas.drawLine(Offset(size.width - 2, 0), Offset(size.width - 2, size.height), Paint()..color = Colors.redAccent..strokeWidth = 2);
}
@override
bool shouldRepaint(covariant SeismographPainter oldDelegate) {
return true; // 持续重绘波形
}
}