嘿大家好久不见,今天来画一个弧长链接图,大概长这样:

感觉有点像弦图把原本环绕的节点有序的放在了一条直线上:
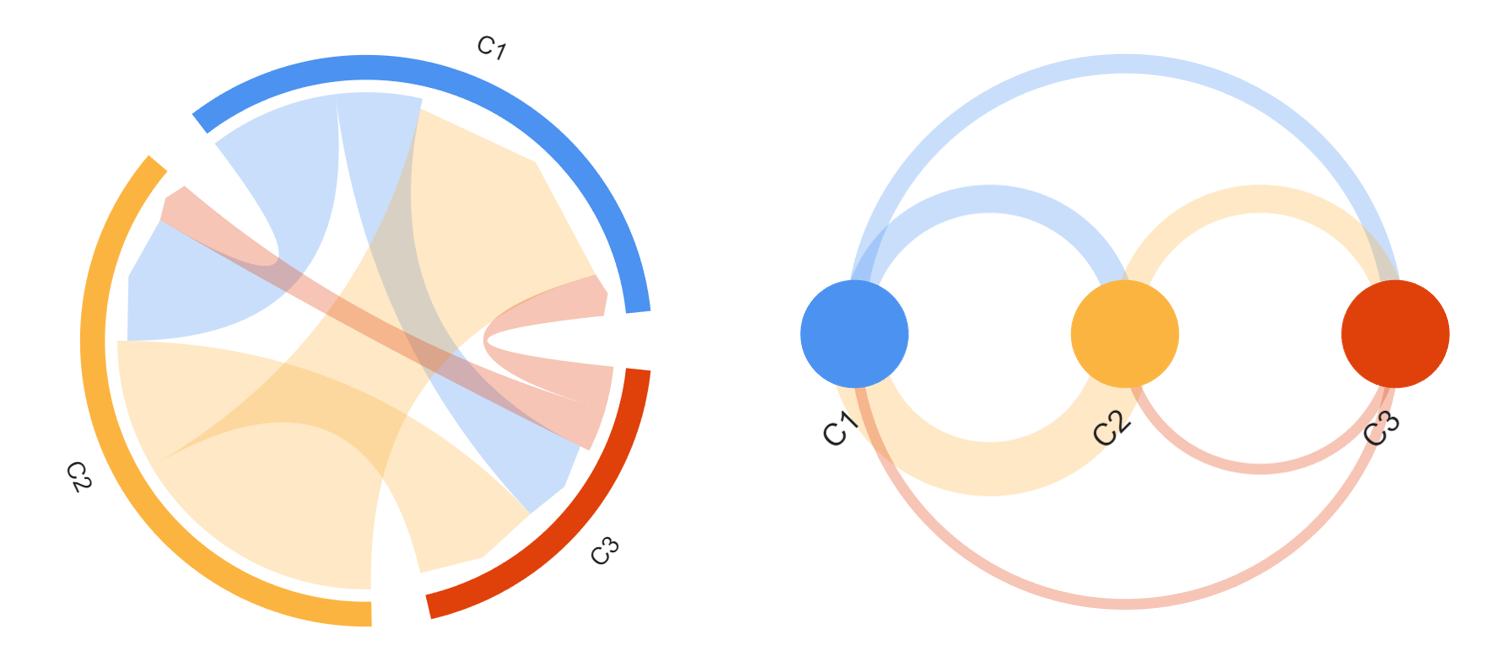
能够明显的看出弧长链接图更加重视了节点之间的顺序,常见的用法比如:
- 使用节点表示一辆列车各个站点,两个站点之间的连线宽度代表有多少人前一个站点上车,后一个站点下车。
- 人物关系网络,将人物按照首次出场顺序排列。
- 将基因按照其在染色体上的物理位置排列成一条线。如果两个基因在功能上相关或同时被表达(共表达),就用一条弧线将它们连接起来。
代码获取
工具函数完整代码见文末或者gitee仓库:
示例
基本使用
假设我们有一个上三角矩阵,第i行第j列的数值代表由节点i流向节点j的流量,主对角线的数值可以都设置为1,或者用来存储其他可视化信息,用来控制节点大小:
matlab
Data = [25,  0, 11, 22, 24, 25,  8,  0;
         0, 14,  0,  0,  0,  0,  4,  0;
         0,  0, 11,  0,  0,  0,  0,  0;
         0,  0,  0, 22,  0, 20, 17,  0;
         0,  0,  0,  0, 24,  3,  6,  3;
         0,  0,  0,  0,  0, 25,  7,  0;
         0,  0,  0,  0,  0,  0, 17,  0;
         0,  0,  0,  0,  0,  0,  0, 11];

% 创建弧长链接图对象(Create a arc chart object)
ARC = arcChart(Data);

% 开始绘图(Start drawing)
ARC.draw();

% 显示并修改标签字体(Show labels and set the font)
ARC.setLabel('FontSize', 17, 'FontName', 'Times New Roman')

% 显示图例(Display legend)
% ARC.nodeLegend()
% ARC.edgeLegend()
%              Position
ARC.nodeLegend([-.5, 0], 'FontSize', 15, 'FontName', 'Times New Roman')
ARC.edgeLegend([-.5, 2.5], 'FontSize', 15, 'FontName', 'Times New Roman')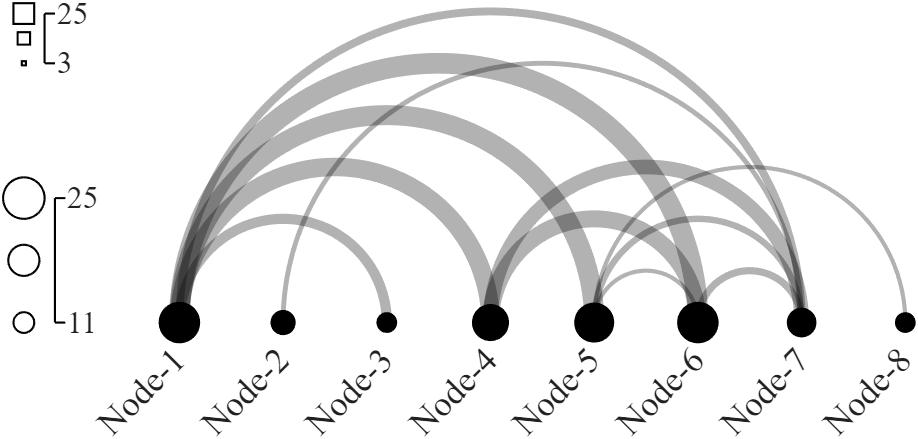
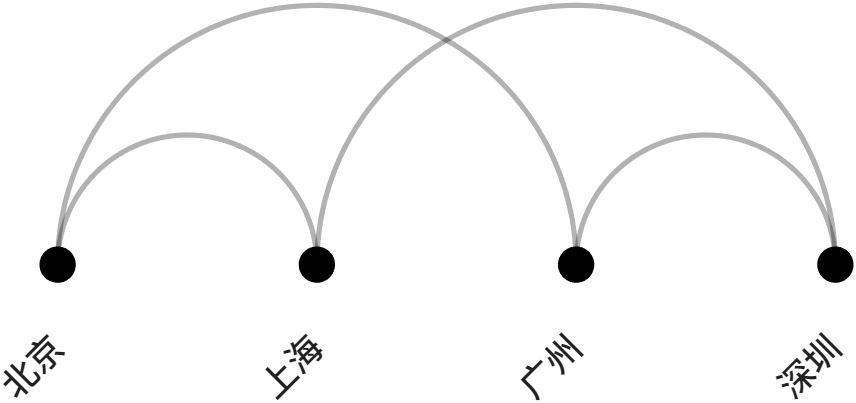
节点大小与线条粗细
节点大小和线条粗细都是一个含两个元素的数组,如果两个元素设置的一样的话,所有节点都一样大,所有弦图都一样粗细:
matlab
Data = [1, 1, 6, 0;
        0, 1, 0, 1;
        0, 0, 5, 2;
        0, 0, 0, 1];

ARC = arcChart(Data);
ARC.NodeName = {'北京','上海','广州','深圳'};     % 设置节点名称(Set node names)
ARC.NodeSizeLim = [.07, .07];                    % 设置节点大小范围(Set size limit of node)
ARC.EdgeWidthLim = [.1, .1];                     % 设置链接宽度范围(Set width limit of edge)

ARC.draw();
ARC.setLabel()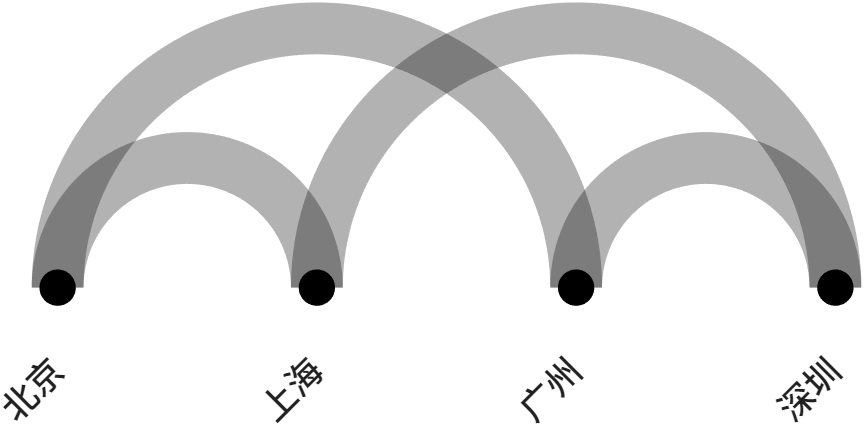
顺带一提:字体可以单独修改,例如:
matlab
ARC.setLabelN(2, 'Rotation', 0, 'Color','r', 'HorizontalAlignment','center')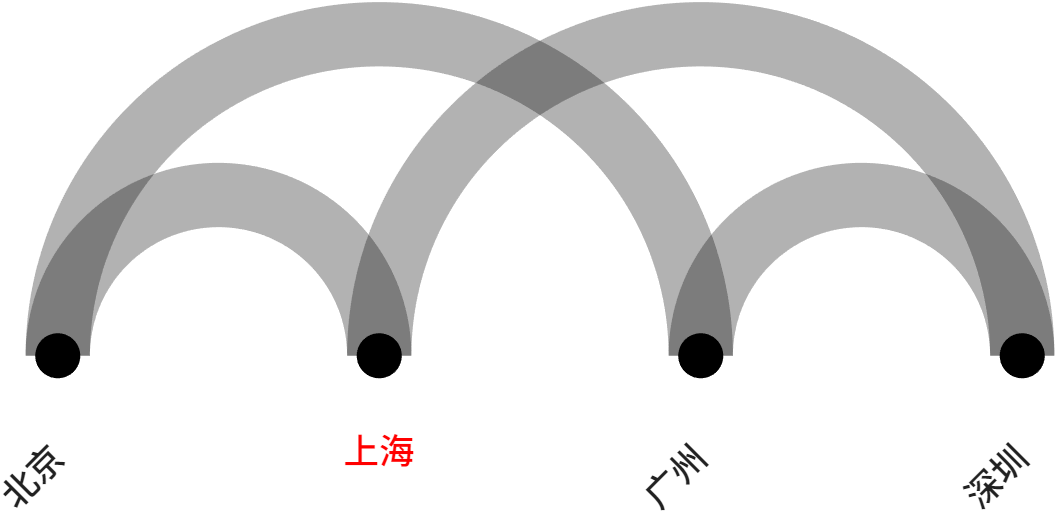
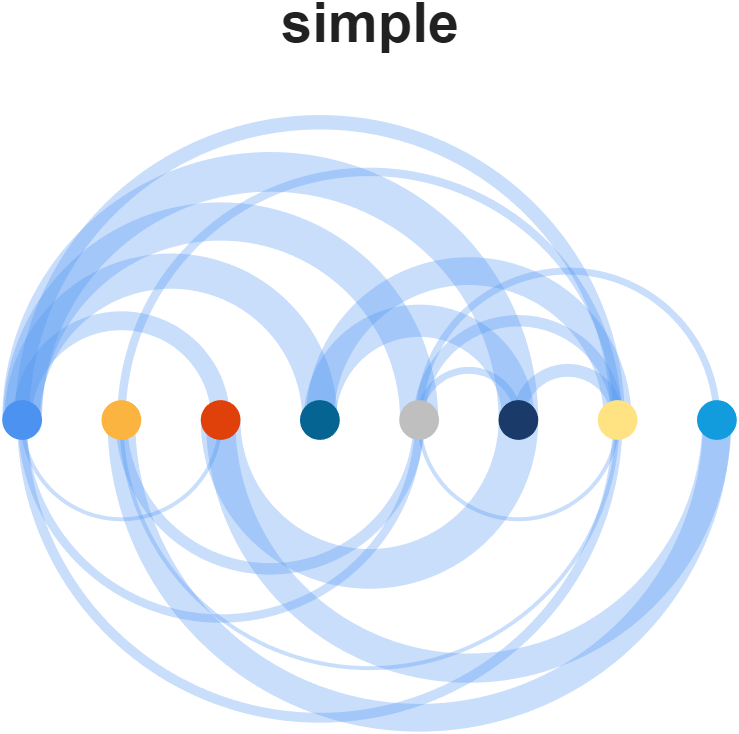
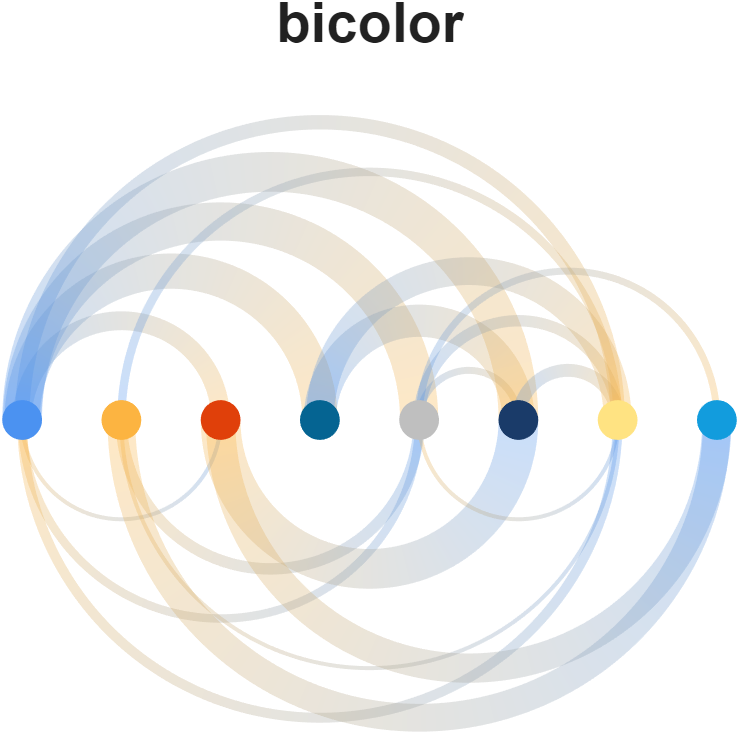
链接的渲染
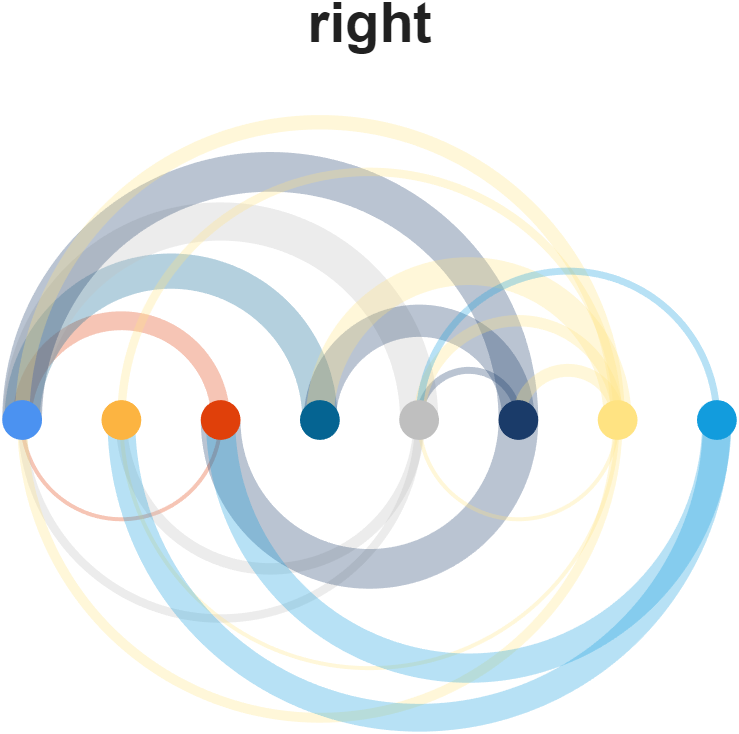
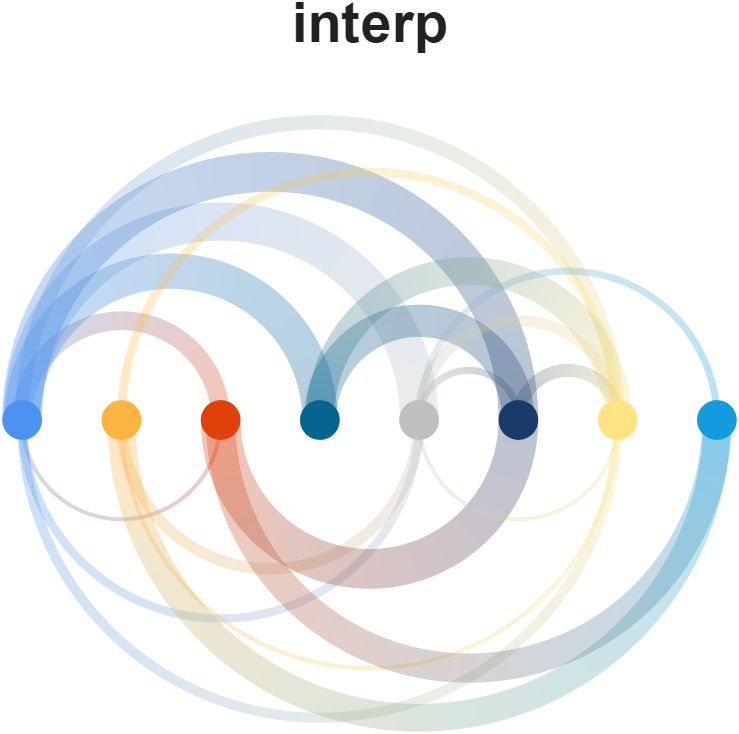
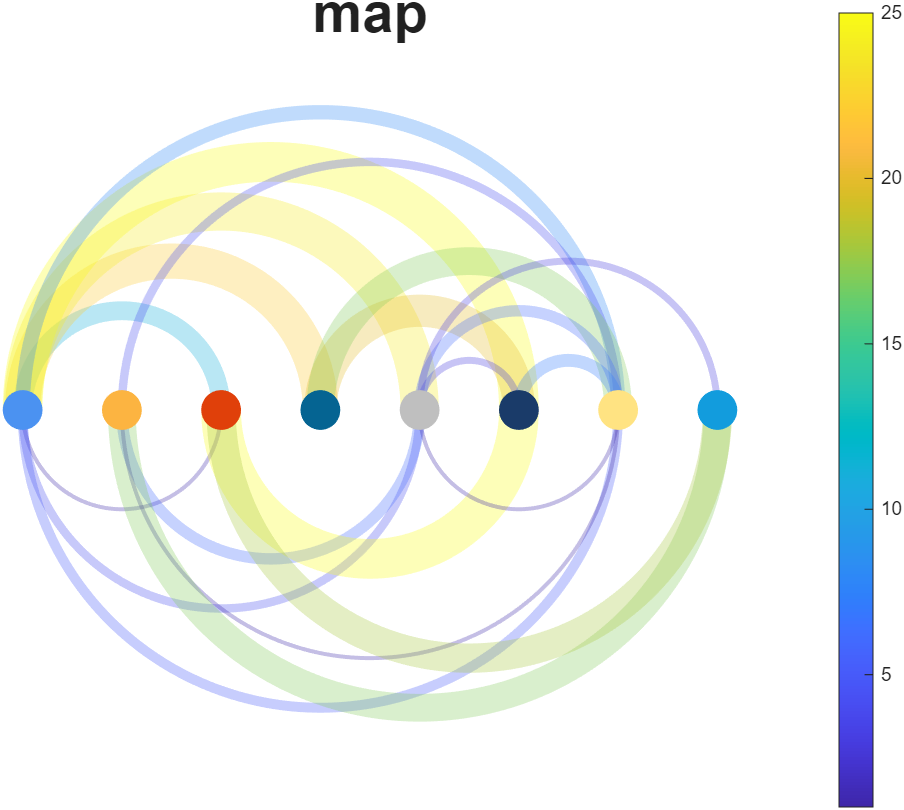
设置RenderingMethod属性即可,可以选择的方法有:
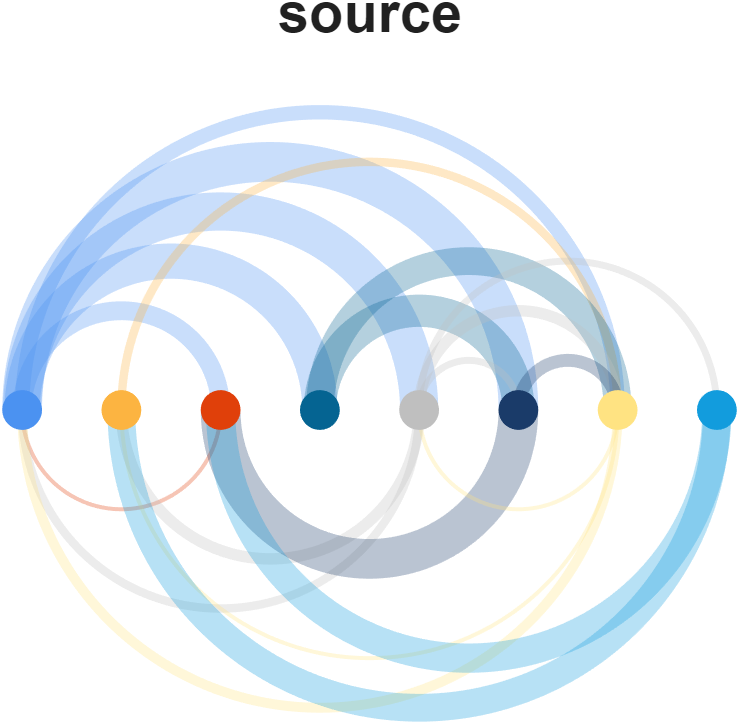
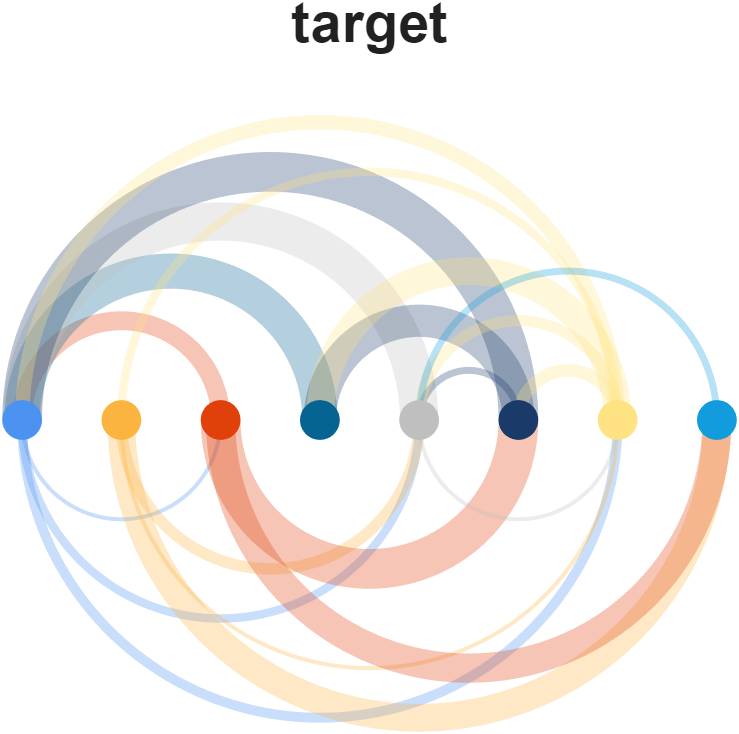
'simple', 'left', 'right', 'interp', 'map', 'bicolor', 'source', 'target'
matlab
rng(1)
Data = randi([1, 25], [8, 8]);
Data(rand([8, 8]) < .65) = 0;
Data = Data + eye(8);

% Color list
CList = [ 75,146,241; 252,180, 65; 224, 64, 10;   5,100,146; 191,191,191;
          26, 59,105; 255,227,130;  18,156,221; 202,107, 75;   0, 92,219;
         243,210,136;  80, 99,129; 241,185,168; 224,131, 10; 120,147,190]./255;

ARC = arcChart(Data);
% 设置节点和链接颜色,若未设置链接颜色则默认与节点颜色相同
% Set node color and edge color, the default edge color is as same as node color
ARC.NodeColor = CList;
ARC.EdgeColor = CList;
ARC.NodeSizeLim = [.2, .2];
ARC.EdgeWidthLim = [.02, .2];

% 设置链接样式(Set the rendering method for edges)
% 'simple', 'left', 'right', 'interp', 'map', 'bicolor', 'source', 'target'
method = 'target';
ARC.RenderingMethod = method;
ARC.draw();

% colorbar
text(4.5, 4, method, 'FontSize',27, 'FontWeight','bold', 'HorizontalAlignment','center')
单色
双色
与左节点颜色相同
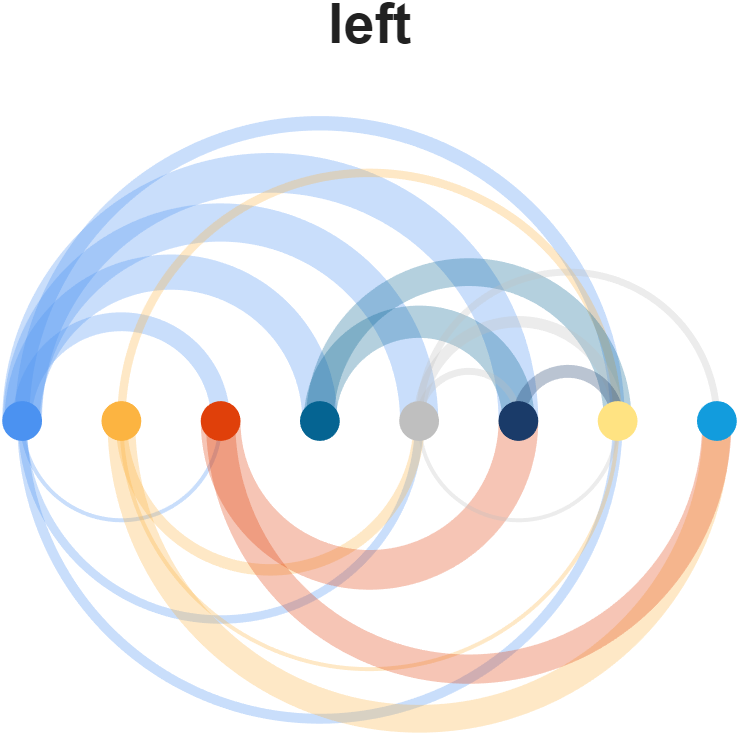
与右节点颜色相同
渐变
与数值大小相关
与起始节点颜色相同
与结束节点颜色相同
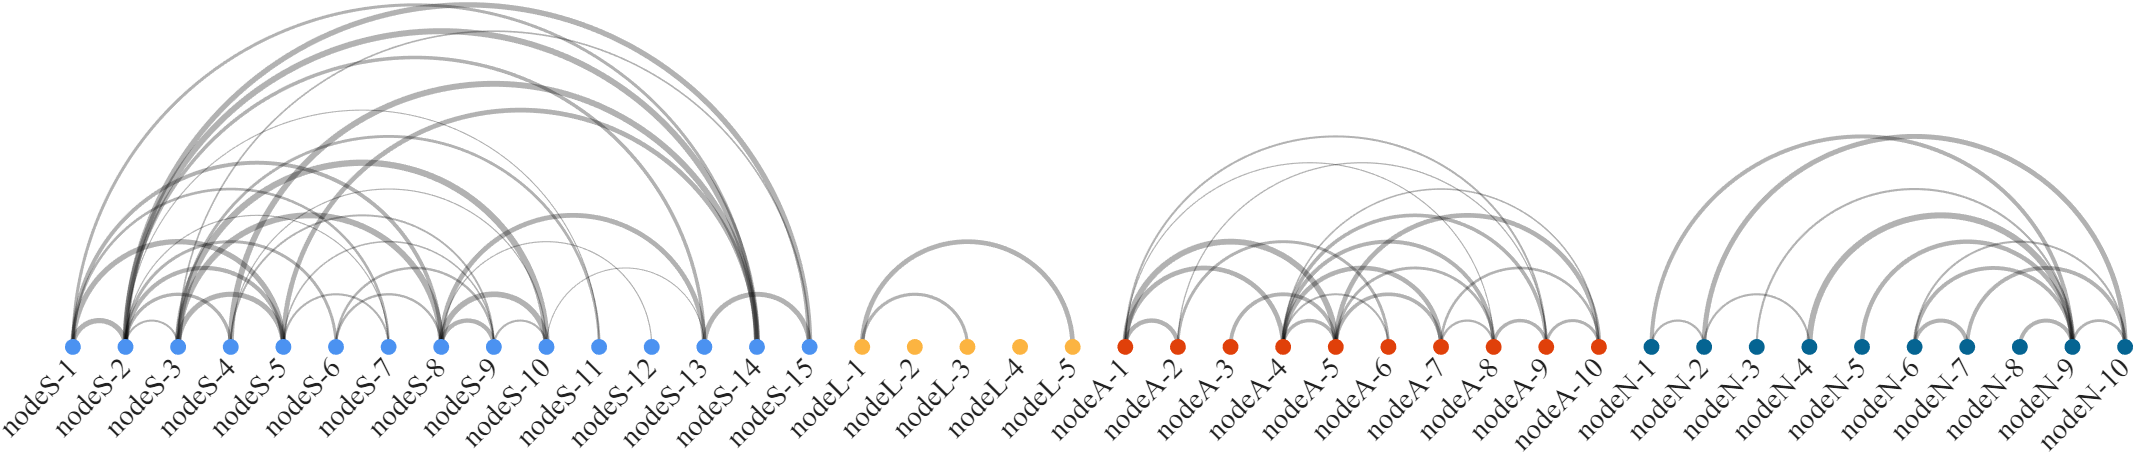
一个例子
matlab
rng(2)
% 随机生成数据(Randomly generated data)
Data = zeros(40, 40);
Data(1:15, 1:15)   = triu(rand(15));
Data(16:20, 16:20) = triu(rand(5));
Data(21:30, 21:30) = triu(rand(10));
Data(31:40, 31:40) = triu(rand(10));
Data(rand([40, 40]) < .65) = 0;
Data = Data + eye(40);

% Colors and name list for nodes
CList = [ 75,146,241; 252,180, 65; 224, 64, 10;   5,100,146]./255;
Class = [ones(1,15), 2.*ones(1,5), 3.*ones(1,10), 4.*ones(1,10)];
NList = [compose('nodeS-%d',1:15), compose('nodeL-%d',1:5), ...
         compose('nodeA-%d',1:10), compose('nodeN-%d',1:10)];

ARC = arcChart(Data);
ARC.NodeName = NList;
ARC.NodeColor = CList(Class.',:);
ARC.EdgeColor = [0,0,0];
ARC.NodeSizeLim = [.15,.15];
ARC.EdgeWidthLim = [.01,.06];
ARC.draw();

ARC.setLabel('FontSize',14, 'FontName','Times New Roman')
axis tight
工具函数完整代码:
matlab
classdef arcChart < handle

    properties
        ax
        arginList = {'RenderingMethod', 'NodeSizeLim', 'EdgeWidthLim', ...
                     'NodeColor', 'EdgeColor'}
        dataMat                      % 数值矩阵
        NodeName = {}
        NodeColor = [0, 0, 0]        % 节点配色
        EdgeColor = 'flat'           % 链接配色
        NodeAlpha = 1                % 节点透明度
        EdgeAlpha = .3               % 连接透明度
        RenderingMethod = 'simple'   % 'left'/'right'/'interp'/'map'
                                     %  'simple'/'bicolor'/'source'/'target'
        NodeSizeLim  = [.1, .2 ]     % 节点大小范围
        EdgeWidthLim = [.02, .1]     % 链接宽度范围

        edgeMatHdl
        nodeHdl
        labelHdl
    end

    methods
        function obj = arcChart(varargin)
            if isa(varargin{1},'matlab.graphics.axis.Axes')
                obj.ax = varargin{1};
                varargin(1) = [];
            else
                obj.ax = gca;
            end

            obj.dataMat = abs(varargin{1});
            varargin(1) = [];
            for i = 1:2:(length(varargin) - 1)
                tid = ismember(lower(obj.arginList), lower(varargin{i}));
                if any(tid)
                    obj.(obj.arginList{tid}) = varargin{i + 1};
                end
            end
            if isempty(obj.NodeName)
                obj.NodeName = compose('Node-%d', 1:size(obj.dataMat, 1));
            end
        end
        function obj = draw(obj)
            if isstring(obj.EdgeColor) || ischar(obj.EdgeColor)
                tmpColor = obj.NodeColor;
            else
                tmpColor = obj.EdgeColor;
            end
            % ---------------------------------
            obj.ax.NextPlot = 'add';
            obj.ax.DataAspectRatio = [1, 1, 1];
            obj.ax.XColor = 'none';
            obj.ax.YColor = 'none';
            % ---------------------------------
            t1 = linspace(0, 2*pi, 200);
            t2 = linspace(pi, 0, 200);
            x1 = cos(t1); y1 = sin(t1);
            x2 = cos(t2); y2 = sin(t2);
            minN = min(obj.dataMat(eye(size(obj.dataMat)) == 1 & obj.dataMat ~= 0));
            maxN = max(obj.dataMat(eye(size(obj.dataMat)) == 1 & obj.dataMat ~= 0));
            minE = min(obj.dataMat(eye(size(obj.dataMat)) == 0 & obj.dataMat ~= 0));
            maxE = max(obj.dataMat(eye(size(obj.dataMat)) == 0 & obj.dataMat ~= 0));


            % 绘制连接
            for i = 1:size(obj.dataMat, 1)
                for j = 1:size(obj.dataMat, 1)
                    if i ~= j && obj.dataMat(i, j) ~= 0
                        if maxE == minE
                            tR2 = 0*(obj.dataMat(i, j) == 0) + max(abs(obj.EdgeWidthLim))*(obj.dataMat(i, j) > 0);
                        else
                            tR2 = 0*(obj.dataMat(i, j) == 0) + ...
                                ((obj.dataMat(i, j) - minE)./(maxE - minE).*abs(diff(obj.EdgeWidthLim)) + min(abs(obj.EdgeWidthLim)))*(obj.dataMat(i, j) > 0);
                        end
                        if j > i
                            tX1 = (i + j)/2 + ((j - i)/2 + tR2)*(x2);
                            tX2 = (i + j)/2 + ((j - i)/2 - tR2)*x2(end:-1:1);
                            tY1 = ((j - i)/2 + tR2)*y2;
                            tY2 = ((j - i)/2 - tR2)*y2(end:-1:1);
                        else
                            tX1 = (i + j)/2 + ((i - j)/2 + tR2)*(x2);
                            tX2 = (i + j)/2 + ((i - j)/2 - tR2)*x2(end:-1:1);
                            tY1 = - ((i - j)/2 + tR2)*y2;
                            tY2 = - ((i - j)/2 - tR2)*y2(end:-1:1);
                        end
                        TT = repmat(linspace(0,1,10).', [1, 200]);
                        XX = repmat(tX2(end:-1:1) - tX1, [10, 1]).*TT + repmat(tX1, [10,1]);
                        YY = repmat(tY2(end:-1:1) - tY1, [10, 1]).*TT + repmat(tY1, [10,1]);
                        MC = ones(10, 200, 3);

                        switch obj.RenderingMethod
                            case 'simple'
                                obj.edgeMatHdl(i, j) = fill(obj.ax, [tX1, tX2], [tY1, tY2], tmpColor(1, :), 'EdgeColor','none', 'FaceAlpha',obj.EdgeAlpha);
                            case 'source'
                                obj.edgeMatHdl(i, j) = fill(obj.ax, [tX1, tX2], [tY1, tY2], tmpColor(mod(i - 1, size(tmpColor, 1)) + 1, :), 'EdgeColor','none', 'FaceAlpha',obj.EdgeAlpha);
                            case 'target'
                                obj.edgeMatHdl(i, j) = fill(obj.ax, [tX1, tX2], [tY1, tY2], tmpColor(mod(j - 1, size(tmpColor, 1)) + 1, :), 'EdgeColor','none', 'FaceAlpha',obj.EdgeAlpha);
                            case 'left'
                                obj.edgeMatHdl(i, j) = fill(obj.ax, [tX1, tX2], [tY1, tY2], tmpColor(mod(i*(j > i) + j*(j < i) - 1, size(tmpColor, 1)) + 1, :), 'EdgeColor','none', 'FaceAlpha',obj.EdgeAlpha);
                            case 'right'
                                obj.edgeMatHdl(i, j) = fill(obj.ax, [tX1, tX2], [tY1, tY2], tmpColor(mod(j*(j > i) + i*(j < i) - 1, size(tmpColor, 1)) + 1, :), 'EdgeColor','none', 'FaceAlpha',obj.EdgeAlpha);
                            case 'interp'
                                if j > i
                                    tCi = tmpColor(mod(i - 1, size(tmpColor, 1)) + 1, :);
                                    tCj = tmpColor(mod(j - 1, size(tmpColor, 1)) + 1, :);
                                else
                                    tCi = tmpColor(mod(j - 1, size(tmpColor, 1)) + 1, :);
                                    tCj = tmpColor(mod(i - 1, size(tmpColor, 1)) + 1, :);
                                end
                                MC(:, :, 1) = repmat(linspace(tCi(1), tCj(1), 200), [10, 1]);
                                MC(:, :, 2) = repmat(linspace(tCi(2), tCj(2), 200), [10, 1]);
                                MC(:, :, 3) = repmat(linspace(tCi(3), tCj(3), 200), [10, 1]);
                                obj.edgeMatHdl(i, j) = surf(obj.ax, XX, YY, XX.*0, 'CData',MC, 'EdgeColor','none', 'FaceAlpha',obj.EdgeAlpha);
                            case 'bicolor'
                                if j > i
                                    tCi = tmpColor(mod(1 - 1, size(tmpColor, 1)) + 1, :);
                                    tCj = tmpColor(mod(2 - 1, size(tmpColor, 1)) + 1, :);
                                else
                                    tCi = tmpColor(mod(2 - 1, size(tmpColor, 1)) + 1, :);
                                    tCj = tmpColor(mod(1 - 1, size(tmpColor, 1)) + 1, :);
                                end
                                MC(:, :, 1) = repmat(linspace(tCi(1), tCj(1), 200), [10, 1]);
                                MC(:, :, 2) = repmat(linspace(tCi(2), tCj(2), 200), [10, 1]);
                                MC(:, :, 3) = repmat(linspace(tCi(3), tCj(3), 200), [10, 1]);
                                obj.edgeMatHdl(i, j) = surf(obj.ax, XX, YY, XX.*0, 'CData',MC, 'EdgeColor','none', 'FaceAlpha',obj.EdgeAlpha);
                            case 'map'
                                obj.edgeMatHdl(i, j) = fill(obj.ax, [tX1, tX2], [tY1, tY2], [0,0,0], 'EdgeColor','none', 'FaceAlpha',obj.EdgeAlpha, 'FaceColor','flat', 'CData',obj.dataMat(i,j));
                        end
                        % if obj.dataMat(i, j) == 0
                        %     set(obj.edgeMatHdl(i, j), 'Visible', 'off')
                        % end
                    end
                end
            end


            % 绘制节点和标签
            for i = 1:size(obj.dataMat, 1)
                if maxN == minN
                    tR1 = 0*(obj.dataMat(i, i) == 0) + max(abs(obj.NodeSizeLim))*(obj.dataMat(i, i) > 0);
                else
                    tR1 = 0*(obj.dataMat(i, i) == 0) + ...
                    ((obj.dataMat(i, i) - minN)./(maxN - minN).*abs(diff(obj.NodeSizeLim)) + min(abs(obj.NodeSizeLim)))*(obj.dataMat(i, i) > 0);
                end
                obj.nodeHdl(i) = fill(obj.ax, i + x1.*tR1, y1.*tR1, obj.NodeColor(mod(i - 1, size(obj.NodeColor, 1)) + 1, :), ...
                    'EdgeColor','none', 'FaceAlpha',obj.NodeAlpha);
                obj.labelHdl(i) = text(obj.ax, i, -.3, obj.NodeName{i}, 'FontSize',17, 'HorizontalAlignment','right', 'Rotation',45, 'Visible','off');
            end
        end

        function setLabelN(obj, n, varargin)
            set(obj.labelHdl(n), 'Visible','on', varargin{:})
        end
        function setLabel(obj, varargin)
            for i = 1:size(obj.dataMat, 1)
                set(obj.labelHdl(i), 'Visible','on', varargin{:})
            end
        end

        function nodeLegend(obj, varargin)
            if nargin < 2
                pos = [-.5, 0];
            elseif isnumeric(varargin{1})
                pos = varargin{1};
                varargin(1) = [];
            end

            t1 = linspace(0, 2*pi, 200);
            x1 = cos(t1); y1 = sin(t1);
            minN = min(obj.dataMat(eye(size(obj.dataMat)) == 1 & obj.dataMat ~= 0));
            maxN = max(obj.dataMat(eye(size(obj.dataMat)) == 1 & obj.dataMat ~= 0));
            fill(obj.ax, x1.*min(abs(obj.NodeSizeLim)) + pos(1), y1.*min(abs(obj.NodeSizeLim)) + pos(2), [1,1,1],'EdgeColor','k','LineWidth',1)
            fill(obj.ax, x1.*mean(abs(obj.NodeSizeLim)) + pos(1), y1.*mean(abs(obj.NodeSizeLim)) + pos(2) + 2*sum(abs(obj.NodeSizeLim)), [1,1,1],'EdgeColor','k','LineWidth',1)
            fill(obj.ax, x1.*max(abs(obj.NodeSizeLim)) + pos(1), y1.*max(abs(obj.NodeSizeLim)) + pos(2) + 4*sum(abs(obj.NodeSizeLim)), [1,1,1],'EdgeColor','k','LineWidth',1)
            plot(obj.ax, pos(1) + max(abs(obj.NodeSizeLim)) + [.1,.1], pos(2) + [0, 4*sum(abs(obj.NodeSizeLim))], 'LineWidth',1, 'Color','k')
            plot(obj.ax, pos(1) + max(abs(obj.NodeSizeLim)) + [.1,.2], pos(2) + [0, 0], 'LineWidth',1, 'Color','k')
            plot(obj.ax, pos(1) + max(abs(obj.NodeSizeLim)) + [.1,.2], pos(2) + [0, 0] + 4*sum(abs(obj.NodeSizeLim)), 'LineWidth',1, 'Color','k')
            text(obj.ax, pos(1) + max(abs(obj.NodeSizeLim)) + .22, pos(2) + 0, num2str(minN), 'FontSize',14,varargin{:})
            text(obj.ax, pos(1) + max(abs(obj.NodeSizeLim)) + .22, pos(2) + 4*sum(abs(obj.NodeSizeLim)), num2str(maxN), 'FontSize',14,varargin{:})
        end
        function edgeLegend(obj, varargin)
            if nargin < 2
                pos = [-.5, size(obj.dataMat, 1)/2 *.5];
            elseif isnumeric(varargin{1})
                pos = varargin{1};
                varargin(1) = [];
            end
            x2 = [-1, -1, 1, 1];
            y2 = [-1, 1, 1, -1];
            minE = min(obj.dataMat(eye(size(obj.dataMat)) == 0 & obj.dataMat ~= 0));
            maxE = max(obj.dataMat(eye(size(obj.dataMat)) == 0 & obj.dataMat ~= 0));
            fill(obj.ax, x2.*min(abs(obj.EdgeWidthLim)) + pos(1), y2.*min(abs(obj.EdgeWidthLim)) + pos(2), [1,1,1],'EdgeColor','k','LineWidth',1)
            fill(obj.ax, x2.*mean(abs(obj.EdgeWidthLim)) + pos(1), y2.*mean(abs(obj.EdgeWidthLim)) + pos(2) + 2*sum(abs(obj.EdgeWidthLim)), [1,1,1],'EdgeColor','k','LineWidth',1)
            fill(obj.ax, x2.*max(abs(obj.EdgeWidthLim)) + pos(1), y2.*max(abs(obj.EdgeWidthLim)) + pos(2) + 4*sum(abs(obj.EdgeWidthLim)), [1,1,1],'EdgeColor','k','LineWidth',1)
            plot(obj.ax, pos(1) + max(abs(obj.EdgeWidthLim)) + [.1,.1], pos(2) + [0, 4*sum(abs(obj.EdgeWidthLim))], 'LineWidth',1, 'Color','k')
            plot(obj.ax, pos(1) + max(abs(obj.EdgeWidthLim)) + [.1,.2], pos(2) + [0, 0], 'LineWidth',1, 'Color','k')
            plot(obj.ax, pos(1) + max(abs(obj.EdgeWidthLim)) + [.1,.2], pos(2) + [0, 0] + 4*sum(abs(obj.EdgeWidthLim)), 'LineWidth',1, 'Color','k')
            text(obj.ax, pos(1) + max(abs(obj.EdgeWidthLim)) + .22, pos(2) + 0, num2str(minE), 'FontSize',14,varargin{:})
            text(obj.ax, pos(1) + max(abs(obj.EdgeWidthLim)) + .22, pos(2) + 4*sum(abs(obj.EdgeWidthLim)), num2str(maxE), 'FontSize',14,varargin{:})
        end
    end
end