前言:性能优化的本质
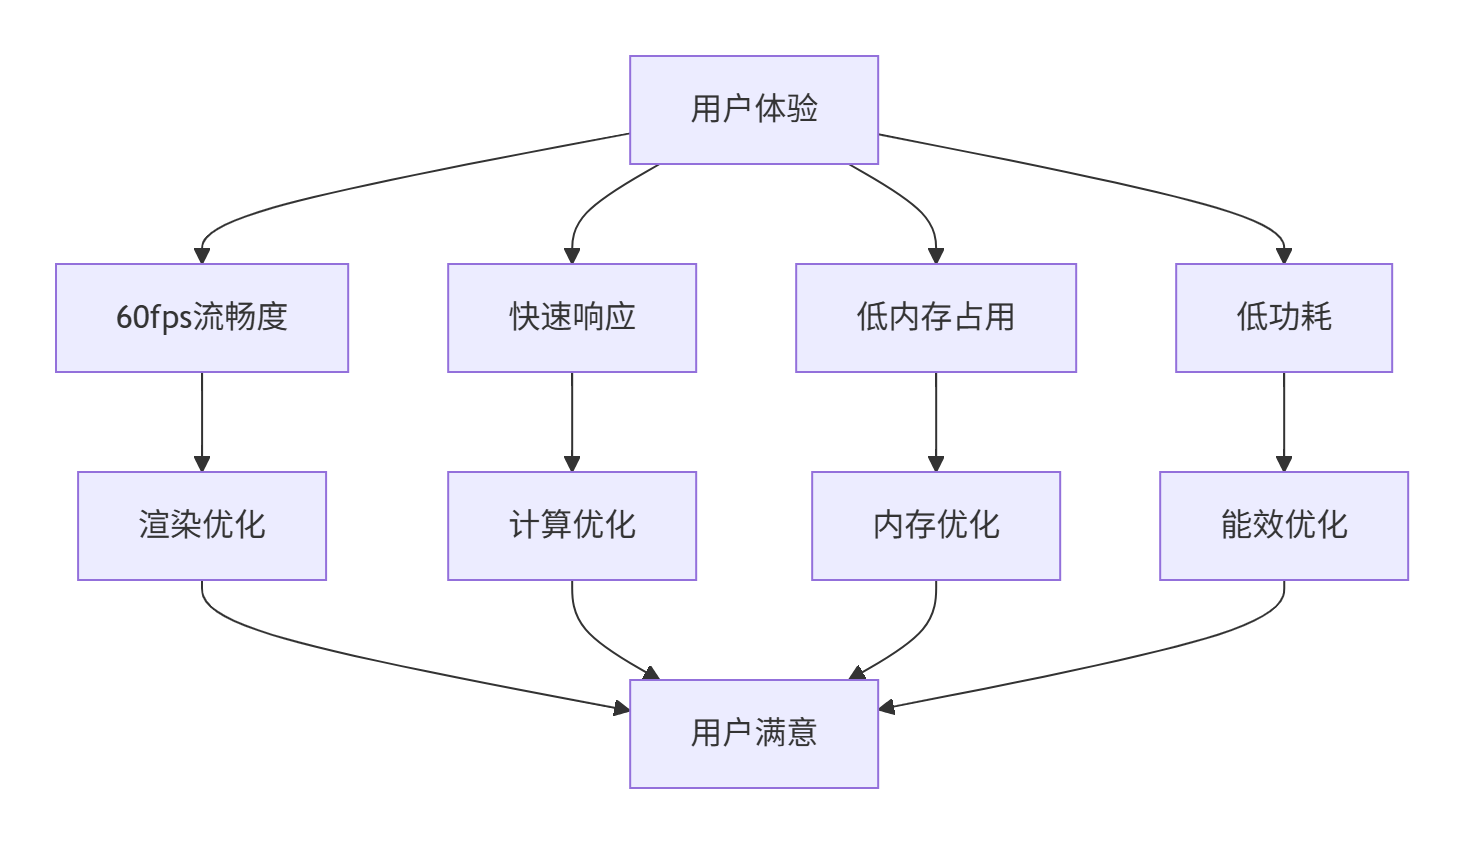
在前几篇中,我们学习了QML的核心语法、动画、组件化、数据集成、架构模式和状态管理。现在,我们来探讨一个至关重要的话题:性能优化。在GUI应用开发中,性能不是可有可无的附加特性,而是直接影响用户体验的核心要素。
本篇学习目标
通过本篇学习,你将能够:
-
深入理解QML渲染管线和性能瓶颈
-
掌握性能分析工具的使用方法和技巧
-
识别和解决常见的性能问题
-
优化渲染性能、内存使用和计算效率
-
掌握启动优化和懒加载技术
-
实现高效的大数据列表和表格
-
理解和避免内存泄漏
-
在实际项目中应用性能优化策略
性能优化基础
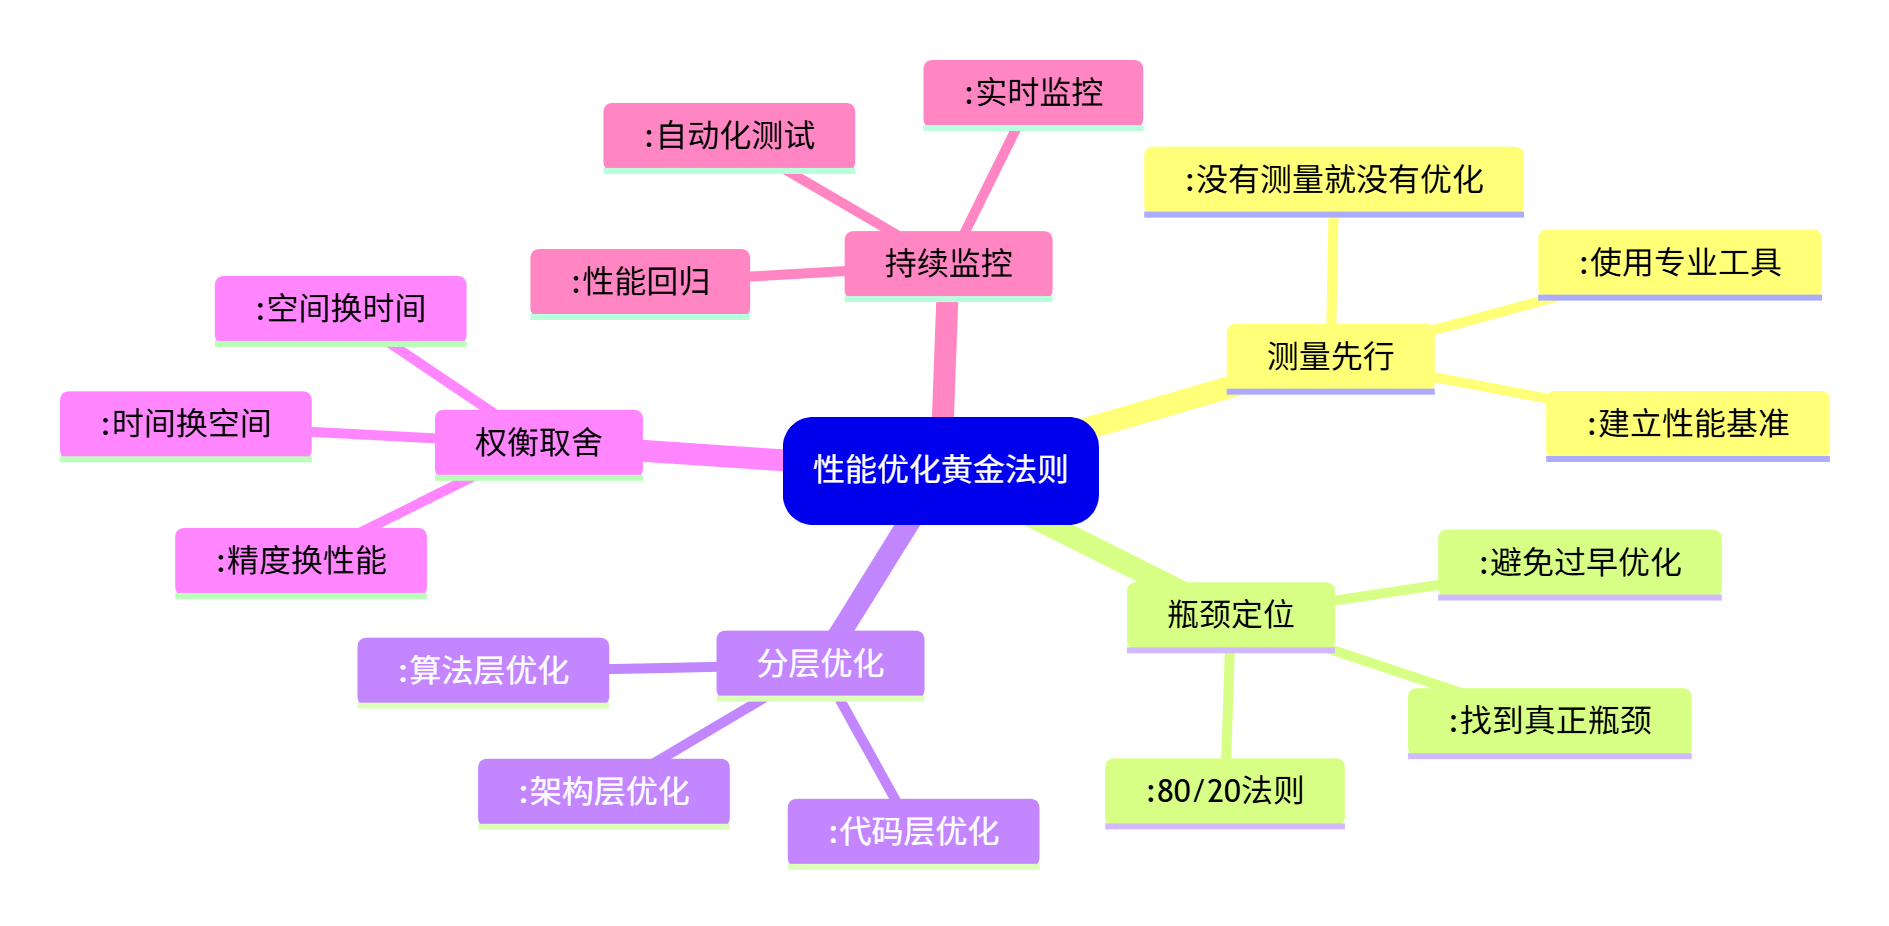
1.1 性能优化的黄金法则
在深入具体技术之前,先理解性能优化的基本原则:
1.2 性能指标理解
让我们先理解几个关键性能指标:
python
# performance_metrics.py
"""
性能指标解析:
1. FPS (Frames Per Second): 帧率,60fps是流畅标准
2. 帧时间: 每帧渲染时间,16.7ms是60fps的目标
3. 内存使用: 包括堆内存、栈内存、GPU内存
4. CPU使用率: 主线程和渲染线程的CPU占用
5. 启动时间: 从启动到可交互的时间
"""

class PerformanceMetrics:
    """性能指标监控器"""

    def __init__(self):
        self.metrics = {
            "fps": 0,           # 当前帧率
            "frame_time": 0,    # 帧时间(ms)
            "memory_used": 0,   # 内存使用(MB)
            "cpu_usage": 0,     # CPU使用率(%)
            "draw_calls": 0,    # 绘制调用次数
            "texture_memory": 0, # 纹理内存(MB)
        }

    def print_report(self):
        """打印性能报告"""
        report = """
性能报告:
===========
帧率(FPS): {fps}
帧时间: {frame_time:.1f}ms
内存使用: {memory_used:.1f}MB
CPU使用率: {cpu_usage:.1f}%
绘制调用: {draw_calls}
纹理内存: {texture_memory:.1f}MB
===========
""".format(**self.metrics)
        print(report)

    def get_grade(self):
        """性能评级"""
        if self.metrics["fps"] >= 60:
            return "优秀"
        elif self.metrics["fps"] >= 30:
            return "良好"
        else:
            return "需要优化"
渲染性能优化
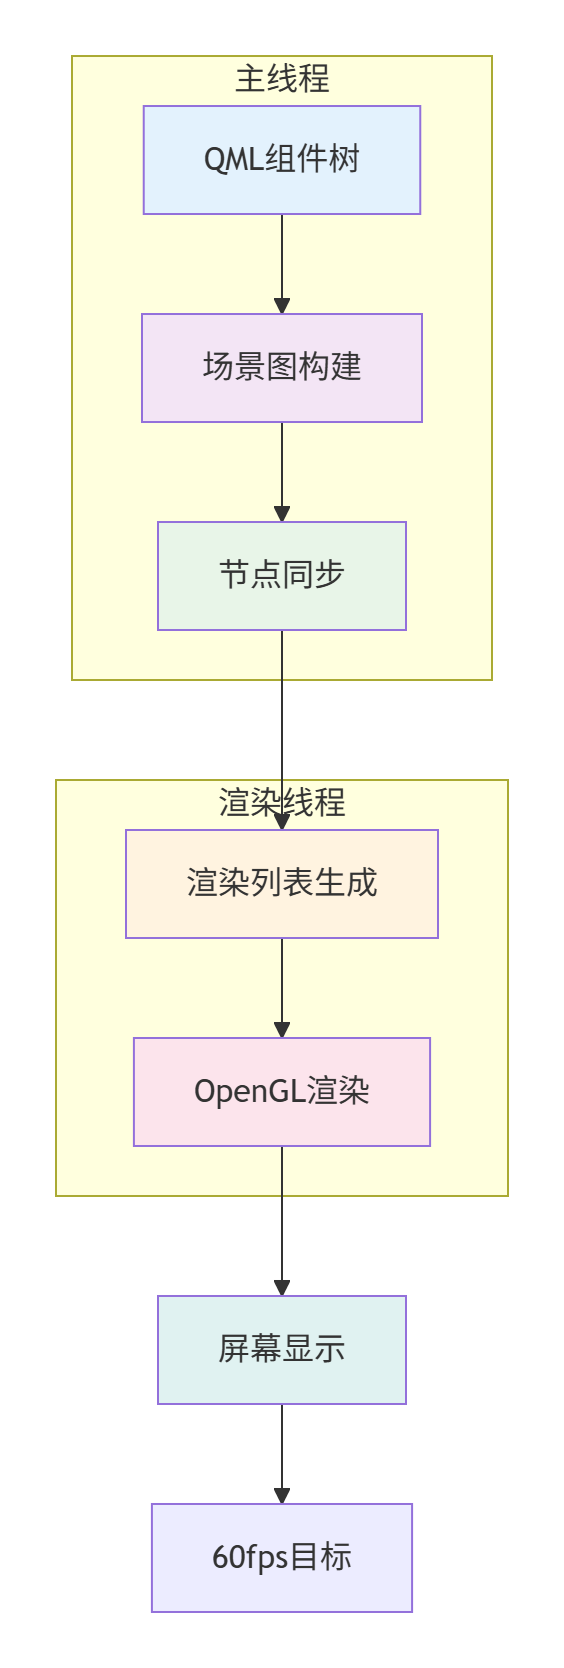
2.1 理解QML渲染管线
QML的渲染过程涉及多个阶段,理解这些阶段有助于定位性能瓶颈:
2.2 渲染优化实战
让我们通过一个简单的例子来理解渲染优化:
javascript
// RenderingDemo.qml
import QtQuick
import QtQuick.Controls
Window {
width: 800
height: 600
visible: true
title: "渲染性能优化演示"
// 性能监视器
Rectangle {
x: 10
y: 10
width: 200
height: 100
color: "#22000000"
radius: 5
Column {
anchors.centerIn: parent
spacing: 5
Text {
text: "FPS: " + fpsCounter.fps.toFixed(1)
color: "white"
font.bold: true
}
Text {
text: "帧时间: " + fpsCounter.frameTime.toFixed(1) + "ms"
color: fpsCounter.frameTime > 16.7 ? "red" : "lightgreen"
}
Text {
text: "矩形数量: " + rectRepeater.count
color: "white"
}
}
}
// 控制面板
Column {
x: 10
y: 120
spacing: 10
Button {
text: "添加10个矩形"
onClicked: addRectangles(10)
}
Button {
text: "添加100个矩形"
onClicked: addRectangles(100)
}
Button {
text: "清空矩形"
onClicked: rectRepeater.model = 0
}
CheckBox {
id: animationCheck
text: "启用动画"
checked: true
}
CheckBox {
id: opacityCheck
text: "启用半透明"
checked: false
}
CheckBox {
id: shadowCheck
text: "启用阴影"
checked: false
}
}
// 矩形容器
Item {
anchors.fill: parent
anchors.margins: 50
Repeater {
id: rectRepeater
model: 0
delegate: Rectangle {
id: rectDelegate
width: 50
height: 50
color: Qt.rgba(Math.random(), Math.random(), Math.random(), opacityCheck.checked ? 0.7 : 1.0)
x: Math.random() * (parent.width - width)
y: Math.random() * (parent.height - height)
// 阴影效果(性能开销大)
layer.enabled: shadowCheck.checked
layer.effect: shadowCheck.checked ? shadowEffect : null
// 动画
RotationAnimation on rotation {
running: animationCheck.checked
from: 0
to: 360
duration: 2000 + Math.random() * 3000
loops: Animation.Infinite
}
}
}
}
// 阴影效果
Component {
id: shadowEffect
DropShadow {
color: "#80000000"
radius: 8
samples: 16
}
}
// FPS计数器
Item {
id: fpsCounter
property real fps: 0
property real frameTime: 0
property int frameCount: 0
property real lastTime: Date.now()
Timer {
interval: 1000 / 60
running: true
repeat: true
onTriggered: {
var currentTime = Date.now()
frameTime = currentTime - lastTime
lastTime = currentTime
frameCount++
}
}
Timer {
interval: 1000
running: true
repeat: true
onTriggered: {
fps = frameCount
frameCount = 0
}
}
}
function addRectangles(count) {
var current = rectRepeater.model
rectRepeater.model = current + count
}
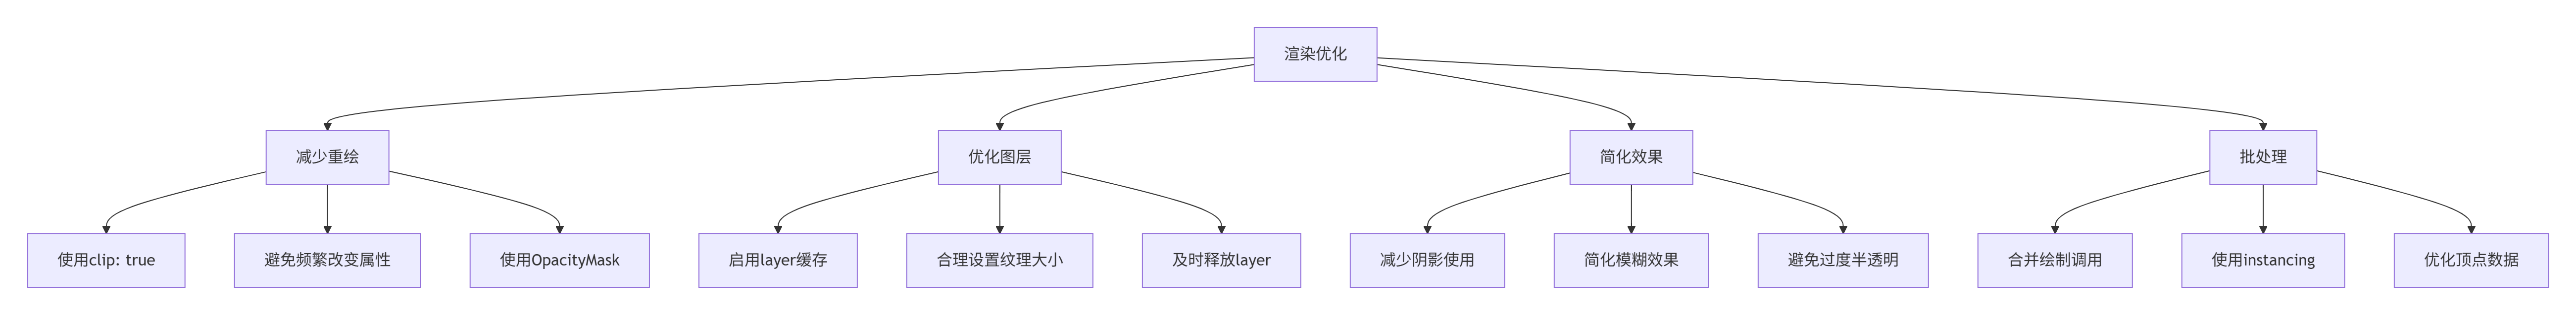
}渲染优化检查清单:
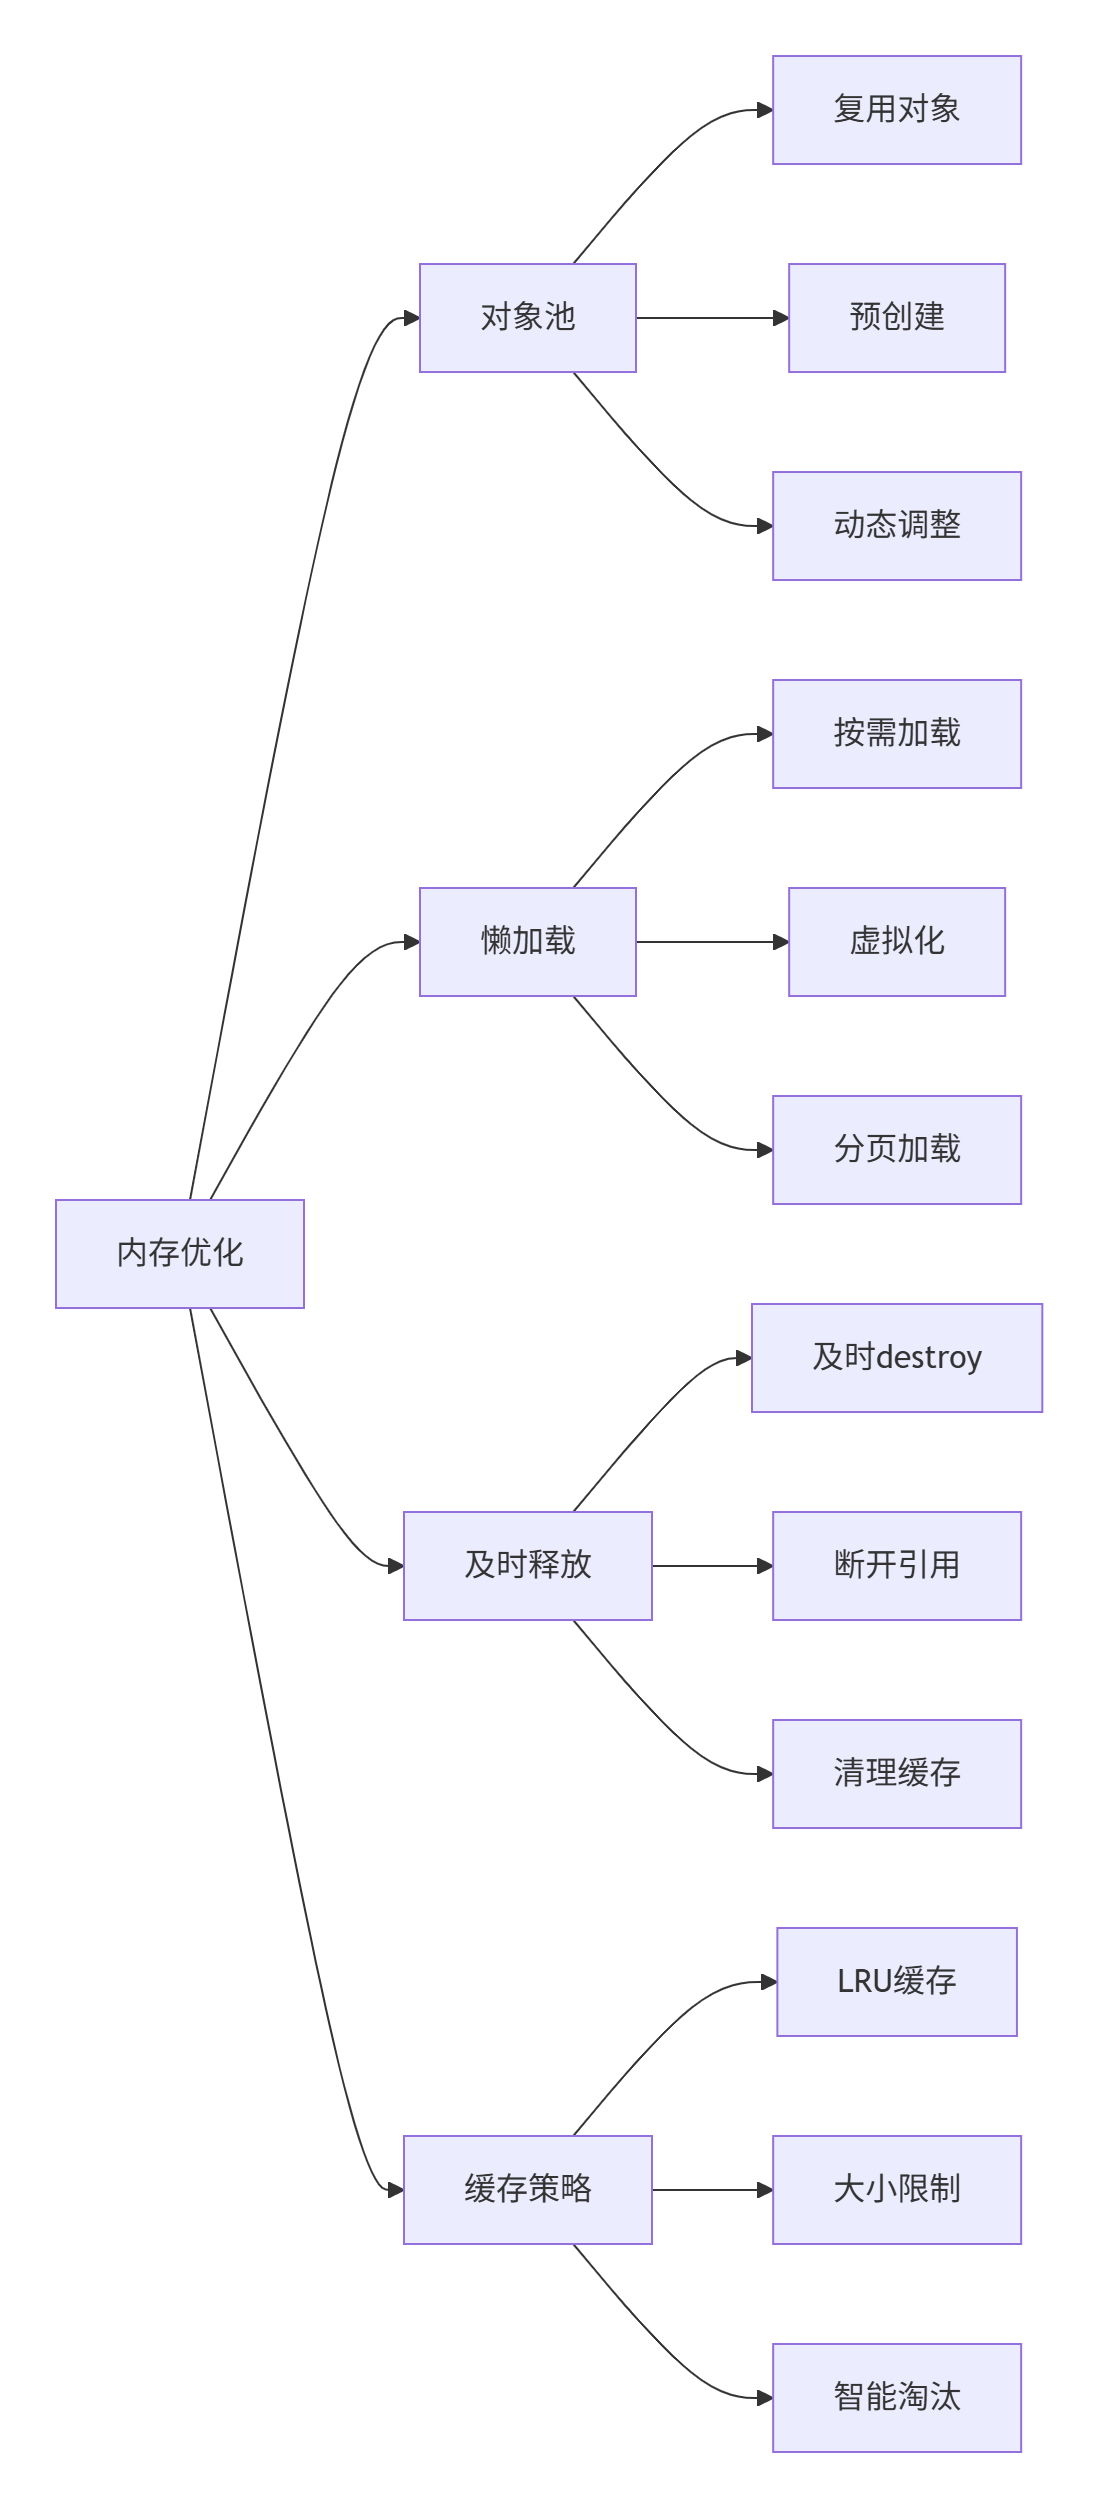
内存优化
3.1 内存管理基础
QML应用中的内存管理需要特别注意:
javascript
// MemoryManagement.qml
import QtQuick
import QtQuick.Controls

Window {
    width: 600
    height: 400
    visible: true
    title: "内存管理演示"

    // 内存监视器
    Rectangle {
        anchors.top: parent.top
        anchors.left: parent.left
        anchors.margins: 10
        width: 200
        height: 120
        color: "#22000000"
        radius: 5

        Column {
            anchors.centerIn: parent
            spacing: 5

            Text {
                text: "内存使用: " + memoryMonitor.memoryUsed.toFixed(1) + " MB"
                color: "white"
            }

            Text {
                text: "对象数量: " + objectCounter.count
                color: "white"
            }

            Text {
                text: "状态: " + memoryMonitor.status
                color: memoryMonitor.status === "正常" ? "lightgreen" : "orange"
            }
        }
    }

    // 控制面板
    Column {
        anchors.top: parent.top
        anchors.right: parent.right
        anchors.margins: 10
        spacing: 10

        Button {
            text: "创建简单对象"
            onClicked: createSimpleObjects(10)
        }

        Button {
            text: "创建图片对象"
            onClicked: createImageObjects(5)
        }

        Button {
            text: "创建泄漏对象"
            onClicked: createLeakingObjects(5)
        }

        Button {
            text: "清理所有对象"
            onClicked: clearAllObjects()
        }

        Button {
            text: "强制垃圾回收"
            onClicked: gc()
        }
    }

    // 对象容器
    Item {
        id: objectContainer
        anchors.fill: parent
        anchors.margins: 50
    }

    // 内存监视器组件
    QtObject {
        id: memoryMonitor

        property real memoryUsed: 0
        property string status: "正常"

        Timer {
            interval: 1000
            running: true
            repeat: true
            onTriggered: {
                // 模拟内存使用计算
                var baseMemory = 10.0 // 基础内存
                var objectMemory = objectCounter.count * 0.1
                var imageMemory = imageCounter.count * 2.0

                memoryUsed = baseMemory + objectMemory + imageMemory

                // 判断状态
                if (memoryUsed > 50) {
                    status = "警告"
                } else if (memoryUsed > 100) {
                    status = "危险"
                } else {
                    status = "正常"
                }
            }
        }
    }

    // 对象计数器
    QtObject {
        id: objectCounter
        property int count: 0
    }

    // 图片计数器
    QtObject {
        id: imageCounter
        property int count: 0
    }

    // 对象列表
    property var objectList: []
    property var imageList: []
    property var leakList: []

    // 创建简单对象
    function createSimpleObjects(count) {
        for (var i = 0; i < count; i++) {
            var obj = Qt.createQmlObject(`
                import QtQuick

                Rectangle {
                    width: 30
                    height: 30
                    color: "red"
                    x: ${Math.random() * 500}
                    y: ${Math.random() * 300}
                }
            `, objectContainer)

            objectList.push(obj)
            objectCounter.count++
        }
    }

    // 创建图片对象
    function createImageObjects(count) {
        for (var i = 0; i < count; i++) {
            var obj = Qt.createQmlObject(`
                import QtQuick

                Image {
                    width: 50
                    height: 50
                    source: "https://picsum.photos/50?random=${i}"
                    x: ${Math.random() * 500}
                    y: ${Math.random() * 300}
                }
            `, objectContainer)

            imageList.push(obj)
            imageCounter.count++
        }
    }

    // 创建泄漏对象(不添加到容器)
    function createLeakingObjects(count) {
        for (var i = 0; i < count; i++) {
            var obj = Qt.createQmlObject(`
                import QtQuick

                Rectangle {
                    width: 20
                    height: 20
                    color: "purple"
                }
            `, null)  // 注意:父对象为null,会造成内存泄漏!

            leakList.push(obj)
        }
    }

    // 清理所有对象
    function clearAllObjects() {
        // 正确清理:销毁对象
        for (var i = 0; i < objectList.length; i++) {
            if (objectList[i]) {
                objectList[i].destroy()
            }
        }

        for (var i = 0; i < imageList.length; i++) {
            if (imageList[i]) {
                imageList[i].destroy()
            }
        }

        // 尝试清理泄漏对象
        for (var i = 0; i < leakList.length; i++) {
            if (leakList[i]) {
                leakList[i].destroy()
            }
        }

        // 清空列表
        objectList = []
        imageList = []
        leakList = []

        // 重置计数器
        objectCounter.count = 0
        imageCounter.count = 0
    }

    // JavaScript垃圾回收
    function gc() {
        if (window.gc) {
            window.gc()
        } else {
            console.log("垃圾回收不可用")
        }
    }
}
内存管理策略:
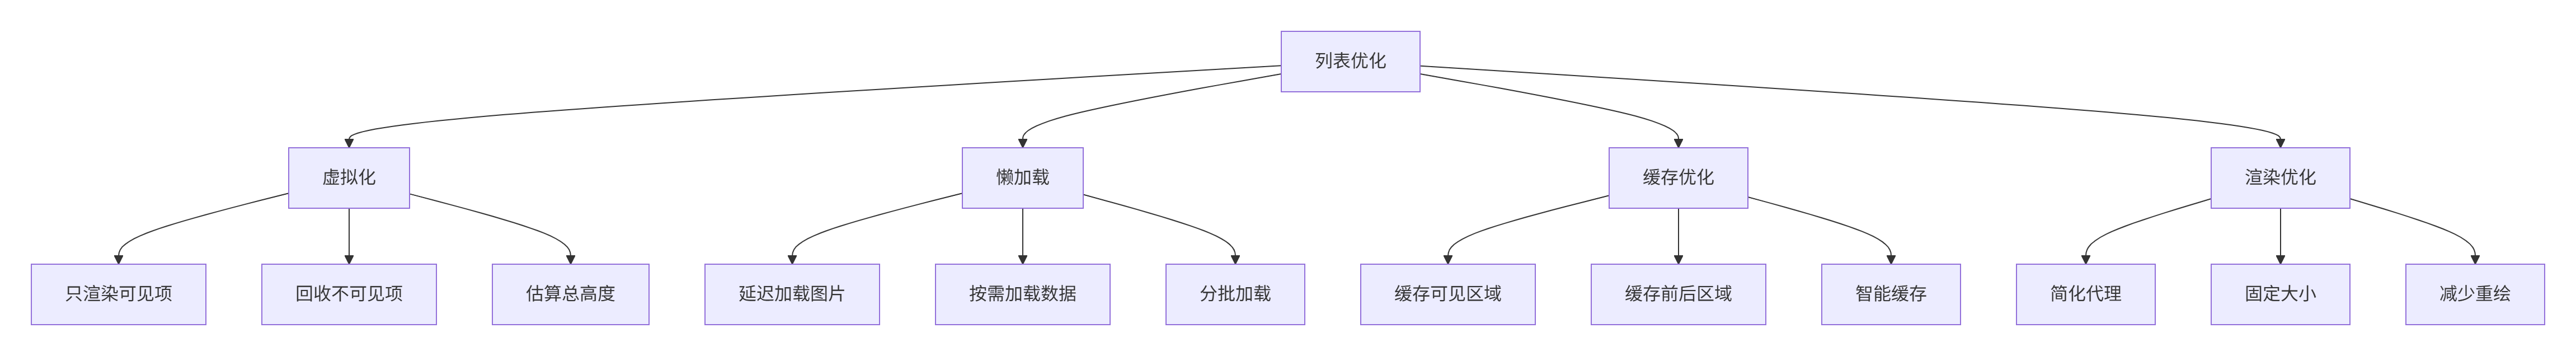
大数据列表优化
4.1 列表虚拟化原理
处理大量数据时,列表性能至关重要:
javascript
// OptimizedListView.qml
import QtQuick
import QtQuick.Controls

Window {
    width: 800
    height: 600
    visible: true
    title: "大数据列表优化演示"

    // 性能监视器
    Rectangle {
        anchors.top: parent.top
        anchors.left: parent.left
        anchors.margins: 10
        width: 250
        height: 150
        color: "#22000000"
        radius: 5

        Column {
            anchors.centerIn: parent
            spacing: 5

            Text {
                text: "总数据: " + dataModel.count.toLocaleString() + " 条"
                color: "white"
            }

            Text {
                text: "可见项: " + listView.visibleItemCount
                color: "white"
            }

            Text {
                text: "缓存项: " + listView.cachedItemCount
                color: "white"
            }

            Text {
                text: "FPS: " + fpsCounter.fps.toFixed(1)
                color: fpsCounter.fps >= 60 ? "lightgreen" :
                       fpsCounter.fps >= 30 ? "yellow" : "red"
            }

            Text {
                text: "滚动位置: " + listView.contentY.toFixed(0)
                color: "white"
            }
        }
    }

    // 控制面板
    Column {
        anchors.top: parent.top
        anchors.right: parent.right
        anchors.margins: 10
        spacing: 10

        Button {
            text: "加载1K数据"
            onClicked: loadData(1000)
        }

        Button {
            text: "加载10K数据"
            onClicked: loadData(10000)
        }

        Button {
            text: "加载100K数据"
            onClicked: loadData(100000)
        }

        Button {
            text: "清空数据"
            onClicked: dataModel.clear()
        }

        CheckBox {
            id: useOptimizedDelegate
            text: "使用优化代理"
            checked: true
        }

        CheckBox {
            id: useCacheBuffer
            text: "使用缓存缓冲"
            checked: true
        }

        Slider {
            id: cacheBufferSlider
            from: 0
            to: 1000
            value: 200
            stepSize: 50

            Text {
                anchors.bottom: parent.top
                anchors.horizontalCenter: parent.horizontalCenter
                text: "缓存大小: " + cacheBufferSlider.value
                color: "white"
            }
        }
    }

    // 数据模型
    ListModel {
        id: dataModel
    }

    // 优化的ListView
    ListView {
        id: listView
        anchors.fill: parent
        anchors.margins: 10
        anchors.topMargin: 160

        model: dataModel

        // 关键优化参数
        cacheBuffer: useCacheBuffer.checked ? cacheBufferSlider.value : 0

        // 计算可见项数量
        property int visibleItemCount: {
            if (!contentItem || height === 0) return 0
            return Math.ceil(height / 50) // 假设每项高度50
        }

        // 计算缓存项数量
        property int cachedItemCount: cacheBuffer / 50

        // 使用优化的代理
        delegate: useOptimizedDelegate.checked ? optimizedDelegate : simpleDelegate

        // 滚动指示器
        ScrollIndicator.vertical: ScrollIndicator {}

        // 空状态
        Label {
            visible: listView.count === 0
            text: "没有数据\n点击上方按钮加载数据"
            anchors.centerIn: parent
            horizontalAlignment: Text.AlignHCenter
            color: "gray"
        }
    }

    // 简单的代理(性能较差)
    Component {
        id: simpleDelegate

        Rectangle {
            width: listView.width
            height: 50

            // 交替背景色
            color: index % 2 ? "#f5f5f5" : "#ffffff"

            // 复杂布局
            Row {
                anchors.fill: parent
                anchors.margins: 5
                spacing: 10

                // 圆形头像
                Rectangle {
                    width: 40
                    height: 40
                    radius: 20
                    color: "#" + model.color

                    Text {
                        text: model.name.charAt(0)
                        anchors.centerIn: parent
                        color: "white"
                        font.bold: true
                        font.pixelSize: 18
                    }
                }

                // 详细信息
                Column {
                    spacing: 2

                    Text {
                        text: model.name
                        font.pixelSize: 16
                        font.bold: true
                    }

                    Text {
                        text: "ID: " + model.id + " | 值: " + model.value
                        color: "#666"
                        font.pixelSize: 12
                    }

                    // 进度条
                    Rectangle {
                        width: 200
                        height: 6
                        radius: 3
                        color: "#e0e0e0"

                        Rectangle {
                            width: parent.width * (model.value / 100)
                            height: parent.height
                            radius: parent.radius
                            color: "#4CAF50"
                        }
                    }
                }
            }
        }
    }

    // 优化的代理
    Component {
        id: optimizedDelegate

        Item {
            id: delegateItem
            width: listView.width
            height: 50

            // 1. 使用Loader延迟加载复杂部分
            Loader {
                id: contentLoader
                anchors.fill: parent
                sourceComponent: delegateContent
                active: delegateItem.ListView.isCurrentItem ||
                       delegateItem.ListView.view.isItemVisible(delegateItem)
            }

            // 2. 占位符
            Rectangle {
                visible: !contentLoader.active
                anchors.fill: parent
                color: index % 2 ? "#f5f5f5" : "#ffffff"
            }
        }
    }

    // 代理内容组件
    Component {
        id: delegateContent

        Rectangle {
            width: delegateItem.width
            height: delegateItem.height

            // 交替背景色
            color: index % 2 ? "#f5f5f5" : "#ffffff"

            // 优化后的布局
            Row {
                anchors.fill: parent
                anchors.margins: 5
                spacing: 10

                // 优化1: 使用固定大小的矩形代替圆形
                Rectangle {
                    width: 40
                    height: 40
                    color: "#" + model.color

                    Text {
                        text: model.name.charAt(0)
                        anchors.centerIn: parent
                        color: "white"
                        font.bold: true
                        font.pixelSize: 18
                    }
                }

                // 优化2: 简化布局
                Column {
                    width: parent.width - 60
                    spacing: 2

                    Text {
                        text: model.name
                        font.pixelSize: 16
                        font.bold: true
                        elide: Text.ElideRight
                        width: parent.width
                    }

                    Text {
                        text: "值: " + model.value
                        color: "#666"
                        font.pixelSize: 12
                    }

                    // 优化3: 只在需要时显示进度条
                    Rectangle {
                        visible: model.value < 30
                        width: parent.width
                        height: 4
                        radius: 2
                        color: "#e0e0e0"

                        Rectangle {
                            width: parent.width * (model.value / 100)
                            height: parent.height
                            radius: parent.radius
                            color: model.value < 20 ? "#F44336" : "#FF9800"
                        }
                    }
                }
            }
        }
    }

    // 判断项是否可见
    function isItemVisible(item) {
        if (!item || !listView.contentItem) return false

        var itemTop = listView.contentItem.mapFromItem(item, 0, 0).y
        var itemBottom = itemTop + item.height

        return itemBottom >= 0 && itemTop <= listView.height
    }

    // 加载测试数据
    function loadData(count) {
        dataModel.clear()

        console.time("加载数据")

        // 分批次加载避免阻塞UI
        var batchSize = 1000
        var loaded = 0

        function loadBatch() {
            var end = Math.min(loaded + batchSize, count)

            for (var i = loaded; i < end; i++) {
                dataModel.append({
                    id: i + 1,
                    name: "项目 " + (i + 1),
                    value: Math.random() * 100,
                    color: Math.floor(Math.random() * 0xFFFFFF).toString(16).padStart(6, '0')
                })
            }

            loaded = end

            if (loaded < count) {
                // 使用requestAnimationFrame继续加载
                requestAnimationFrame(loadBatch)
            } else {
                console.timeEnd("加载数据")
            }
        }

        loadBatch()
    }

    // FPS计数器
    QtObject {
        id: fpsCounter
        property real fps: 0
        property int frameCount: 0

        Timer {
            interval: 1000
            running: true
            repeat: true
            onTriggered: {
                fps = frameCount
                frameCount = 0
            }
        }
    }

    // 帧计数器
    Timer {
        interval: 16 // ~60fps
        running: true
        repeat: true
        onTriggered: fpsCounter.frameCount++
    }
}
列表优化策略总结:
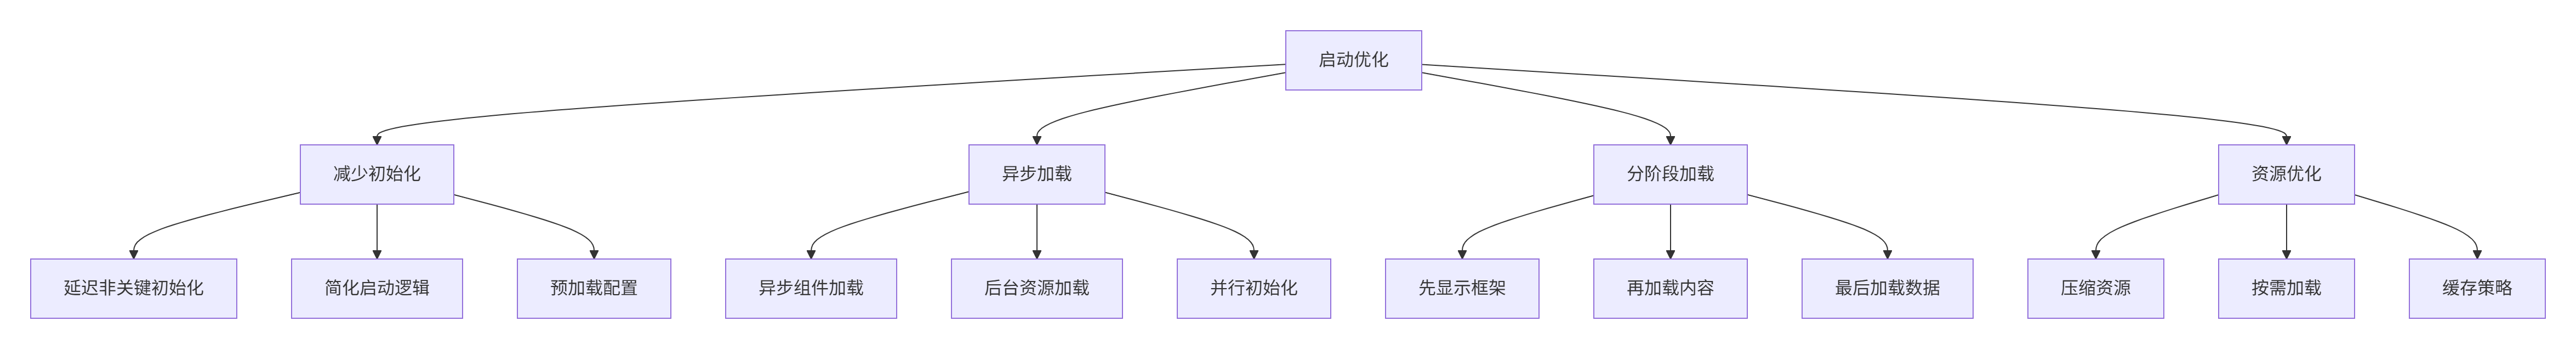
启动性能优化
5.1 启动过程分析
应用启动性能直接影响用户体验:
python
// StartupOptimization.qml
import QtQuick
import QtQuick.Controls

ApplicationWindow {
    id: mainWindow
    width: 800
    height: 600
    visible: true
    title: "启动性能优化演示"

    // 启动时间记录
    property var startupTimeline: ({})
    property real startupTime: 0

    // 启动画面
    Loader {
        id: splashLoader
        anchors.fill: parent
        source: "SplashScreen.qml"
        active: true

        onLoaded: {
            recordTime("splashLoaded")
        }
    }

    // 主内容
    Loader {
        id: mainLoader
        anchors.fill: parent
        asynchronous: true
        active: false
        source: "MainContent.qml"

        onLoaded: {
            recordTime("mainContentLoaded")
            splashLoader.active = false
            calculateStartupTime()
        }

        onProgressChanged: {
            if (progress > 0) {
                recordTime("mainContentStartLoading")
            }
        }
    }

    // 启动时间线
    Component.onCompleted: {
        recordTime("appStart")

        // 延迟加载主内容
        setTimeout(function() {
            mainLoader.active = true
        }, 100)
    }

    // 记录时间点
    function recordTime(event) {
        startupTimeline[event] = Date.now()
        console.log(event + ": " + startupTimeline[event])
    }

    // 计算启动时间
    function calculateStartupTime() {
        var start = startupTimeline["appStart"]
        var end = startupTimeline["mainContentLoaded"]

        if (start && end) {
            startupTime = end - start
            console.log("总启动时间: " + startupTime + "ms")
        }
    }

    // 启动分析报告
    Component {
        id: startupReport

        Rectangle {
            color: "#22000000"
            radius: 10
            width: 300
            height: 200

            Column {
                anchors.centerIn: parent
                spacing: 10

                Text {
                    text: "启动分析报告"
                    font.bold: true
                    font.pixelSize: 18
                    color: "white"
                }

                Text {
                    text: "总时间: " + startupTime + "ms"
                    color: startupTime < 1000 ? "lightgreen" :
                           startupTime < 3000 ? "yellow" : "red"
                }

                Repeater {
                    model: Object.keys(startupTimeline)

                    Text {
                        text: modelData + ": " +
                              (startupTimeline[modelData] - startupTimeline["appStart"]) + "ms"
                        color: "white"
                        font.pixelSize: 12
                    }
                }
            }
        }
    }
}
启动优化策略:
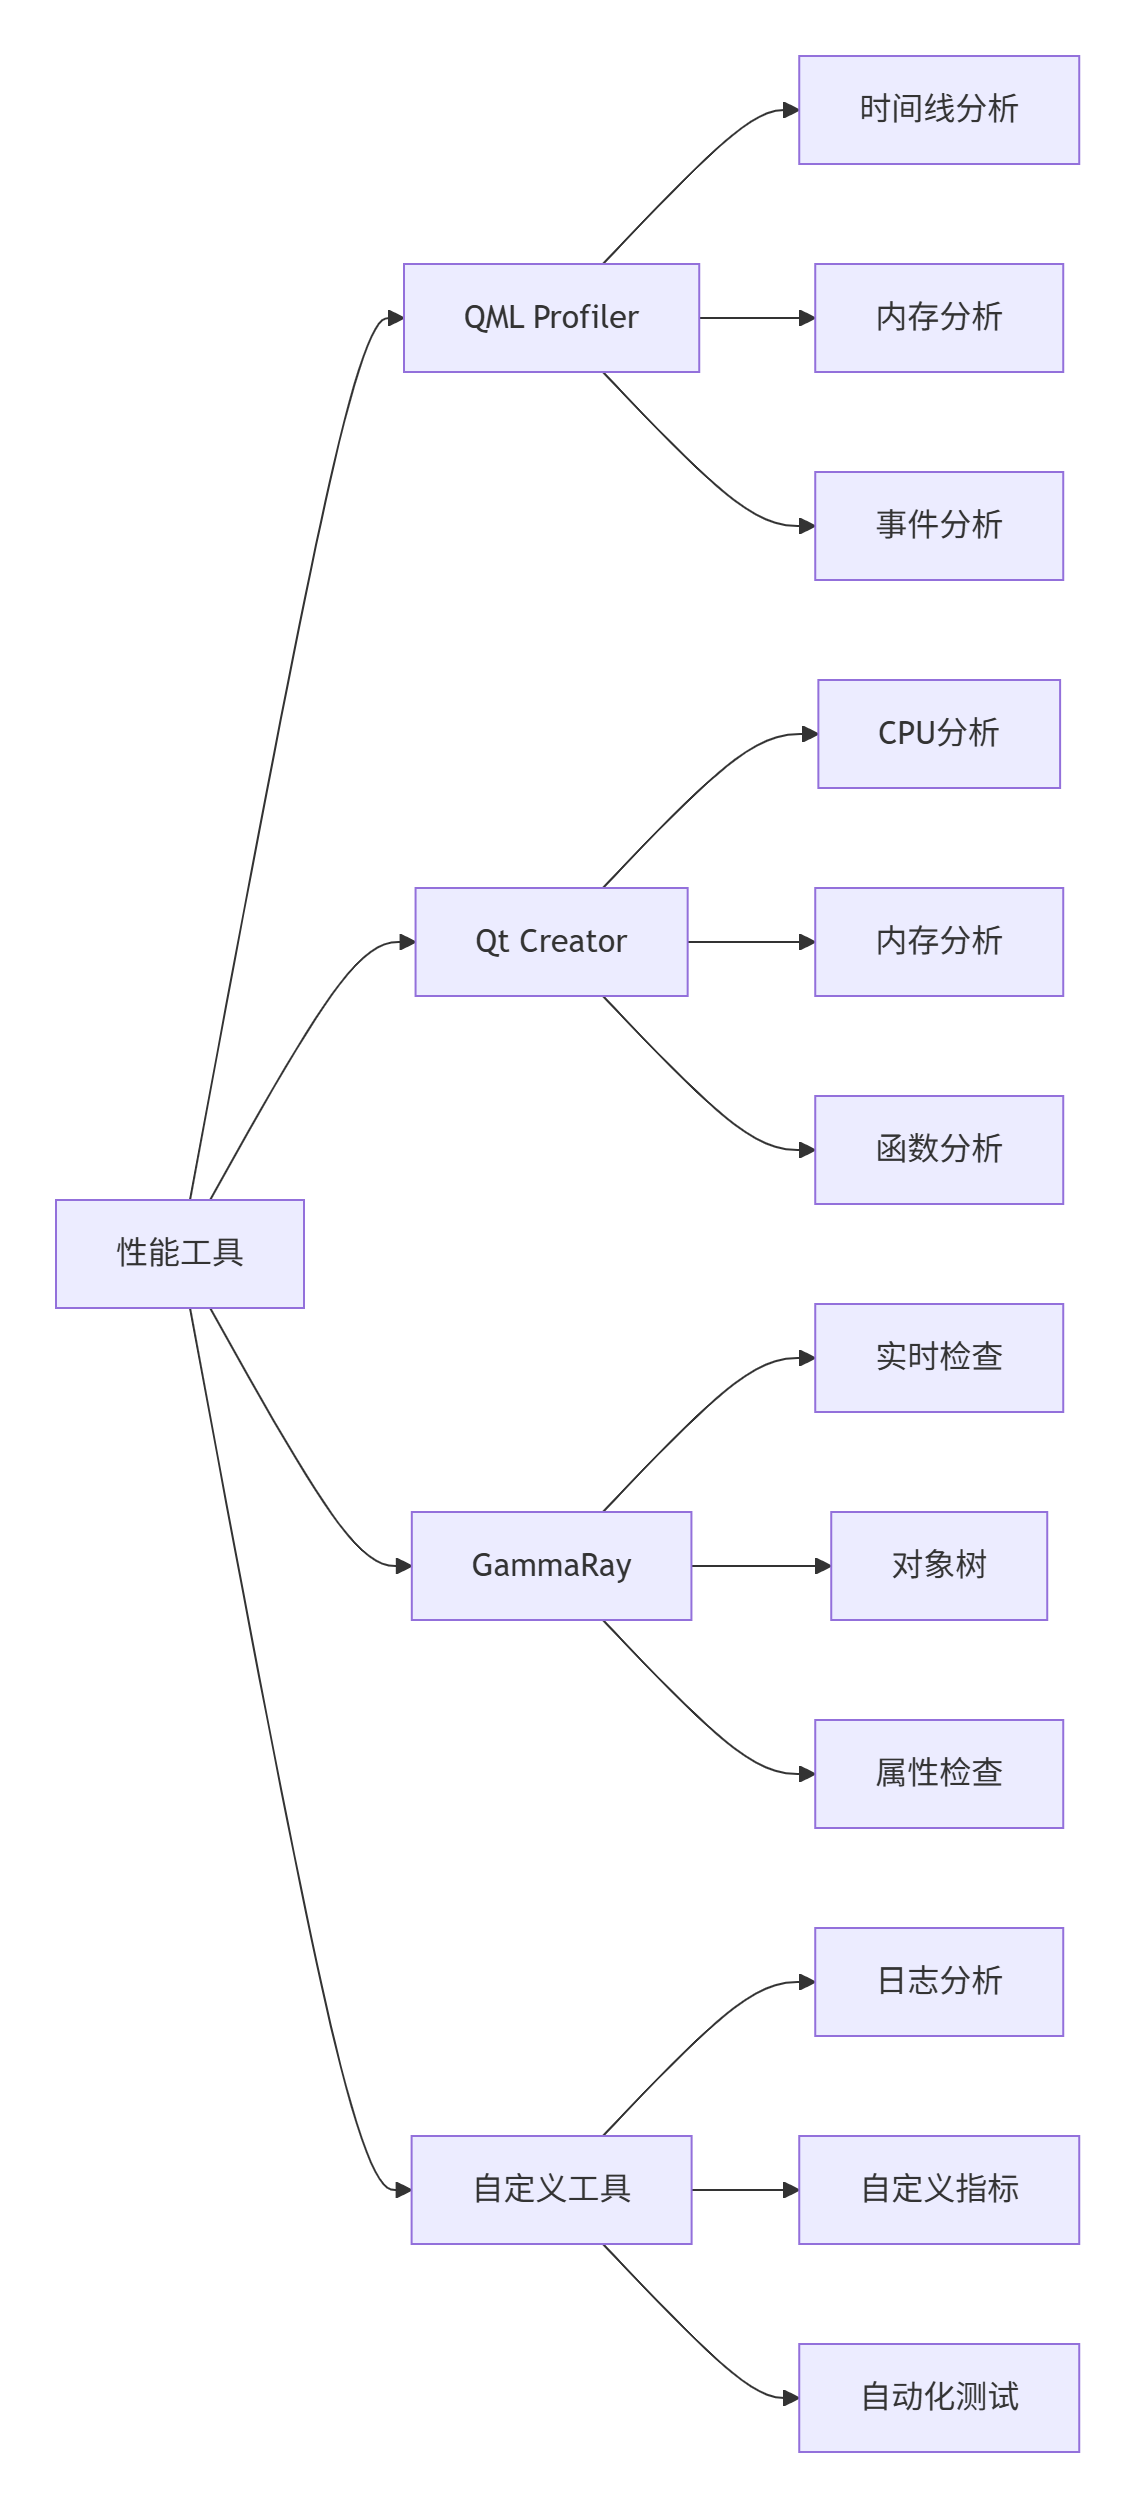
性能分析工具
6.1 使用QML Profiler
QML Profiler是Qt自带的性能分析工具:
javascript
// ProfilerDemo.qml
import QtQuick
import QtQuick.Controls

Window {
    width: 800
    height: 600
    visible: true
    title: "性能分析工具演示"

    // 性能测试场景
    TabBar {
        id: tabBar
        width: parent.width

        TabButton { text: "渲染测试" }
        TabButton { text: "内存测试" }
        TabButton { text: "计算测试" }
    }

    StackLayout {
        anchors.top: tabBar.bottom
        anchors.bottom: parent.bottom
        width: parent.width
        currentIndex: tabBar.currentIndex

        // 场景1: 渲染测试
        Item {
            Repeater {
                model: 100

                Rectangle {
                    width: 50
                    height: 50
                    color: Qt.rgba(Math.random(), Math.random(), Math.random(), 0.7)
                    x: Math.random() * 750
                    y: Math.random() * 550

                    RotationAnimation on rotation {
                        running: true
                        from: 0
                        to: 360
                        duration: 2000 + Math.random() * 3000
                        loops: Animation.Infinite
                    }
                }
            }
        }

        // 场景2: 内存测试
        Column {
            spacing: 10
            padding: 20

            Button {
                text: "分配内存"
                onClicked: allocateMemory()
            }

            Button {
                text: "释放内存"
                onClicked: releaseMemory()
            }

            Button {
                text: "创建泄漏"
                onClicked: createMemoryLeak()
            }
        }

        // 场景3: 计算测试
        Column {
            spacing: 10
            padding: 20

            Button {
                text: "执行耗时计算"
                onClicked: performHeavyComputation()
            }

            Button {
                text: "执行优化计算"
                onClicked: performOptimizedComputation()
            }
        }
    }

    // 内存分配函数
    function allocateMemory() {
        var data = []
        for (var i = 0; i < 1000000; i++) {
            data.push({
                id: i,
                value: Math.random(),
                timestamp: Date.now()
            })
        }
        console.log("分配了", data.length, "个对象")
    }

    // 内存释放函数
    function releaseMemory() {
        // 触发垃圾回收
        gc()
        console.log("尝试释放内存")
    }

    // 创建内存泄漏
    function createMemoryLeak() {
        // 故意创建循环引用
        var obj1 = {}
        var obj2 = { ref: obj1 }
        obj1.ref = obj2

        window.leak = obj1
        console.log("创建了内存泄漏")
    }

    // 耗时计算
    function performHeavyComputation() {
        console.time("heavyComputation")

        var result = 0
        for (var i = 0; i < 10000000; i++) {
            result += Math.sin(i) * Math.cos(i)
        }

        console.timeEnd("heavyComputation")
        console.log("结果:", result)
    }

    // 优化计算
    function performOptimizedComputation() {
        console.time("optimizedComputation")

        // 使用缓存结果
        var cache = {}
        var result = 0

        for (var i = 0; i < 1000000; i++) {
            var key = i % 1000
            if (!cache[key]) {
                cache[key] = Math.sin(key) * Math.cos(key)
            }
            result += cache[key]
        }

        console.timeEnd("optimizedComputation")
        console.log("结果:", result)
    }
}
性能分析工具对比:
实战:性能优化检查清单
7.1 优化检查清单
在实际项目中,使用这个检查清单来确保性能:
javascript
// OptimizationChecklist.qml
import QtQuick
import QtQuick.Controls

Window {
    width: 600
    height: 800
    visible: true
    title: "性能优化检查清单"

    ScrollView {
        anchors.fill: parent

        Column {
            width: parent.width
            spacing: 20
            padding: 20

            // 渲染优化
            GroupBox {
                title: "✅ 渲染优化"
                width: parent.width

                Column {
                    spacing: 10
                    width: parent.width

                    CheckBox {
                        text: "使用clip: true限制绘制区域"
                        checked: true
                    }

                    CheckBox {
                        text: "避免不必要的半透明效果"
                        checked: true
                    }

                    CheckBox {
                        text: "简化阴影和模糊效果"
                        checked: true
                    }

                    CheckBox {
                        text: "使用layer.enabled合理缓存"
                        checked: true
                    }

                    CheckBox {
                        text: "避免频繁的属性变化"
                        checked: true
                    }
                }
            }

            // 内存优化
            GroupBox {
                title: "✅ 内存优化"
                width: parent.width

                Column {
                    spacing: 10
                    width: parent.width

                    CheckBox {
                        text: "及时销毁不需要的对象"
                        checked: true
                    }

                    CheckBox {
                        text: "使用Loader延迟加载"
                        checked: true
                    }

                    CheckBox {
                        text: "优化图片资源大小"
                        checked: true
                    }

                    CheckBox {
                        text: "避免循环引用"
                        checked: true
                    }

                    CheckBox {
                        text: "监控内存使用趋势"
                        checked: true
                    }
                }
            }

            // 列表优化
            GroupBox {
                title: "✅ 列表优化"
                width: parent.width

                Column {
                    spacing: 10
                    width: parent.width

                    CheckBox {
                        text: "使用cacheBuffer缓存项"
                        checked: true
                    }

                    CheckBox {
                        text: "简化代理组件"
                        checked: true
                    }

                    CheckBox {
                        text: "固定项高度"
                        checked: true
                    }

                    CheckBox {
                        text: "虚拟化长列表"
                        checked: true
                    }

                    CheckBox {
                        text: "分批加载数据"
                        checked: true
                    }
                }
            }

            // 启动优化
            GroupBox {
                title: "✅ 启动优化"
                width: parent.width

                Column {
                    spacing: 10
                    width: parent.width

                    CheckBox {
                        text: "使用启动画面"
                        checked: true
                    }

                    CheckBox {
                        text: "异步加载资源"
                        checked: true
                    }

                    CheckBox {
                        text: "延迟非关键初始化"
                        checked: true
                    }

                    CheckBox {
                        text: "压缩资源文件"
                        checked: true
                    }

                    CheckBox {
                        text: "监控启动时间"
                        checked: true
                    }
                }
            }

            // 计算优化
            GroupBox {
                title: "✅ 计算优化"
                width: parent.width

                Column {
                    spacing: 10
                    width: parent.width

                    CheckBox {
                        text: "避免在渲染循环中计算"
                        checked: true
                    }

                    CheckBox {
                        text: "使用WorkerScript处理耗时任务"
                        checked: true
                    }

                    CheckBox {
                        text: "缓存计算结果"
                        checked: true
                    }

                    CheckBox {
                        text: "优化算法复杂度"
                        checked: true
                    }

                    CheckBox {
                        text: "使用requestAnimationFrame"
                        checked: true
                    }
                }
            }

            // 性能监控
            GroupBox {
                title: "✅ 性能监控"
                width: parent.width

                Column {
                    spacing: 10
                    width: parent.width

                    CheckBox {
                        text: "集成性能监控工具"
                        checked: true
                    }

                    CheckBox {
                        text: "设置性能预算"
                        checked: true
                    }

                    CheckBox {
                        text: "自动化性能测试"
                        checked: true
                    }

                    CheckBox {
                        text: "监控生产环境性能"
                        checked: true
                    }

                    CheckBox {
                        text: "建立性能回归测试"
                        checked: true
                    }
                }
            }

            // 总结
            Rectangle {
                width: parent.width
                height: 100
                color: "#f5f5f5"
                radius: 5

                Column {
                    anchors.centerIn: parent
                    spacing: 5

                    Text {
                        text: "性能优化是持续的过程"
                        font.bold: true
                        font.pixelSize: 16
                    }

                    Text {
                        text: "定期检查 | 测量对比 | 持续改进"
                        color: "#666"
                        font.pixelSize: 12
                    }
                }
            }
        }
    }
}
总结
性能优化是GUI应用开发中不可或缺的一部分。通过本篇学习,你应该掌握了:
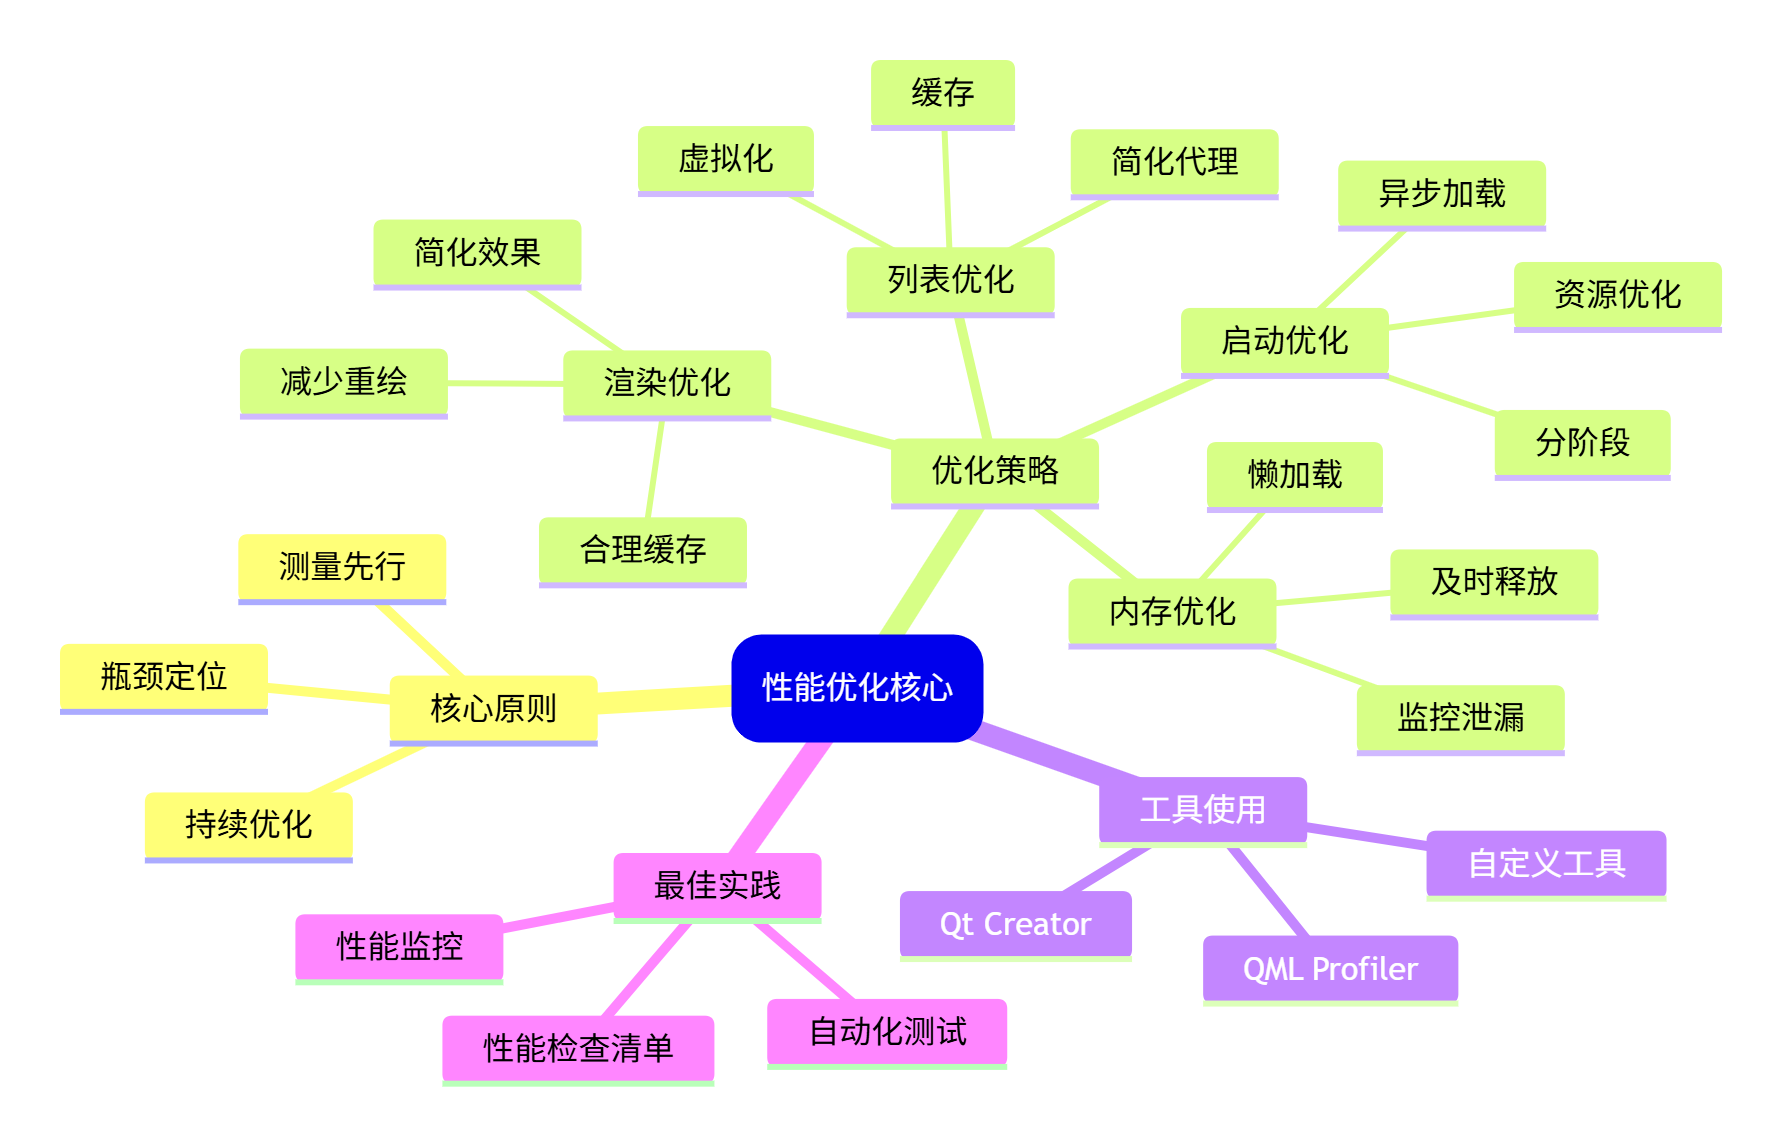
关键要点总结:
-
测量是基础:没有测量就没有优化,使用合适的工具分析性能
-
渲染优化:关注重绘区域、图层使用、特效开销
-
内存管理:及时释放资源,避免泄漏,合理使用缓存
-
列表性能:虚拟化、缓存、简化代理是大型列表的关键
-
启动速度:异步加载、分阶段初始化、资源优化
-
计算优化:避免阻塞主线程,使用Worker,缓存结果
实用建议:
-
建立性能基线:在优化前测量当前性能
-
优先解决瓶颈:80%的性能问题来自20%的代码
-
渐进式优化:一次只优化一个方面,测量效果
-
自动化监控:集成性能监控到开发流程
-
团队协作:制定性能标准,代码审查关注性能
记住:性能优化不是一次性的任务,而是持续的过程。在应用的整个生命周期中,都需要关注和优化性能。