Prometheus 入门与安装
一、什么是 Prometheus?
Prometheus(普罗米修斯)是一款开源的系统监控和告警工具,最初由 SoundCloud 开发,2016 年加入 CNCF(云原生计算基金会),是继 Kubernetes 之后的第二个毕业项目。
官网:https://prometheus.io/docs/introduction/overview/
核心特点
| 特性 | 说明 |
|---|---|
| 多维数据模型 | 基于时间序列,通过 metric 名和 key-value 标签区分数据 |
| PromQL 查询语言 | 灵活的数据查询和聚合 |
| 拉取(Pull)模式 | 主动从目标端抓取指标数据 |
| 服务发现 | 支持 Kubernetes、Consul、DNS 等多种自动发现 |
| 独立部署 | 无外部依赖,单二进制文件即可运行 |
| 告警体系 | 通过 Alertmanager 实现告警分组、抑制、静默 |
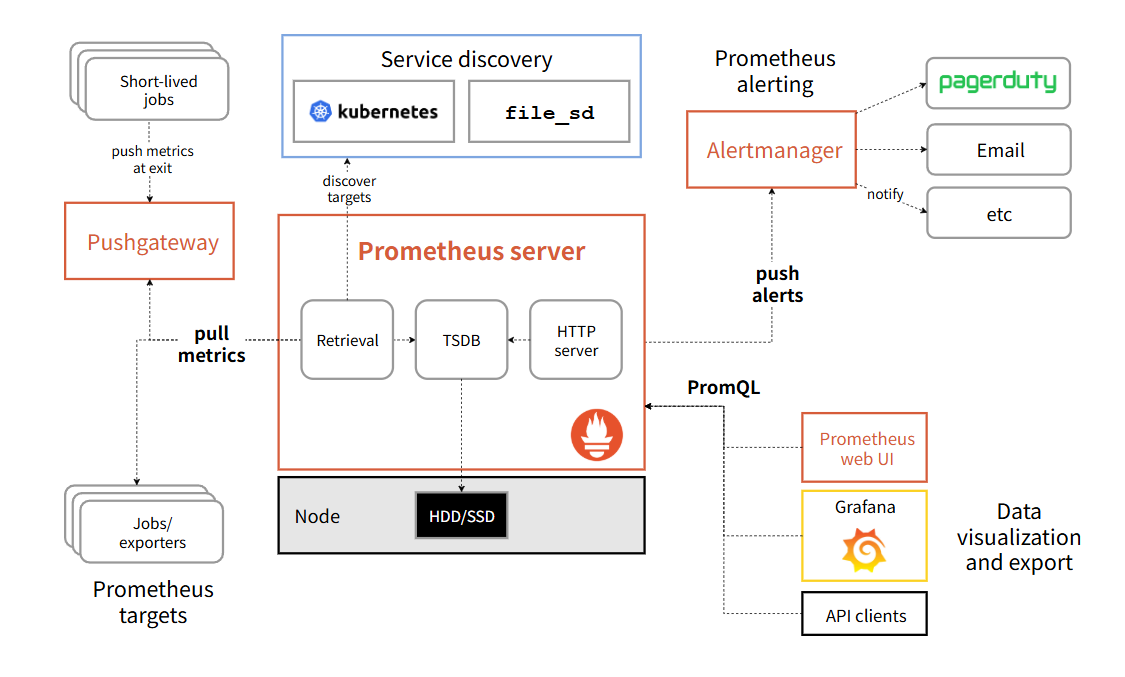
架构概览
+-------------------+      +-------------------+
|   Exporter /      |      |   Exporter /      |
|   被监控服务      |      |   被监控服务       |
+--------+----------+      +--------+----------+
         |                          |
         | HTTP GET /metrics        | HTTP GET /metrics
         v                          v
+---------------------------------------------------+
|                Prometheus Server                  |
|  +------------+  +------------+  +------------+   |
|  | 抓取模块   |  | 存储引擎   |  | HTTP API   |   |
|  +------------+  +------------+  +------------+   |
|  +------------+  +------------+                    |
|  | 告警评估   |  | 服务发现   |                    |
|  +------------+  +------------+                    |
+---------------------------------------------------+
         |
         | 告警推送
         v
+-------------------+
|   Alertmanager    |
+-------------------+
二、核心概念
2.1 指标(Metric)
指标是 Prometheus 监控的核心,每个指标由以下部分组成:
<metric_name>{<label_name>=<label_value>, ...} <value> <timestamp>示例:
http_requests_total{method="GET", endpoint="/api", status="200"} 1024 16950000002.2 指标类型
| 类型 | 说明 | 示例 |
|---|---|---|
| Counter | 只增不减的计数器 | 请求总数、错误总数 |
| Gauge | 可增可减的测量值 | 当前内存使用率、在线人数 |
| Histogram | 直方图,统计分布 | 请求延迟分布、响应大小分布 |
| Summary | 类似直方图,但计算分位数 | 请求延迟的 P99 |
2.3 作业(Job)与实例(Instance)
- Instance :一个被抓取的目标端点(如
192.168.1.1:9090) - Job :一组同类型 Instance 的集合(如
node-exporter)
三、安装 Prometheus
3.1 环境要求
- Linux
- 2GB+ 内存(推荐 4GB)
- 10GB+ 磁盘(取决于数据量)
3.2 下载与解压
bash
# 1. 访问 https://prometheus.io/download/ 获取最新版本
# 以 Linux amd64 为例(请替换为最新版本号)
wget https://github.com/prometheus/prometheus/releases/download/v2.53.0/prometheus-2.53.0.linux-amd64.tar.gz

# 2. 解压
tar xvf prometheus-2.53.0.linux-amd64.tar.gz

# 3. 进入目录
cd prometheus-2.53.0.linux-amd64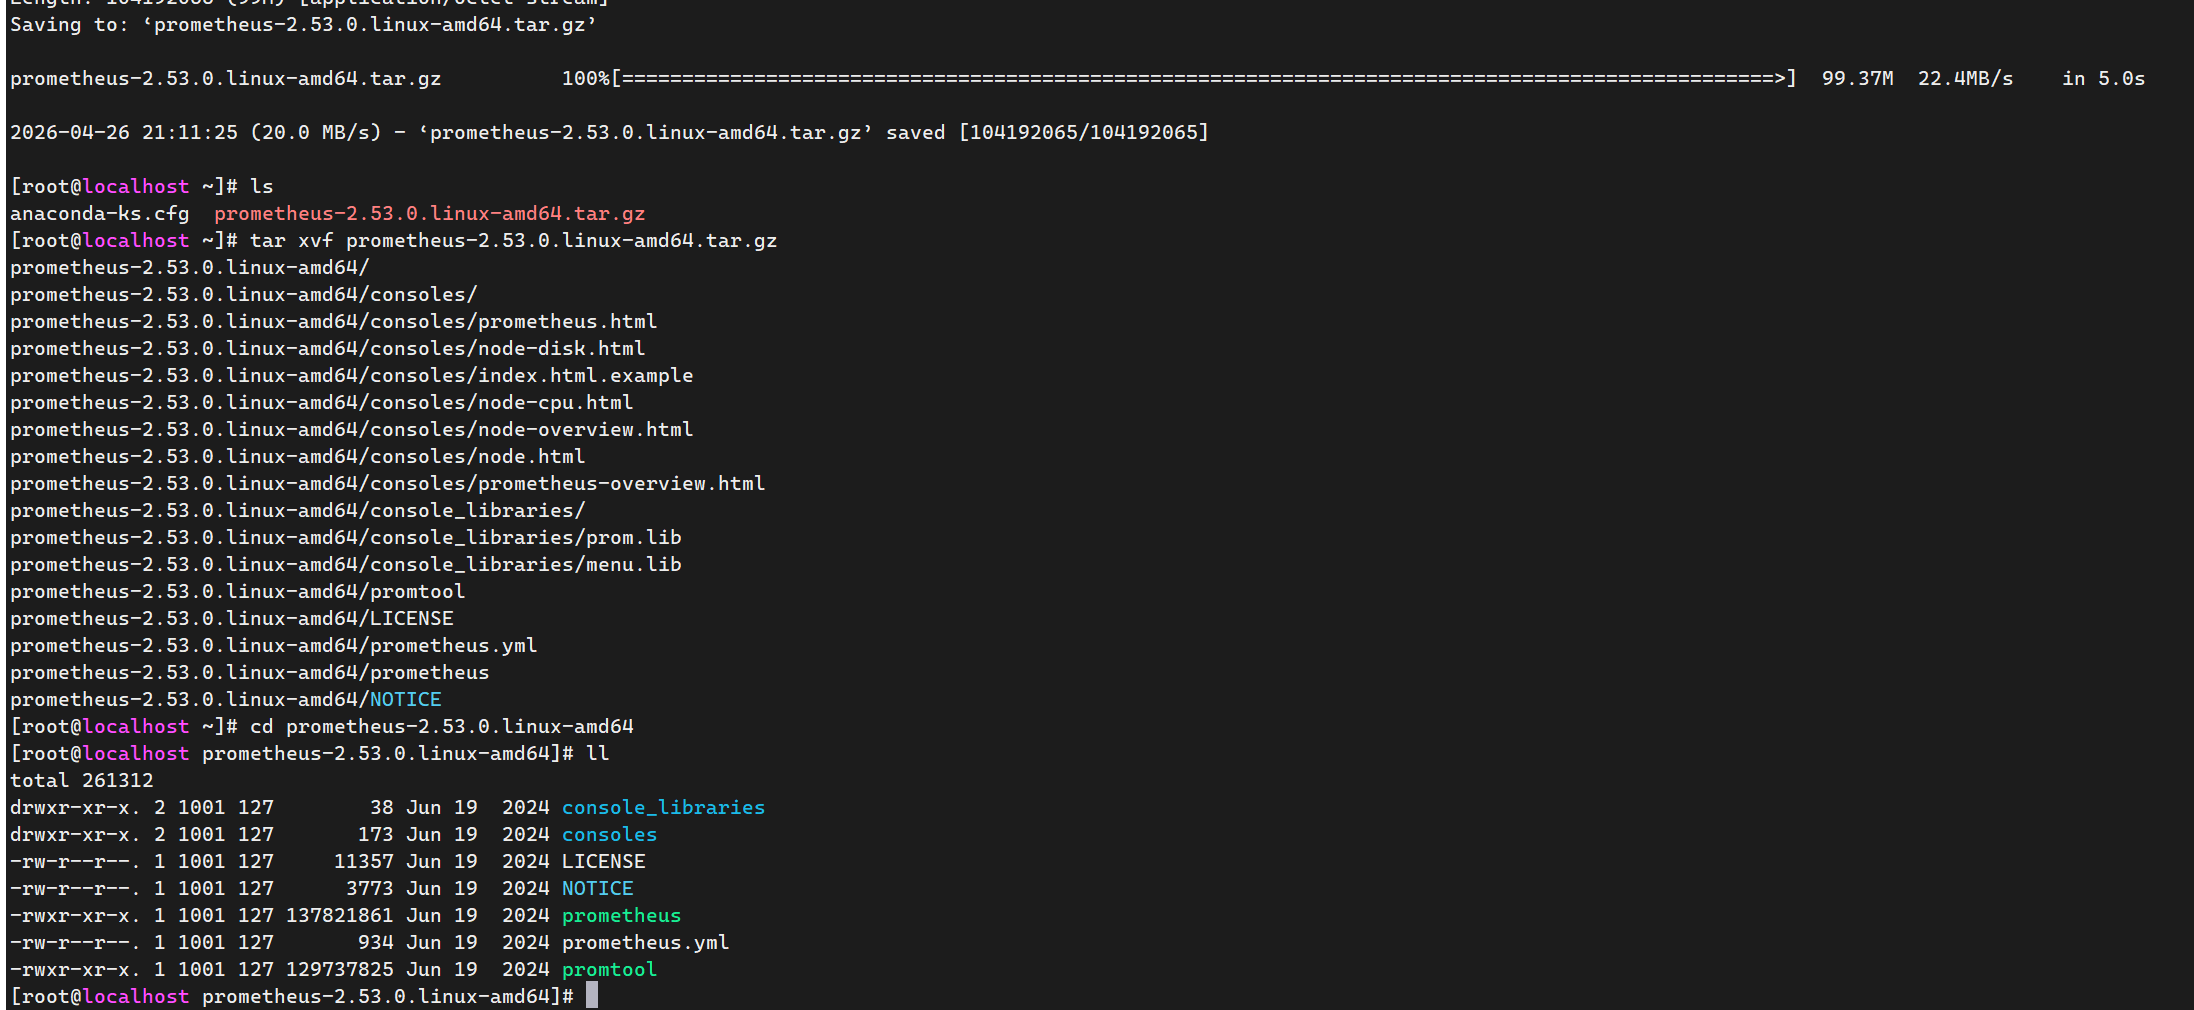
解压后目录结构:
prometheus-2.53.0.linux-amd64/
├── prometheus          # 主程序
├── promtool            # 工具(配置文件校验等)
├── prometheus.yml      # 默认配置文件
├── consoles/           # 控制台模板
├── console_libraries/  # 控制台模板库
├── LICENSE
├── NOTICE
└── data/               # 数据存储目录(启动后自动创建)
3.3 配置文件说明
Prometheus 主配置文件 prometheus.yml:
yaml
# 全局配置
global:
  scrape_interval: 15s      # 默认抓取间隔
  evaluation_interval: 15s  # 告警规则评估间隔
  scrape_timeout: 10s       # 抓取超时时间

# 告警配置
alerting:
  alertmanagers:
    - static_configs:
        - targets:
          # - alertmanager:9093

# 告警规则文件
rule_files:
  # - "first_rules.yml"
  # - "second_rules.yml"

# 抓取配置
scrape_configs:
  # Prometheus 自身监控
  - job_name: "prometheus"
    static_configs:
      - targets: ["localhost:9090"]
3.4 启动 Prometheus
bash
# 前台启动(测试用)
./prometheus --config.file=prometheus.yml
# 后台启动(生产用)
nohup ./prometheus --config.file=prometheus.yml > prometheus.log 2>&1 &
# 或者使用 systemd 管理(推荐)
# 查找 prometheus 的进程ID
ps aux | grep prometheus | grep -v grep
# 或者更精确地查找
pgrep -f "prometheus --config.file=prometheus.yml"
# 使用 kill 命令停止(优雅停止)
kill <PID>
# 如果进程不响应,可以强制停止(不推荐)
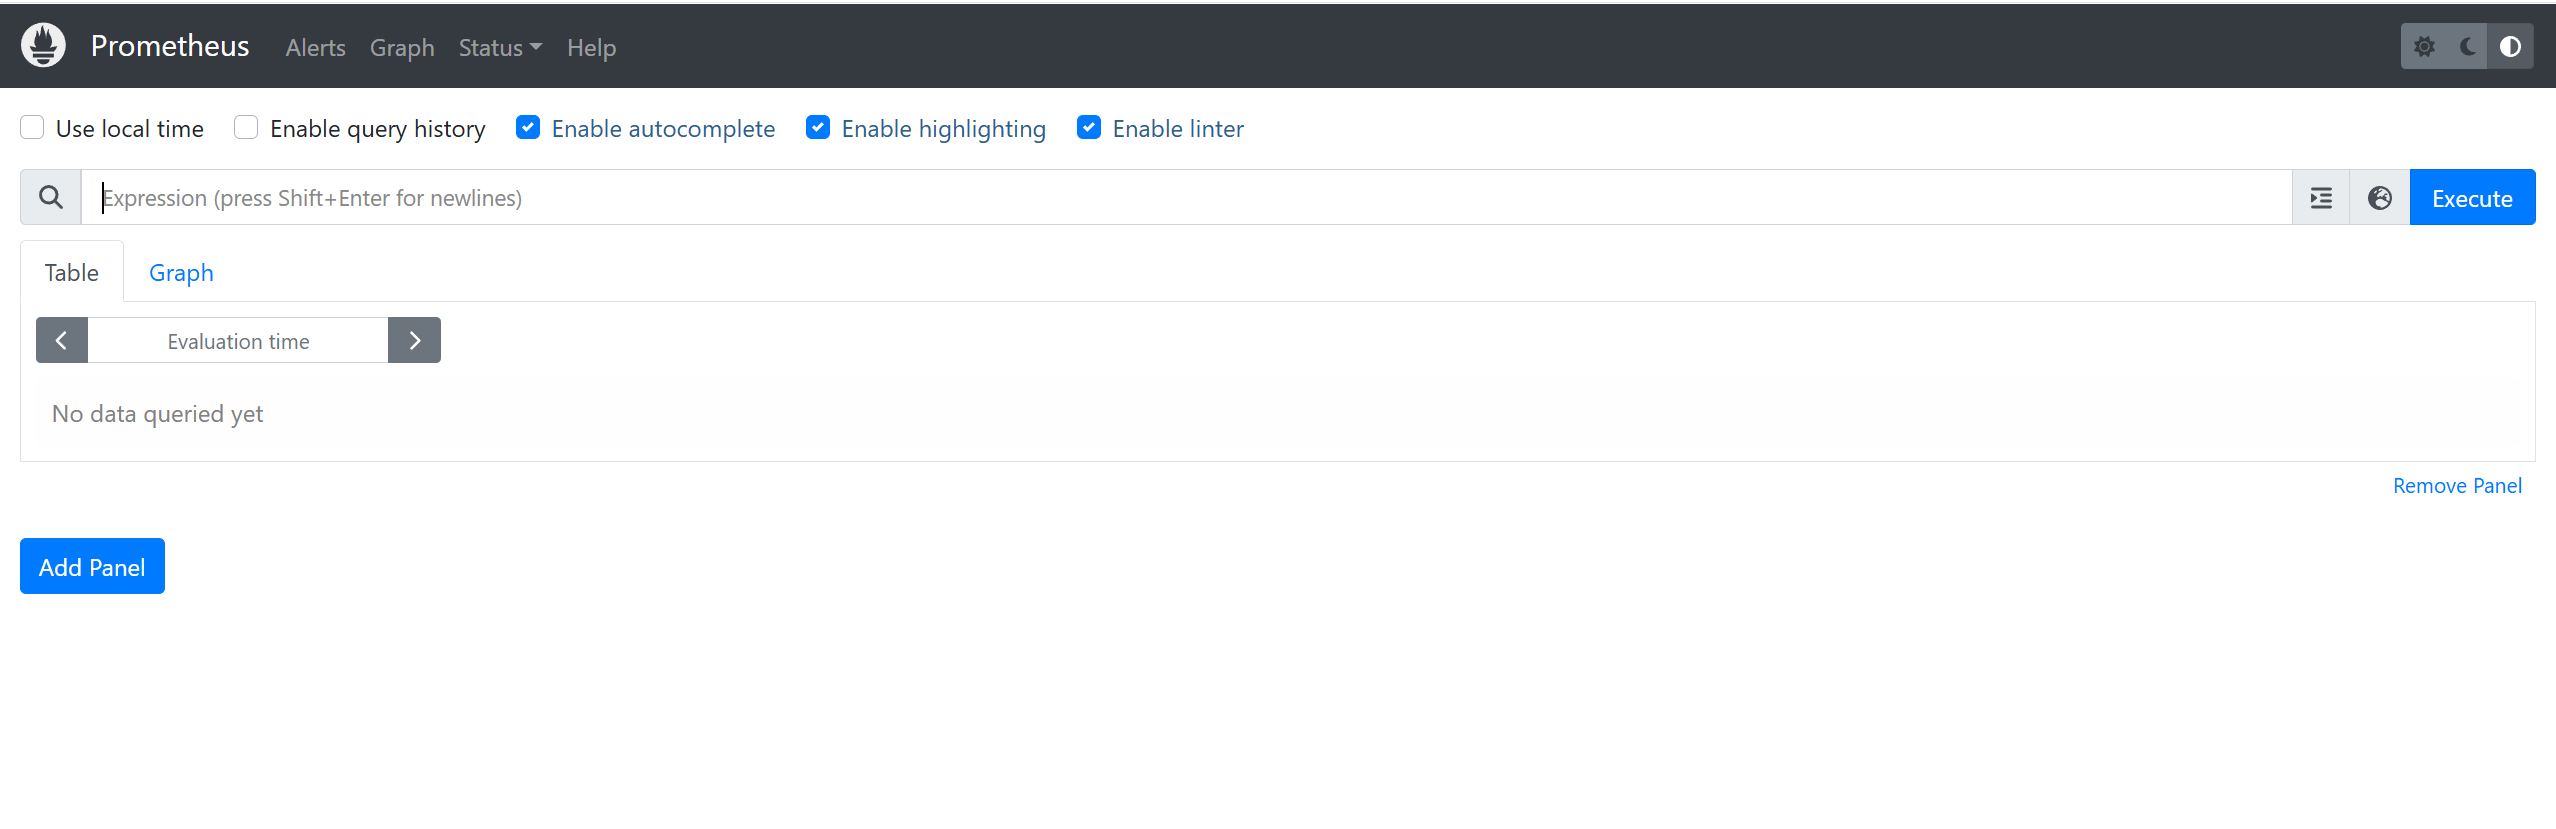
kill -9 <PID>访问 http://你的IP:9090 即可看到 Prometheus Web UI。
四、安装 Node Exporter(采集主机指标)
Node Exporter 用于采集 Linux 主机的系统指标(CPU、内存、磁盘、网络等)。
bash
# 下载
wget https://github.com/prometheus/node_exporter/releases/download/v1.8.1/node_exporter-1.8.1.linux-amd64.tar.gz

# 解压
tar xvf node_exporter-1.8.1.linux-amd64.tar.gz
cd node_exporter-1.8.1.linux-amd64

# 启动
nohup ./node_exporter > node_exporter.log 2>&1 &
验证采集:
bash
curl http://localhost:9100/metrics配置 Prometheus 抓取 Node Exporter
在 prometheus.yml 的 scrape_configs 中添加:
yaml
- job_name: "node_exporter"
static_configs:
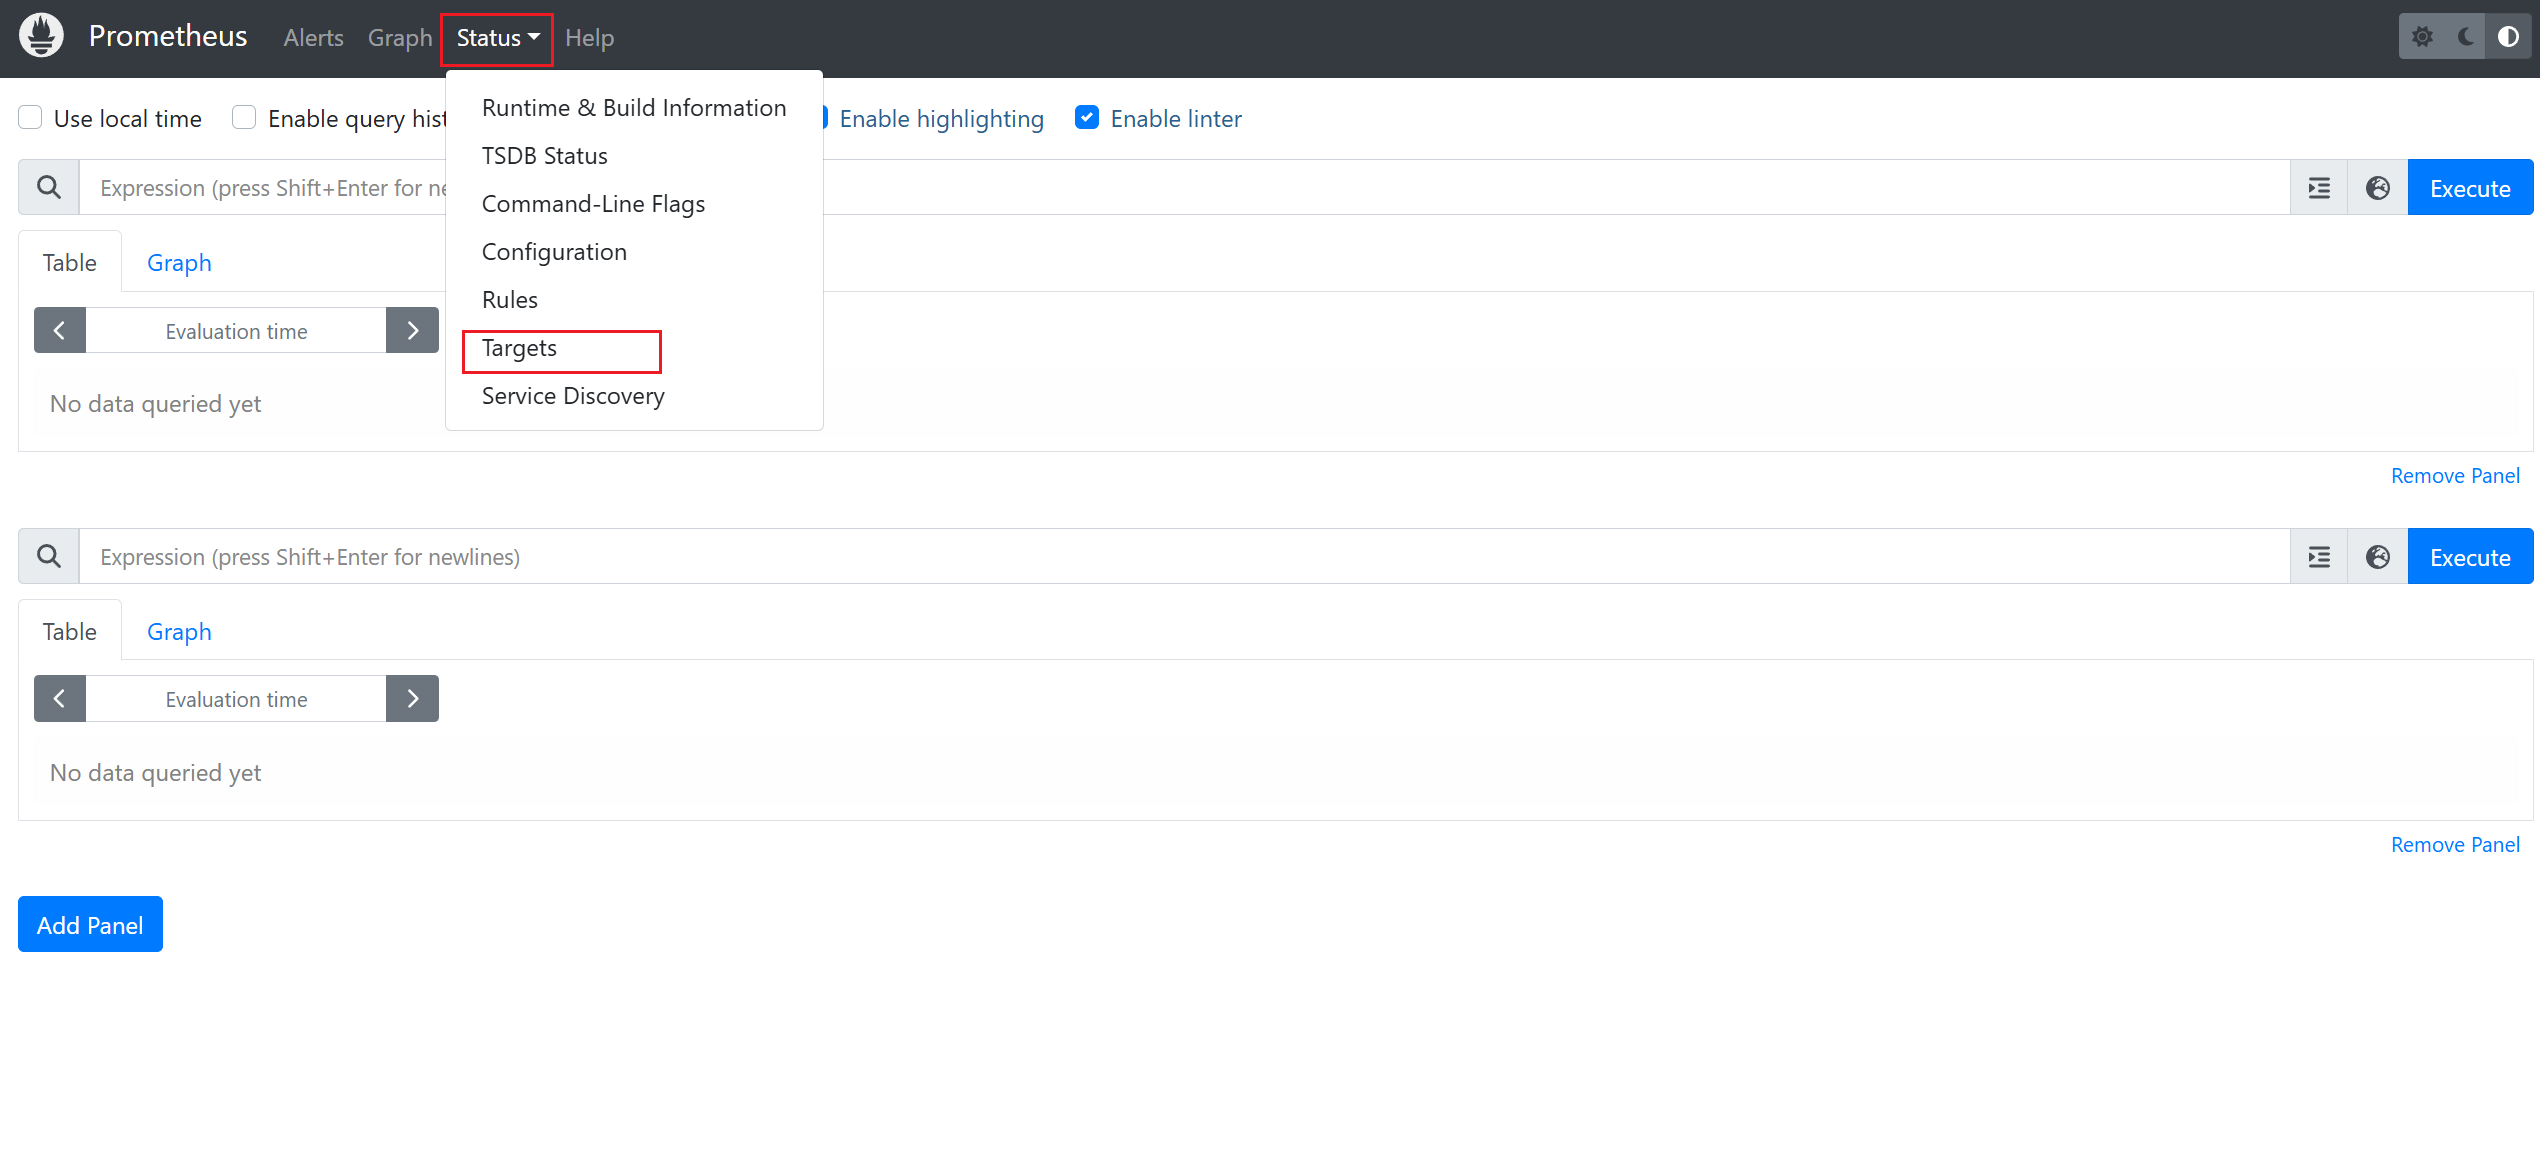
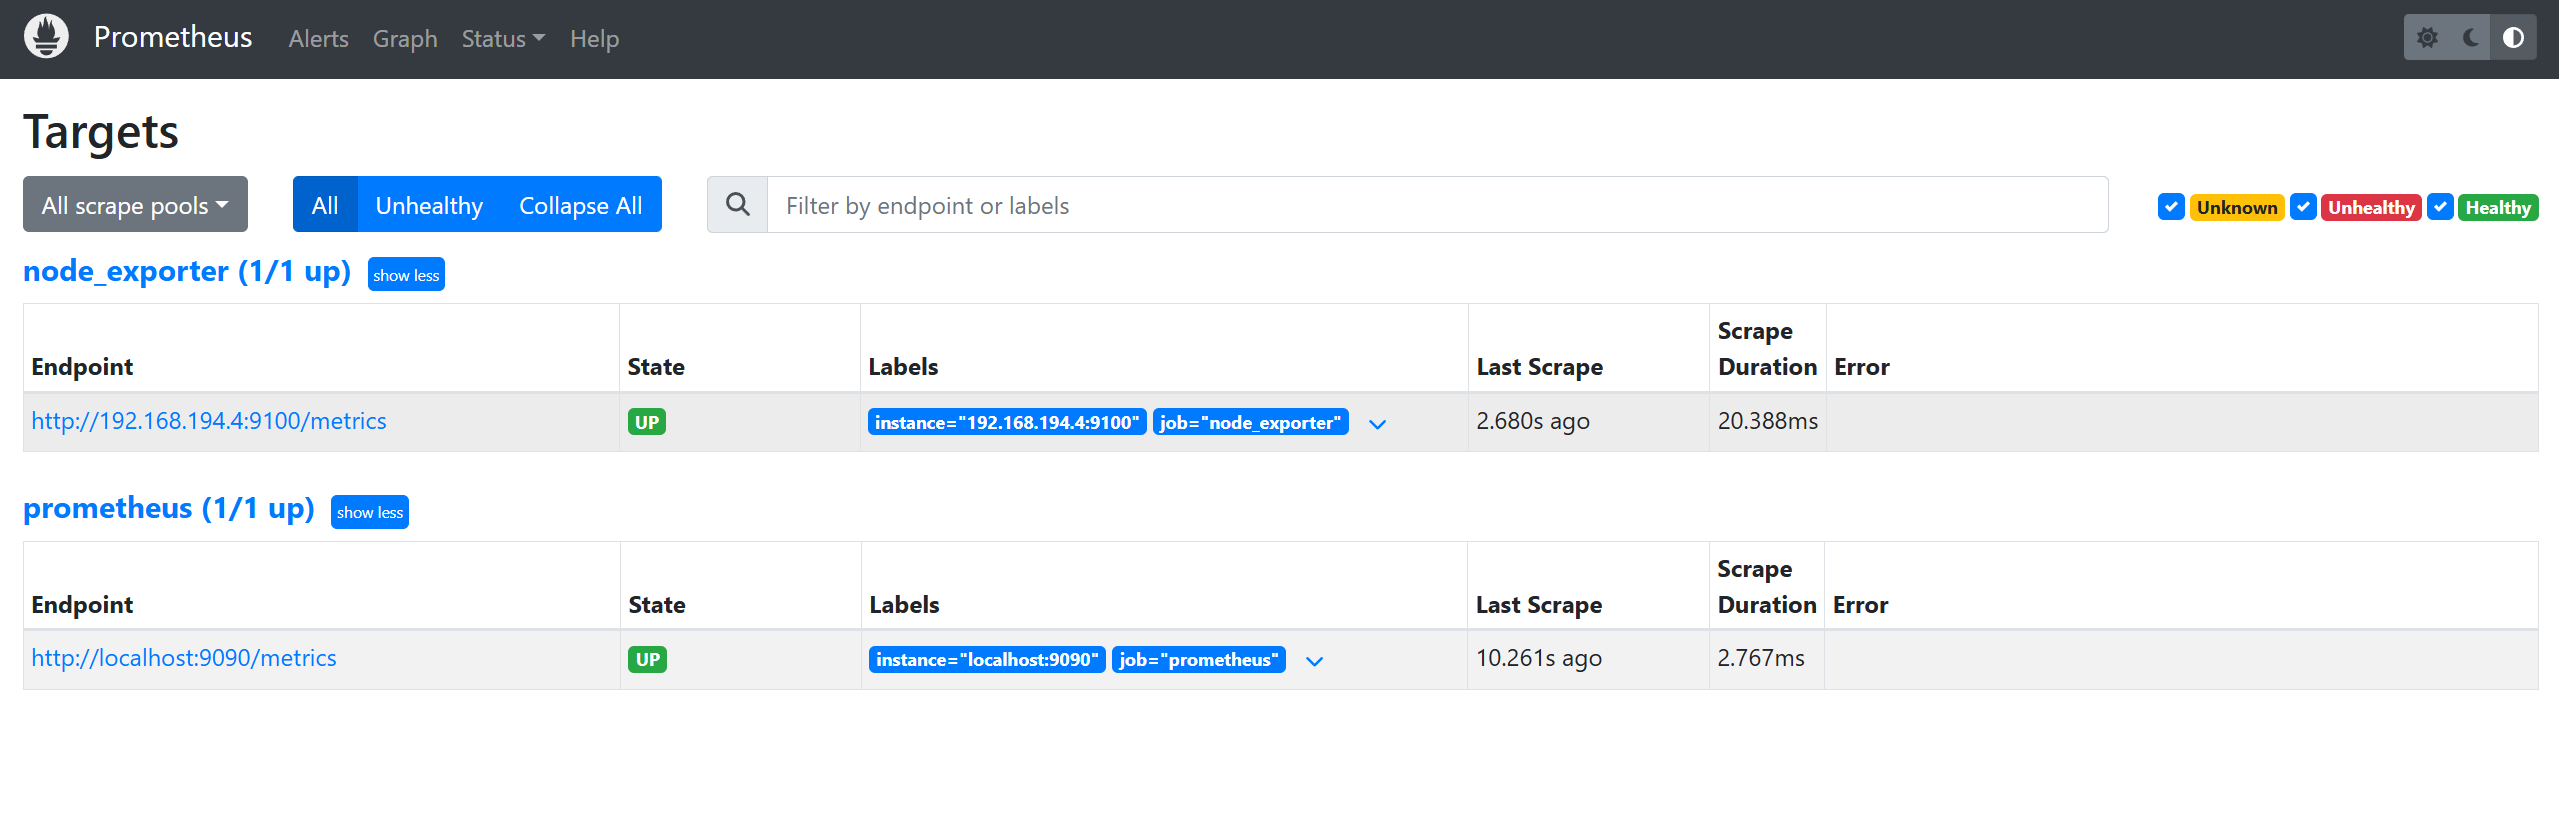
- targets: ["localhost:9100"]重启 Prometheus 后,Web UI 的 Status → Targets 中即可看到新目标。
五、PromQL 快速入门
5.1 基础查询
promql
# 查询所有指标
node_cpu_seconds_total

# 带标签过滤
node_cpu_seconds_total{mode="idle"}

# 范围查询(过去5分钟)
node_cpu_seconds_total[5m]
5.2 常用函数
promql
# 增长率(适合 Counter 类型)
rate(node_cpu_seconds_total{mode="idle"}[1m])

# 平均值
avg(rate(node_cpu_seconds_total{mode="idle"}[1m]))

# Top N
topk(3, node_memory_MemAvailable_bytes)

# 内存使用率
(1 - node_memory_MemAvailable_bytes / node_memory_MemTotal_bytes) * 100
5.3 实用查询示例
promql
# CPU 使用率(排除 idle)
100 - (avg by(instance) (rate(node_cpu_seconds_total{mode="idle"}[5m])) * 100)

# 内存使用率
(1 - node_memory_MemAvailable_bytes / node_memory_MemTotal_bytes) * 100

# 磁盘使用率
node_filesystem_avail_bytes{mountpoint="/"} / node_filesystem_size_bytes{mountpoint="/"} * 100

# 网络流量(1分钟平均)
rate(node_network_receive_bytes_total[1m])
六、Docker 部署(快速体验)
单机运行
bash
docker run -d \
  --name prometheus \
  -p 9090:9090 \
  -v $(pwd)/prometheus.yml:/etc/prometheus/prometheus.yml \
  prom/prometheus
Docker Compose(Prometheus + Node Exporter)
yaml
version: "3.8"

services:
  prometheus:
    image: prom/prometheus:latest
    container_name: prometheus
    ports:
      - "9090:9090"
    volumes:
      - ./prometheus.yml:/etc/prometheus/prometheus.yml
      - prometheus_data:/prometheus
    command:
      - "--config.file=/etc/prometheus/prometheus.yml"
      - "--storage.tsdb.path=/prometheus"
    restart: unless-stopped

  node_exporter:
    image: prom/node-exporter:latest
    container_name: node_exporter
    ports:
      - "9100:9100"
    restart: unless-stopped

volumes:
  prometheus_data:
七、生产部署建议
| 建议项 | 说明 |
|---|---|
| 存储保留时间 | 默认15天,通过 --storage.tsdb.retention.time 配置 |
| 资源限制 | 设置 systemd 或容器的内存/CPU 上限 |
| 数据持久化 | 使用独立磁盘或云盘,避免与系统盘共用 |
| 高可用 | 双实例运行 + 相同抓取配置,通过负载均衡访问 |
| 远程存储 | 数据量较大时接入 Thanos、VictoriaMetrics 或 Cortex |
| 安全 | 使用 --web.basic-auth 或反向代理添加认证 |
| 告警 | 配置 Alertmanager,对接钉钉/企微/飞书/Slack 通知 |
常用启动参数
bash
./prometheus \
  --config.file=/etc/prometheus/prometheus.yml \
  --storage.tsdb.path=/data/prometheus \
  --storage.tsdb.retention.time=30d \
  --storage.tsdb.retention.size=50GB \
  --web.listen-address=0.0.0.0:9090 \
  --web.enable-lifecycle \
  --log.level=info
--web.enable-lifecycle 允许通过 API 热加载配置:
bash
curl -X POST http://localhost:9090/-/reload八、验证安装
bash
# 检查 Prometheus 自身指标
curl http://localhost:9090/metrics

# 检查 Web UI
# 浏览器打开 http://localhost:9090

# 在 Web UI 中执行测试查询
prometheus_target_interval_length_seconds

# 检查抓取目标状态
# Status → Targets,确认所有目标 UP
九、常见问题
Q1:启动报错 "open /data/queries.active: permission denied"
数据目录权限问题:
bash
sudo chown -R prometheus:prometheus /var/lib/prometheusQ2:Target 状态为 DOWN
- 确认 Exporter 已启动且端口可达
- 检查防火墙规则
- 确认
scrape_timeout是否太短
Q3:磁盘空间增长过快
调整存储参数:
bash
--storage.tsdb.retention.time=7d
--storage.tsdb.retention.size=20GB