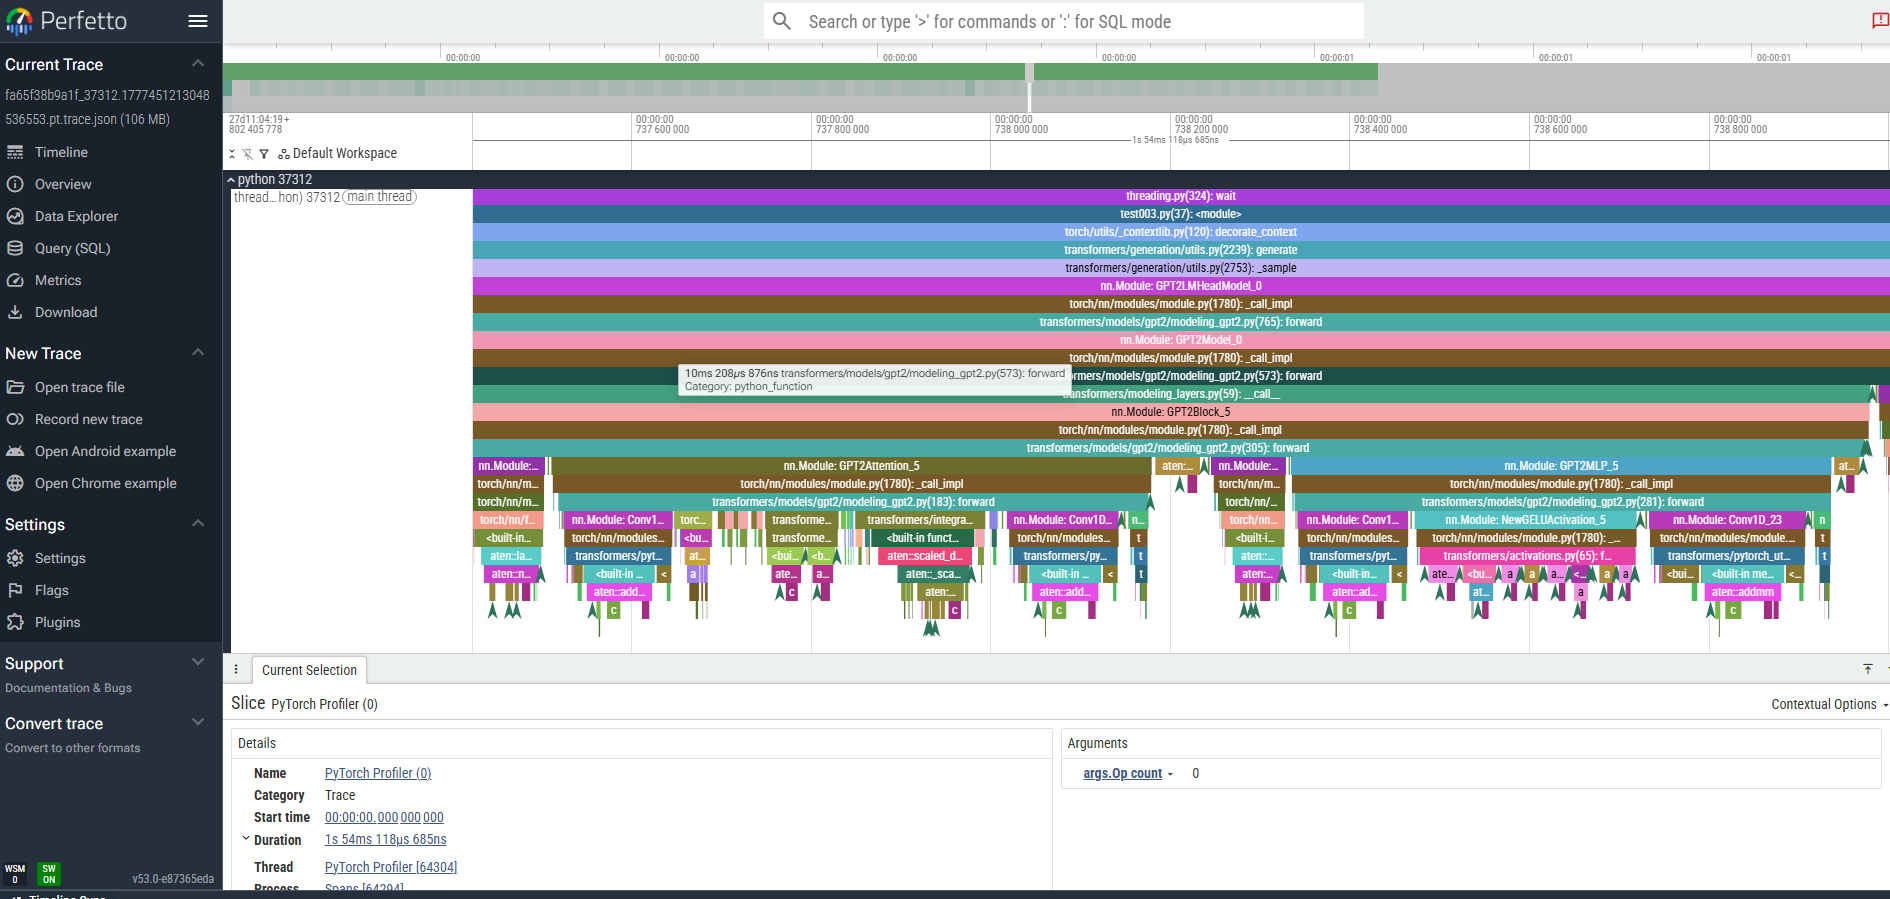
用 torch.profiler 来监控大模型推理,这样可以得到 GPU/CPU 使用情况、时间消耗、内存占用 ,比简单的 psutil 更精确。下面完整示例:
python
import torch
from transformers import AutoModelForCausalLM, AutoTokenizer
import time

# 1️⃣ 模型和 tokenizer
model_name = "distilgpt2"
tokenizer = AutoTokenizer.from_pretrained(model_name)
model = AutoModelForCausalLM.from_pretrained(model_name)

device = "cuda" if torch.cuda.is_available() else "cpu"
model.to(device)

# 输入 prompt
prompt = "Hello, I am a small language model. I can"
inputs = tokenizer(prompt, return_tensors="pt").to(device)

# 2️⃣ 使用 torch.profiler 监控推理
with torch.profiler.profile(
    schedule=torch.profiler.schedule(wait=1, warmup=1, active=2, repeat=1),
    on_trace_ready=torch.profiler.tensorboard_trace_handler("./log"),
    record_shapes=True,
    profile_memory=True,
    with_stack=True
) as prof:

    # 模拟多步推理,方便 profiler 捕捉
    for step in range(4):
        outputs = model.generate(
            **inputs,
            max_length=50,
            do_sample=True,
            temperature=0.7,
            top_k=50,
            top_p=0.95,
            no_repeat_ngram_size=2
        )
        prof.step()  # 标记 step,方便分析

# 3️⃣ 打印统计信息
print(prof.key_averages().table(
    sort_by="self_cpu_time_total", row_limit=20
))

# 4️⃣ TensorBoard 查看
print("Profiler traces saved to ./log, run:")
print("tensorboard --logdir=./log")
✅ 功能说明
- Profiler 配置
record_shapes=True→ 记录每个操作的 tensor 形状profile_memory=True→ 记录显存/内存占用with_stack=True→ 打印调用堆栈,定位耗时操作
- Schedule
python
schedule=torch.profiler.schedule(wait=1, warmup=1, active=2, repeat=1)- wait:等待 step 数不记录
- warmup:热身 step,不计入统计
- active:记录 step 数
- repeat:重复几次 schedule
- 用于多步生成或批量生成时统计更准确
- Profiler 输出
prof.key_averages()→ CPU/GPU 每个操作耗时、显存消耗- 可以排序(
self_cpu_time_total/cuda_time_total)找到瓶颈
- TensorBoard 可视化
bash
tensorboard --logdir=./log- 可以看到每步操作的 GPU/CPU 时间、内存曲线
- 直观分析模型推理性能
💡 优化建议
- 如果模型更大(7B+),可以结合
torch.autocast("cuda")做混合精度,节省显存并提升速度:
python
with torch.autocast(device_type="cuda", dtype=torch.float16):
outputs = model.generate(...)- 可以在 profiler 的
on_trace_ready回调中写自定义分析,比如打印每层显存占用。
访问
https://ui.perfetto.dev/#!/viewer?local_cache_key=0-json