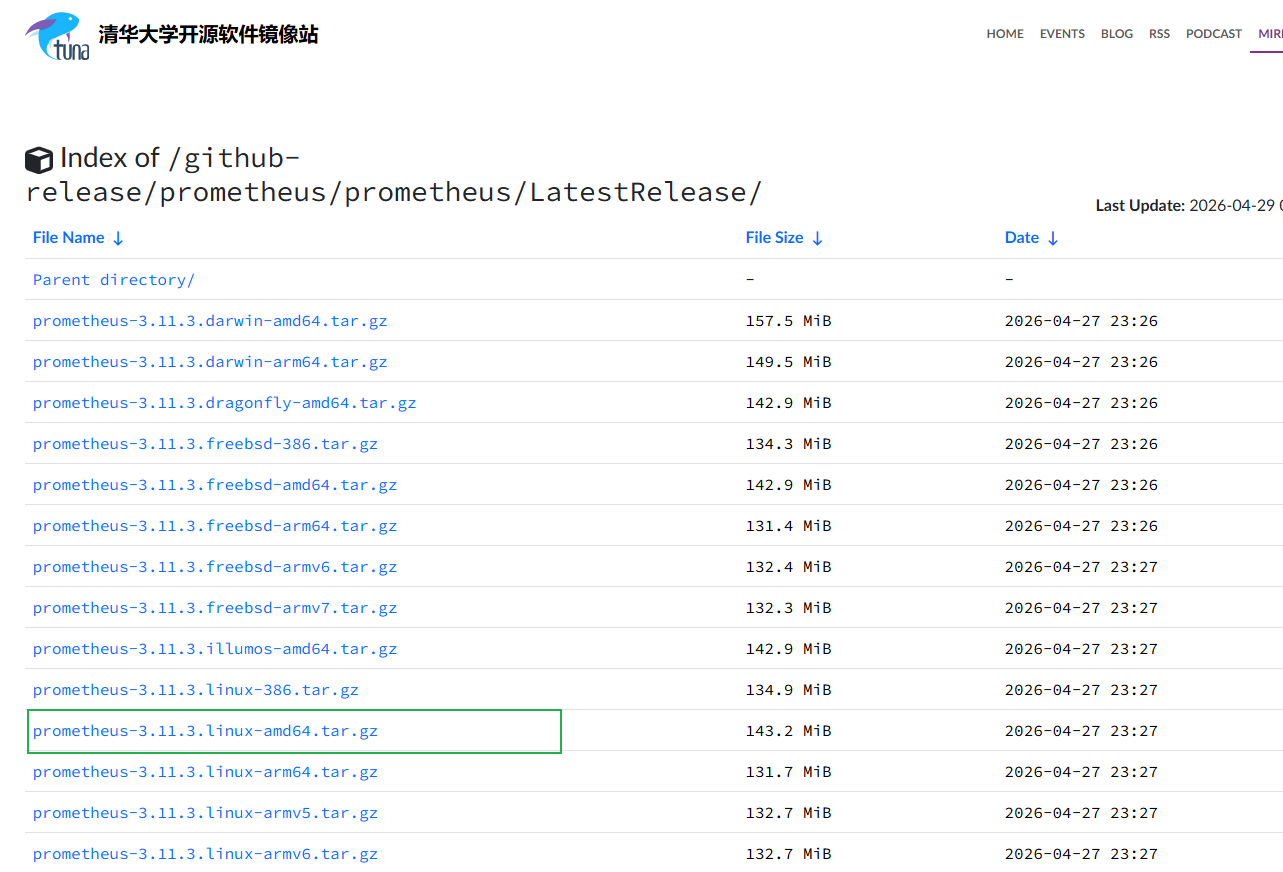
1.下载prometheus
https://mirrors.tuna.tsinghua.edu.cn/github-release/prometheus/prometheus/LatestRelease/
 2. linux主机解压文件并修改权限归属
比如文件可放置于/opt目录下
使用root权限
cd /opt
解压并删除压缩包
tar -zxvf prometheus-2.53.3.linux-amd64.tar.gz
rm -f prometheus-2.53.3.linux-amd64.tar.gz
重命名文件夹,方便后续操作
mv prometheus-2.53.3.linux-amd64 prometheus
创建 prometheus 系统用户(不创建家目录,禁止登录)
useradd -M -s /usr/sbin/nologin prometheus
将安装目录的所有权交给 prometheus 用户
chown -R prometheus:prometheus /opt/prometheus
3.配置 Systemd 服务(实现开机自启)
vim /lib/systemd/system/prometheus.service
bash
[Unit]
Description=Prometheus Server
Documentation=https://prometheus.io/docs/
After=network.target

[Service]
User=prometheus
Group=prometheus
Type=simple
# 指定配置文件和数据存储路径
ExecStart=/opt/prometheus/prometheus \
    --config.file=/opt/prometheus/prometheus.yml \
    --storage.tsdb.path=/opt/prometheus/data/ \
    --storage.tsdb.retention.time=7d \
    --web.console.templates=/opt/prometheus/consoles \
    --web.console.libraries=/opt/prometheus/console_libraries
Restart=on-failure

[Install]
WantedBy=multi-user.target- 启动并验证 Prometheus
重载系统服务配置
systemctl daemon-reload
启动 Prometheus
systemctl start prometheus
设置开机自启
systemctl enable prometheus
查看运行状态(看到绿色的 active (running) 即为成功)
systemctl status prometheus
5.访问 Prometheus 原生界面
http://你的服务器IP:9090 即可看到 Prometheus 的原生 Web 界面
6.新增主机监控指标
如果主机很多,把 IP 全部写在 prometheus.yml 里会很乱。你可以把目标 IP 单独写在一个文件里
vim targets.yml
bash
- labels:
    job: node
  targets:
    - 192.168.1.100:9100
    - 192.168.1.101:9100
    - 192.168.1.102:9100
    - 192.168.1.103:9100
修改 prometheus.yml,使用 file_sd_configs:
bash
scrape_configs:
  - job_name: 'all_nodes'
    file_sd_configs:
      - files:
          - targets.yml  # 引用刚才创建的文件
        refresh_interval: 5m # 每5分钟自动检查一次文件变化
验证配置文件语法(防止写错导致启动失败):
进入 Prometheus 目录 检查配置
bash
promtool check config prometheus.yml重启服务
systemctl restart prometheus