封面与前言

我在三年前写过一个 UpSet 图的 MATLAB 绘制工具,在fileexchange上,Joris Hooftman 提到那段代码没有绘制intersect模式的能力,且应对大数据集会有点吃力,因此对代码进行了改进。首先需要下载工具函数或者复制保存工具函数代码到m文件,工具函数代码可在以下三个仓库获取:
- 【fileexchange】https://www.mathworks.com/matlabcentral/fileexchange/123695-upset-plot
- 【gitee】https://gitee.com/slandarer/matlab-up-set-plot
- 【github】https://github.com/slandarer/MATLAB-UpSet-plot
UpSet 图介绍
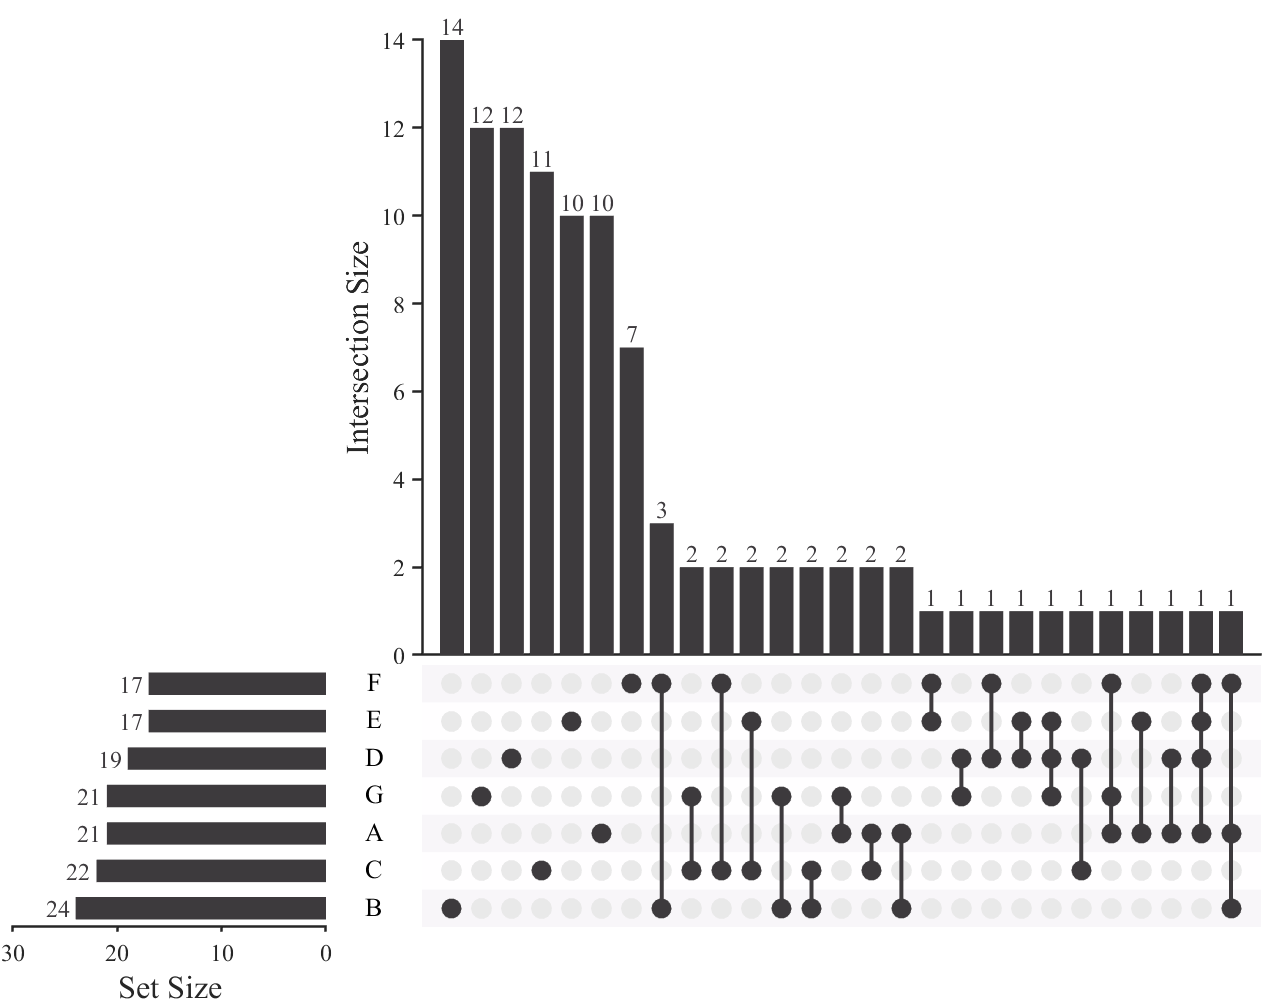
韦恩图随着阶数升高会越来越复杂,当阶数达到7或者以上时几乎没办法绘制:
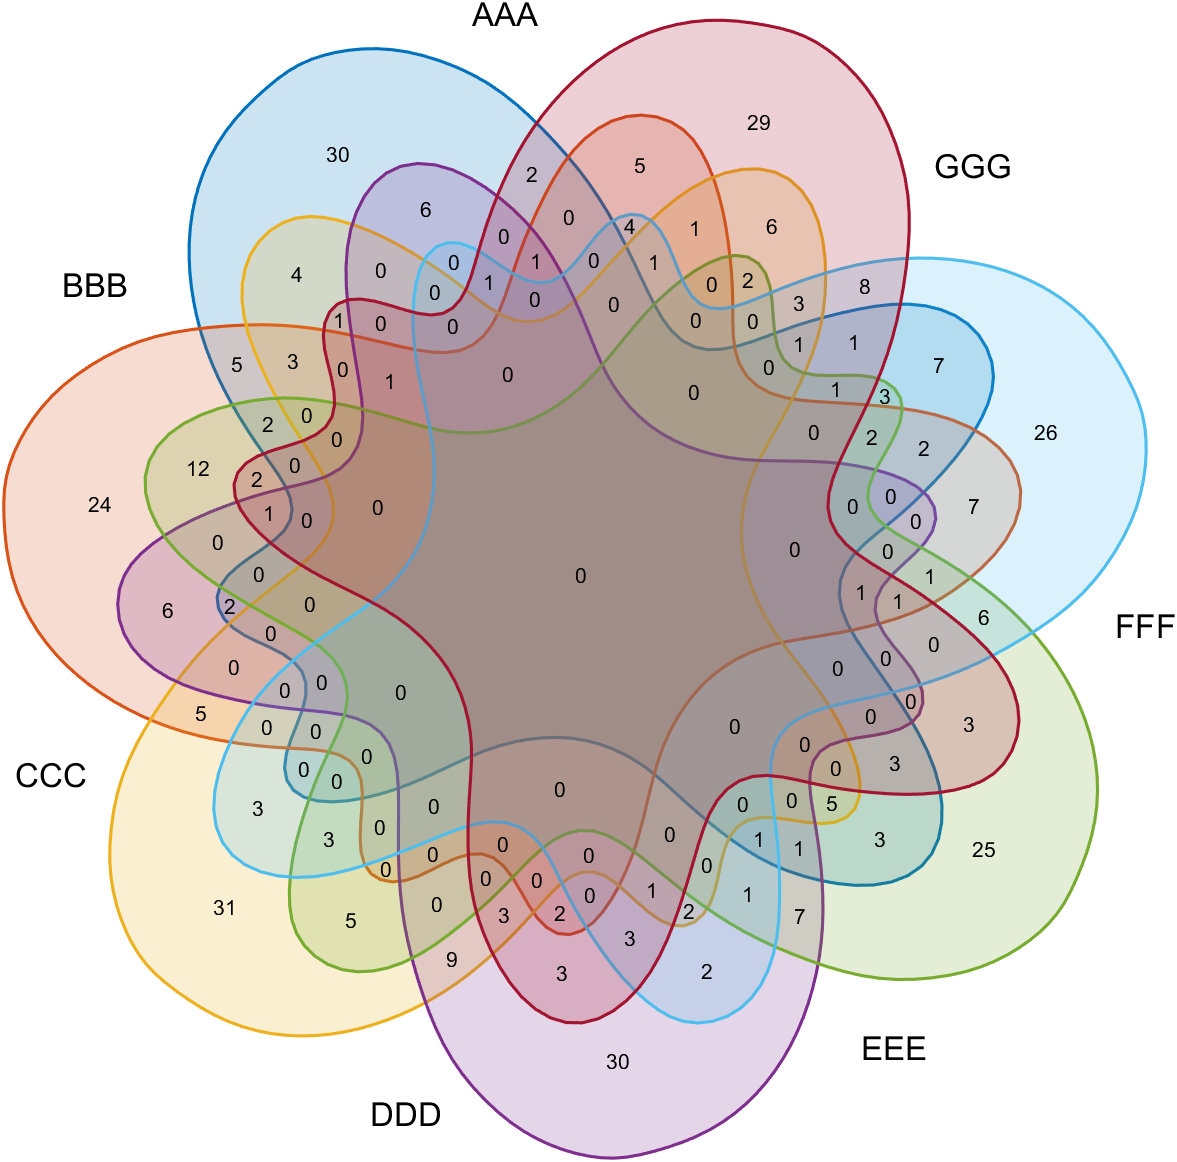
但是使用upset图却可以比较轻易的绘制:
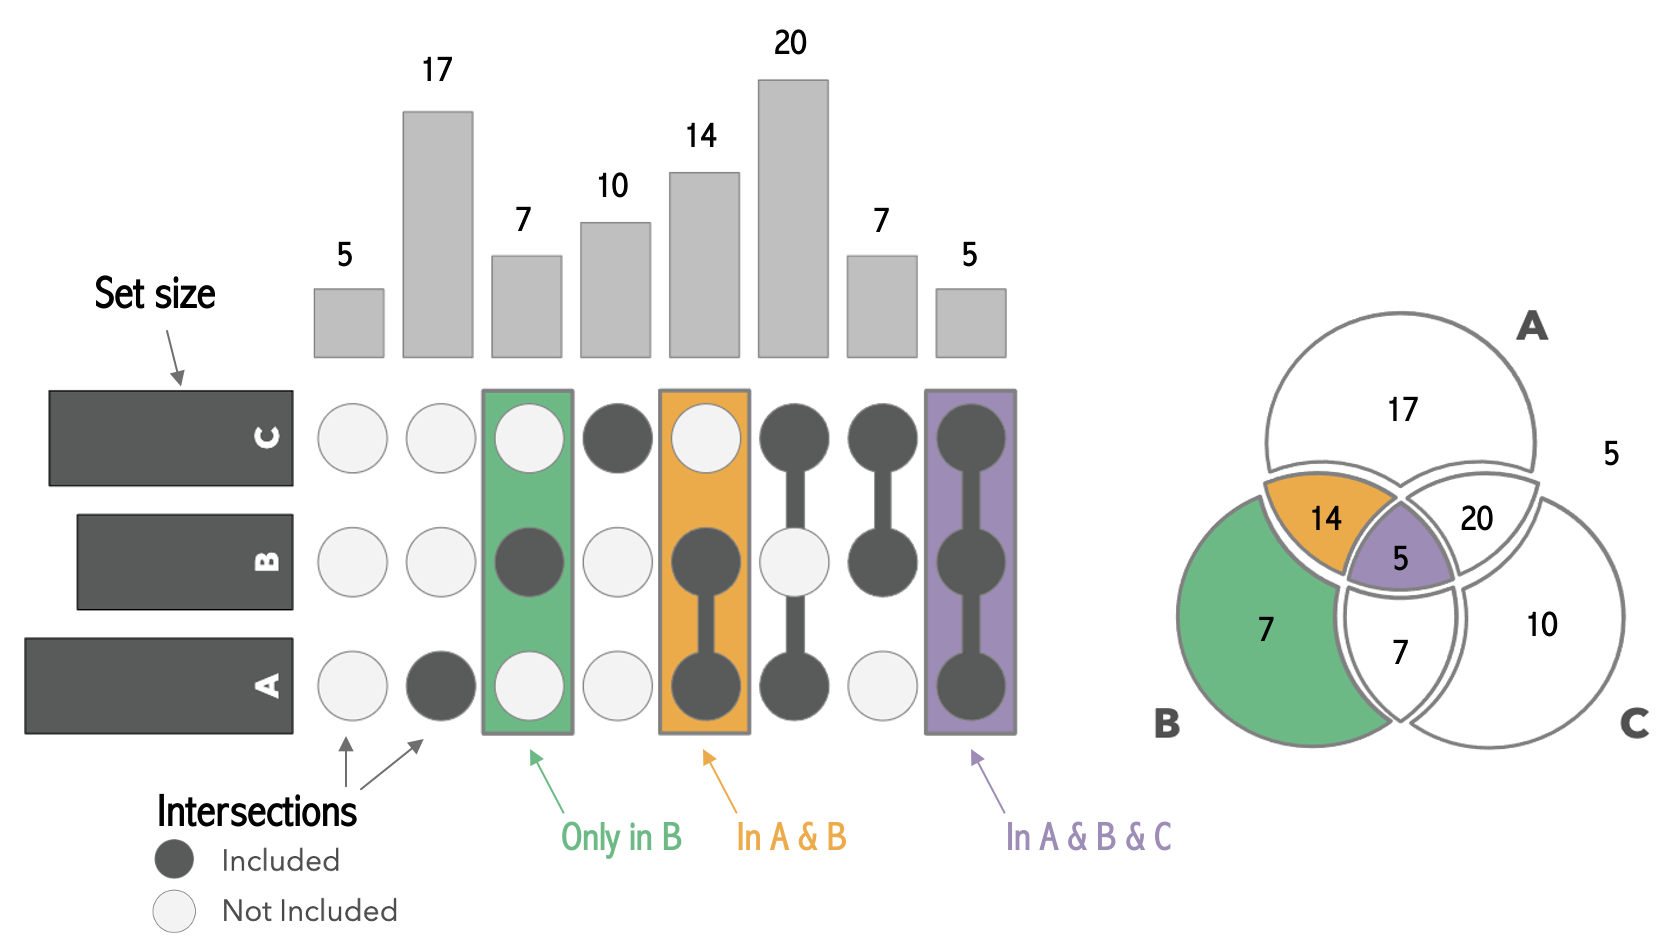
两种类型图的对应关系:
接下来是工具函数使用教程:
教程部分
基础使用
本函数适用于0-1矩阵,每一行代表一个样本,该样本第i列如果是0说明该样本不属于该集合,反之如果是1,说明该样本属于该集合:
matlab
% Binary set matrix (samples × sets)
% ---------------------------------
%  A  B  C  sets
% [1  0  0] sample-1
% [0  1  0] sample-2
% [... ...] ... ...
% [0  0  1] sample-n
% ---------------------------------
%     -> 1 = sample belongs to set.
%     -> 0 = sample does not belong.
例如随机生成数据:
matlab
setName={'RB1','PIK3R1','EGFR','TP53','PTEN'};
Data=rand([200,5])>.85;

% Data =
%
% 200×5 logical 数组
%
% 1   0   0   1   0
% 1   0   0   0   0
% 1   0   0   0   0
% 0   1   0   1   0
% 0   1   0   0   0
% ... ...
第一行是1,0,0,1,0说明它既属于集合1也属于集合4。
简单给个例子:
matlab
rng(1)
% Define set names (5 categories).
setName = {'RB1','PIK3R1','EGFR','TP53','PTEN'};
% Generate random binary membership matrix (200 samples, 5 sets).
setMat = rand([200, 5]) > 0.85;

% Create UpSet plot object.
USP = UpSetPlot(setMat, 'SetName',setName);
USP.calc();    % Calculate intersection sizes.
USP.draw();    % Render the UpSet plot.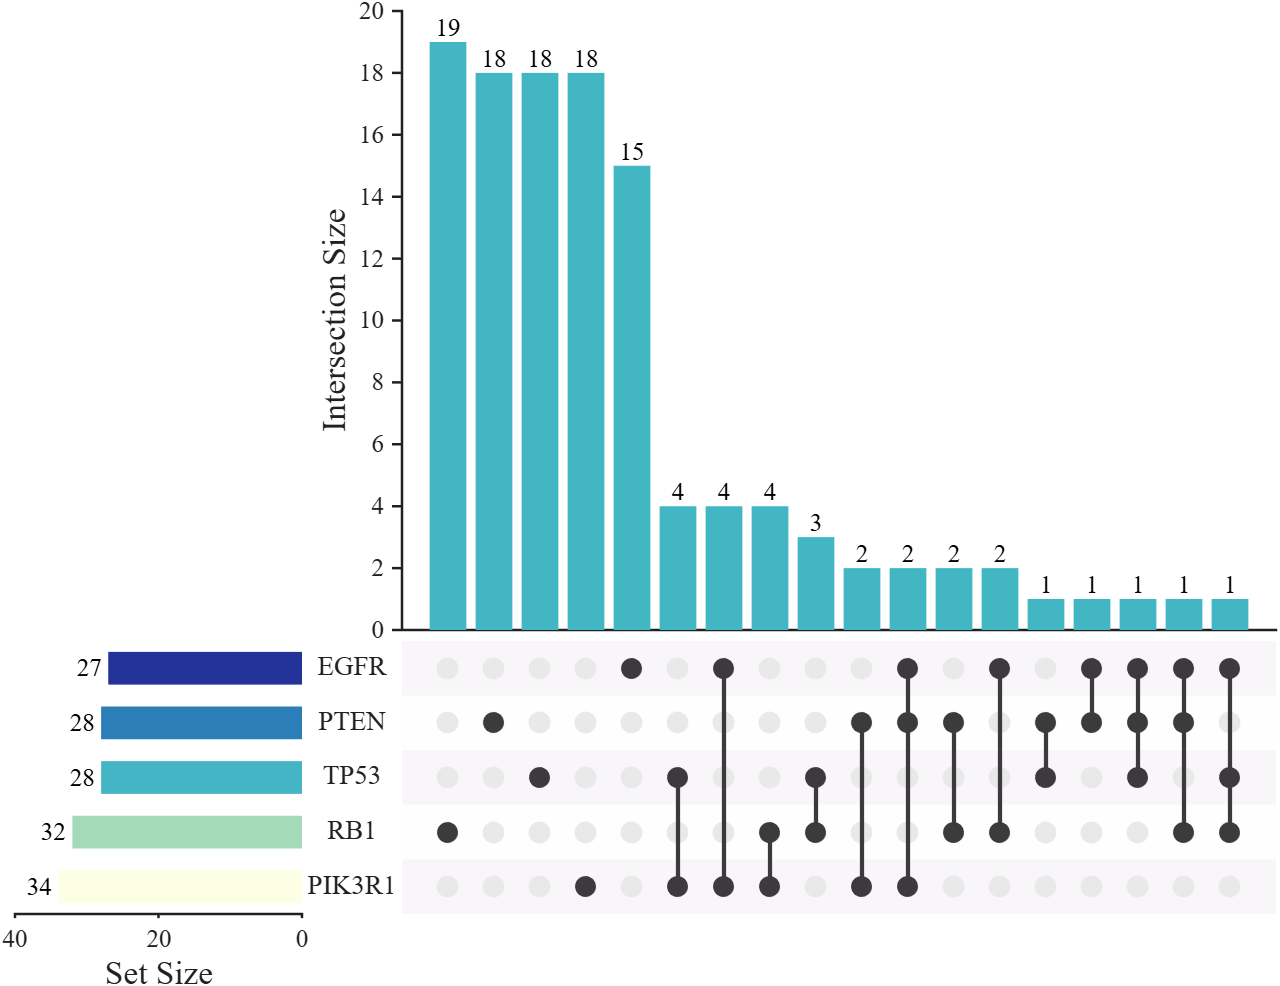
intersect 模式
默认模式是 distinct, 比如对于原来柱状图第6列:
- distinct :数据只同时属于 TP53 和 PIK3R1 集合,不属于其他集合。
- intersect : 数据同时属于 TP53 和 PIK3R1 集合,但也可能属于其他集合。
通过以下代码可以绘制 intersect 模式的 UpSet 图:
matlab
rng(1)
setName = {'RB1','PIK3R1','EGFR','TP53','PTEN'};
setMat = rand([200, 5]) > 0.85;

% Create UpSet plot object with 'intersect' mode.
USP = UpSetPlot(setMat, 'SetName',setName, 'Mode','intersect');
USP.calc();
USP.draw();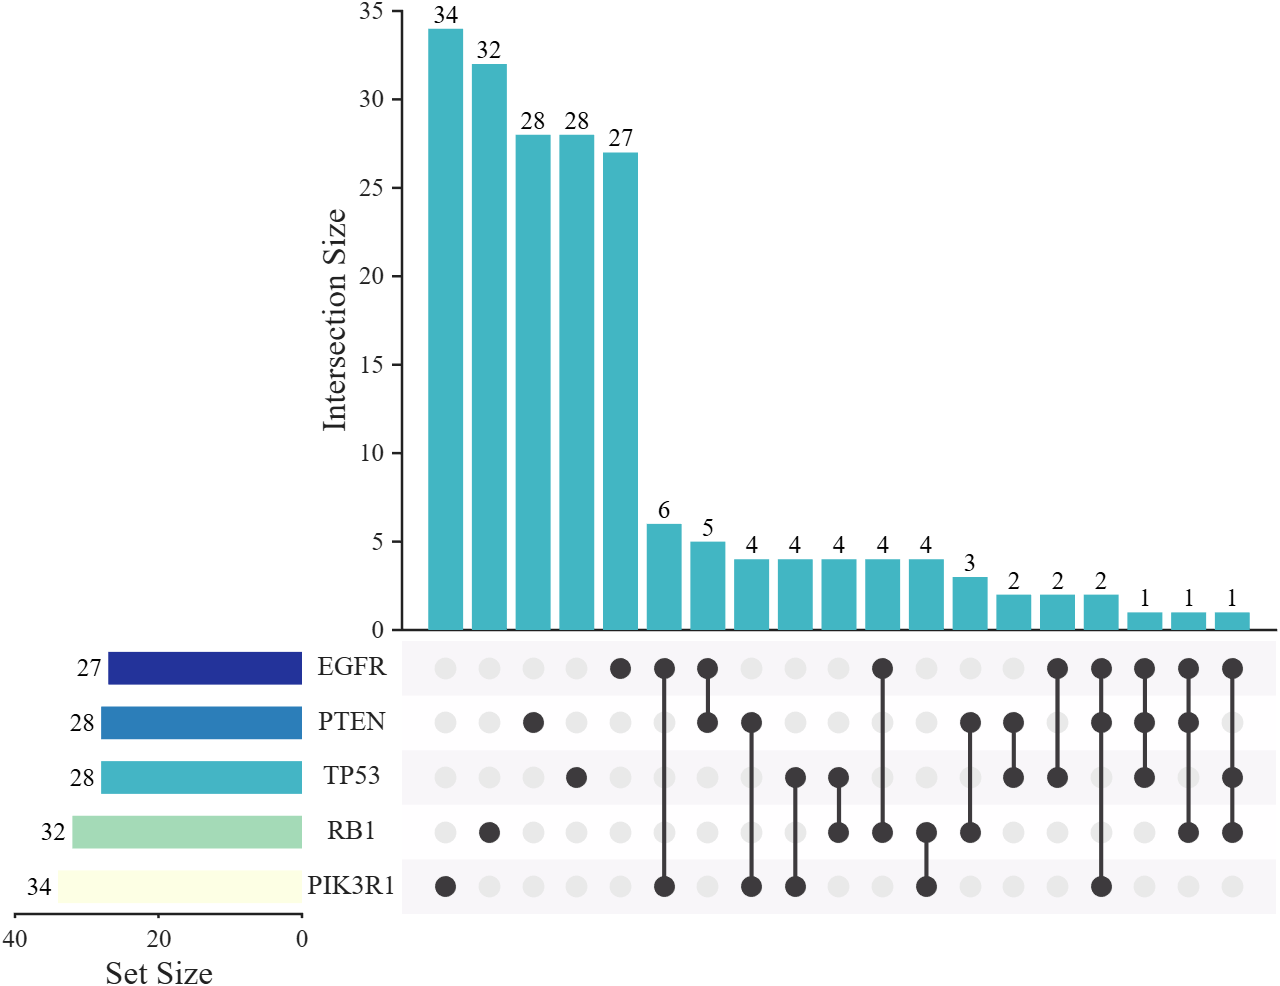
可以看到横着的柱状图和竖着的柱状图前几个柱子数值相同了。
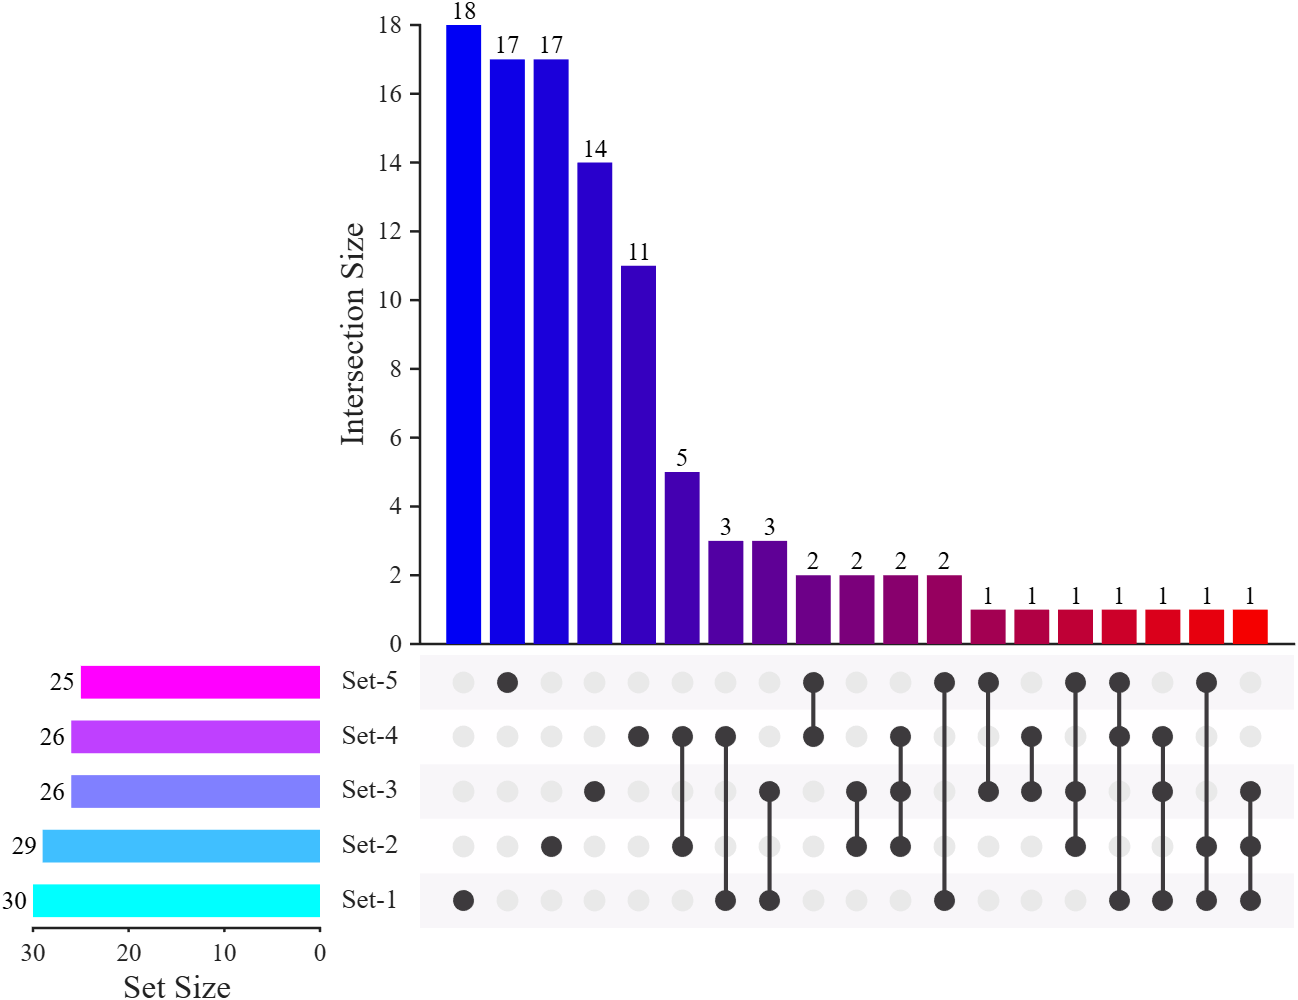
修改配色
matlab
rng(5)
setMat = rand([200, 5]) > 0.85;

USP = UpSetPlot(setMat);

% Grayscale color scheme
USP.BarColorI = [ 61, 58, 61]./255;
USP.BarColorS = [ 61, 58, 61]./255;
USP.LineColor = [ 61, 58, 61]./255;

% % Alternative color scheme
% USP.BarColorI = [  0,  0,245; 245,  0,  0]./255;
% USP.BarColorS = cool;
% USP.LineColor = [ 61, 58, 61]./255;

USP.calc();
USP.draw();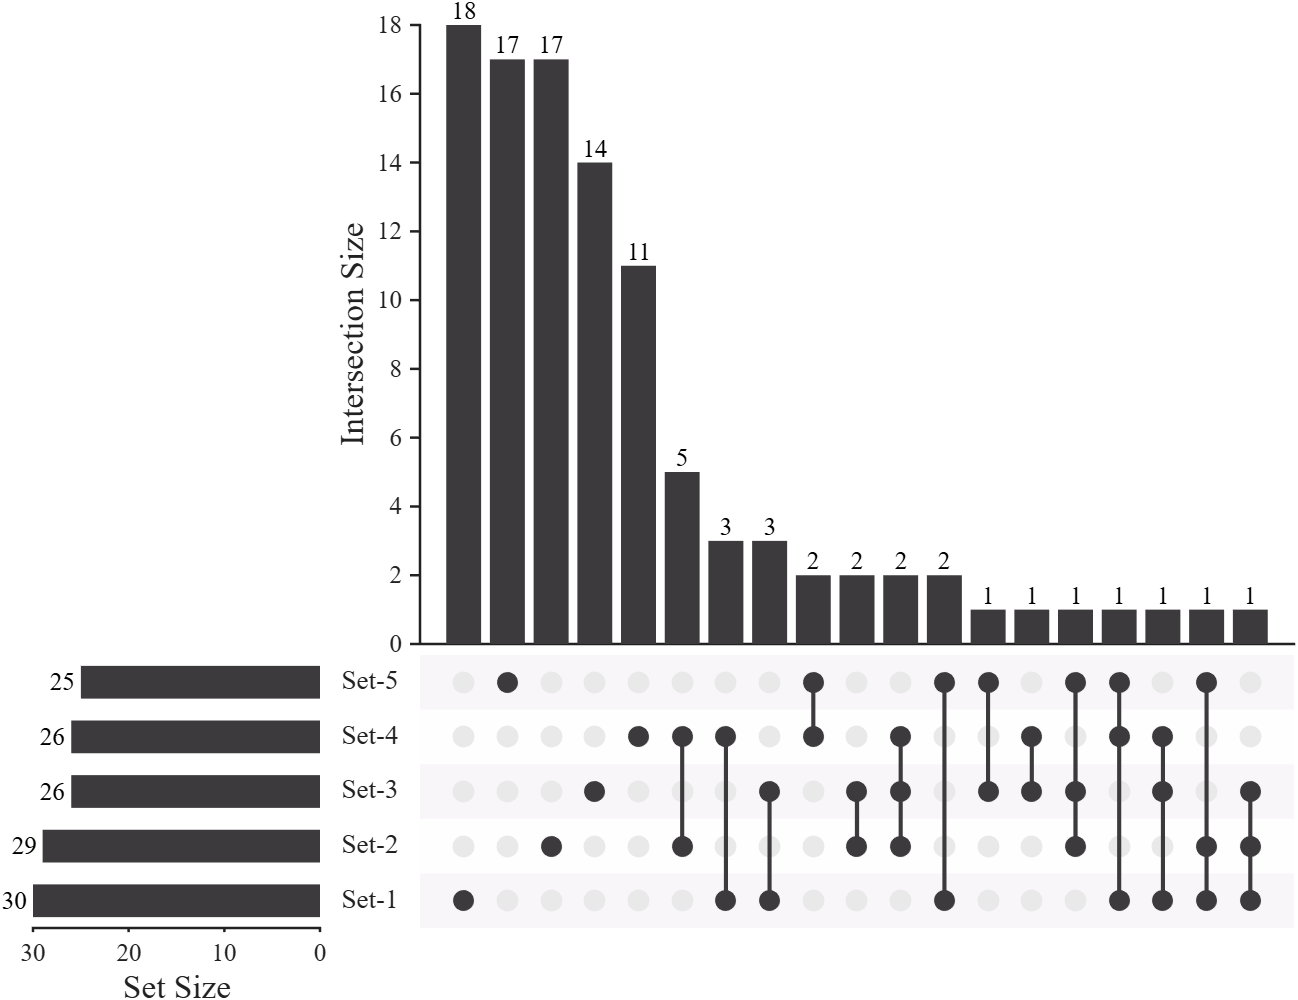
大数据集
目前应对上亿数据量且7个集合也很轻松:
matlab
rng(5)

% Generate large sparse binary matrix (100M samples, 7 sets).
setMat = rand([1e8, 7]) > 0.9;

USP = UpSetPlot(setMat);
USP.calc();

% Display only top 28 largest intersections to reduce clutter.
USP.draw(28);

% Extend X-axis limit by 40% to accommodate set-size labels.
USP.axS.XLim = USP.axS.XLim.*1.4;

% Rotate intersection-size labels to 50° to reduce label overlap.
for i = 1:length(USP.txtHdlI)
    set(USP.txtHdlI(i), 'Rotation', 50, 'HorizontalAlignment','left')
end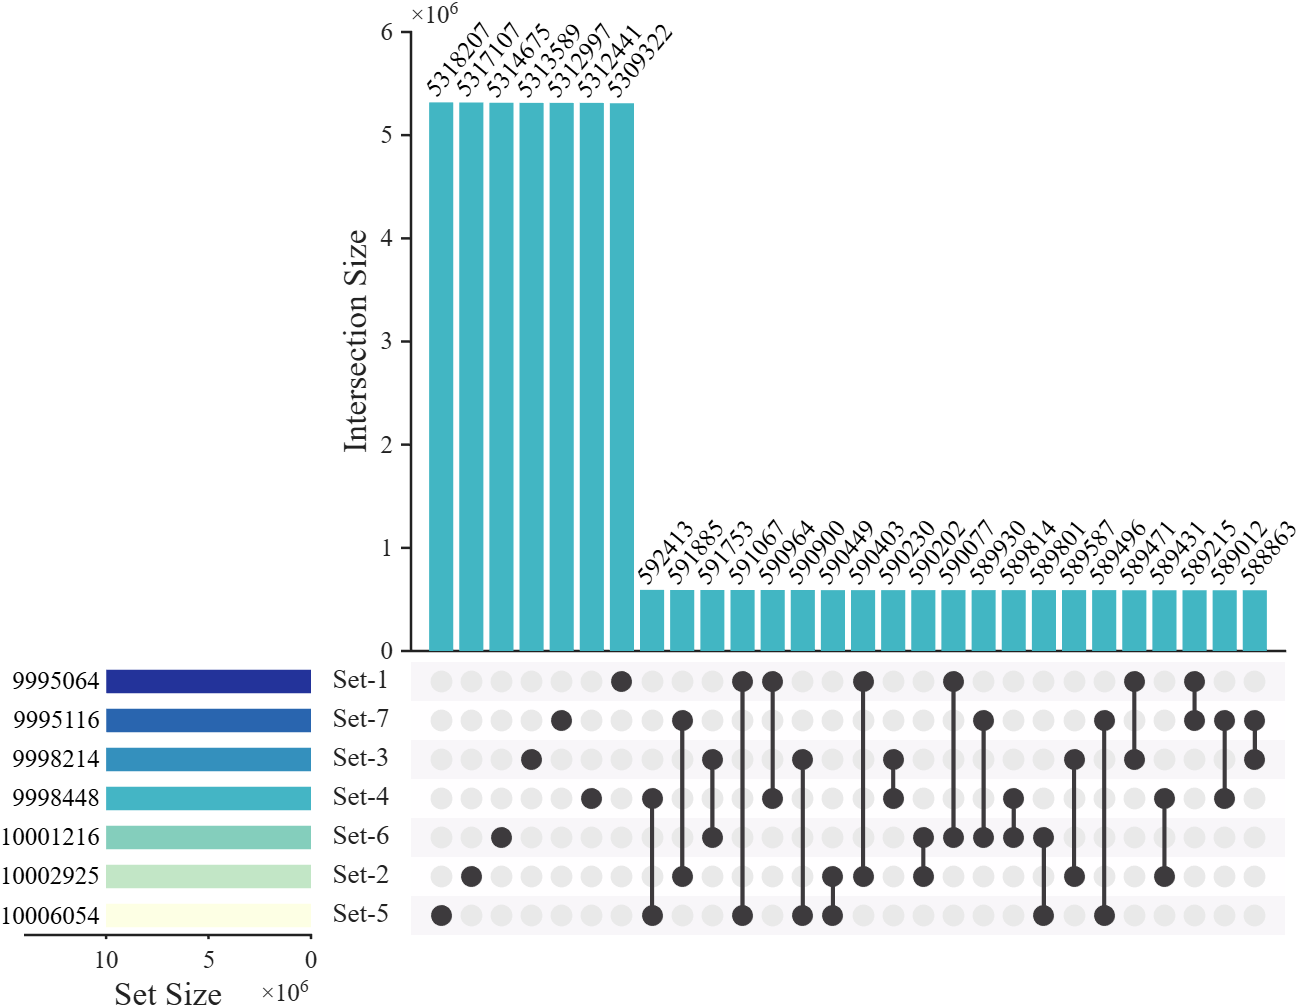
堆叠柱状图
例如,如果我们想展示更多属性(比如样本的性别,样本的年龄区间),可以使用堆叠柱状图。此时需要提供一个与数据集大小相同的列向量,向量中的每个数值表示该样本属于新属性中的哪一类,同时还需提供新属性的类别名称。下面是一个简单的示例:
matlab
rng(1)
% Define set names (5 categories).
setName = {'setS','setL','setA','setN','setD'};
% Generate random binary membership matrix (200 samples, 5 sets).
setMat = rand([200, 5]) > 0.85;
% Remove samples that do not belong to any set.
setMat = setMat(any(setMat, 2), :);

% Define property-related parameters.
propNum = 4;                                       % Number of property categories.
porpName = {'porpA','porpB','porpC','porpD'};      % Names of property categories.
propList = randi([1, 4], [size(setMat, 1), 1]);    % Random property assignment for each sample (1-4).
propCList = [.99, .85, .54; .55, .68, .34;         % Color List for stacked bar segments (RGB).
             .32, .38, .22; .30, .64, .69;
             .35, .55, .57; .22, .36, .37];

% Create UpSet plot object.
USP = UpSetPlot(setMat, 'SetName',setName);
USP.BarColorS = [.3, .3, .3];
USP.calc();    % Calculate intersection sizes.
USP.draw();    % Render the UpSet plot.

%% Stacked bar chart visualization of additional information
propMat = zeros([USP.nzNum, propNum]);
for i = 1:USP.nzNum
    for j = 1:propNum
        propMat(i, j) = sum(propList(USP.nzIndex(i) == USP.oriIndex) == j);
    end
end
delete(USP.barHdlI)
% Create stacked bar chart to show property composition within each intersection.
barHdl = bar(USP.axI, propMat, 'stacked', 'EdgeColor','none');
for i = 1:length(barHdl)
    barHdl(i).FaceColor = propCList(i, :);
end
legend(USP.axI, porpName, 'FontSize',13, 'FontName','Times New Roman', 'Direction','normal')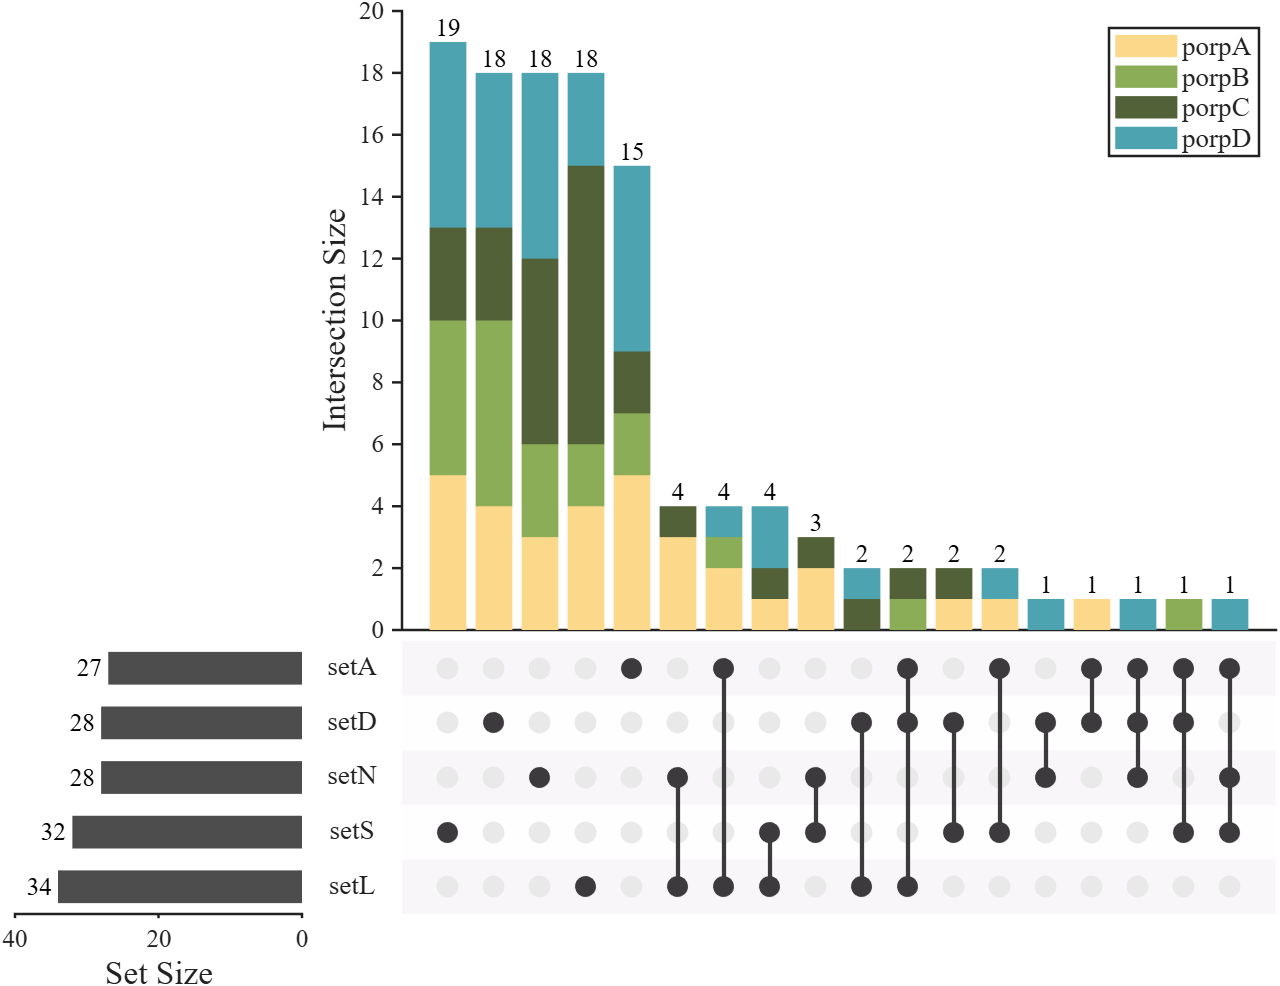
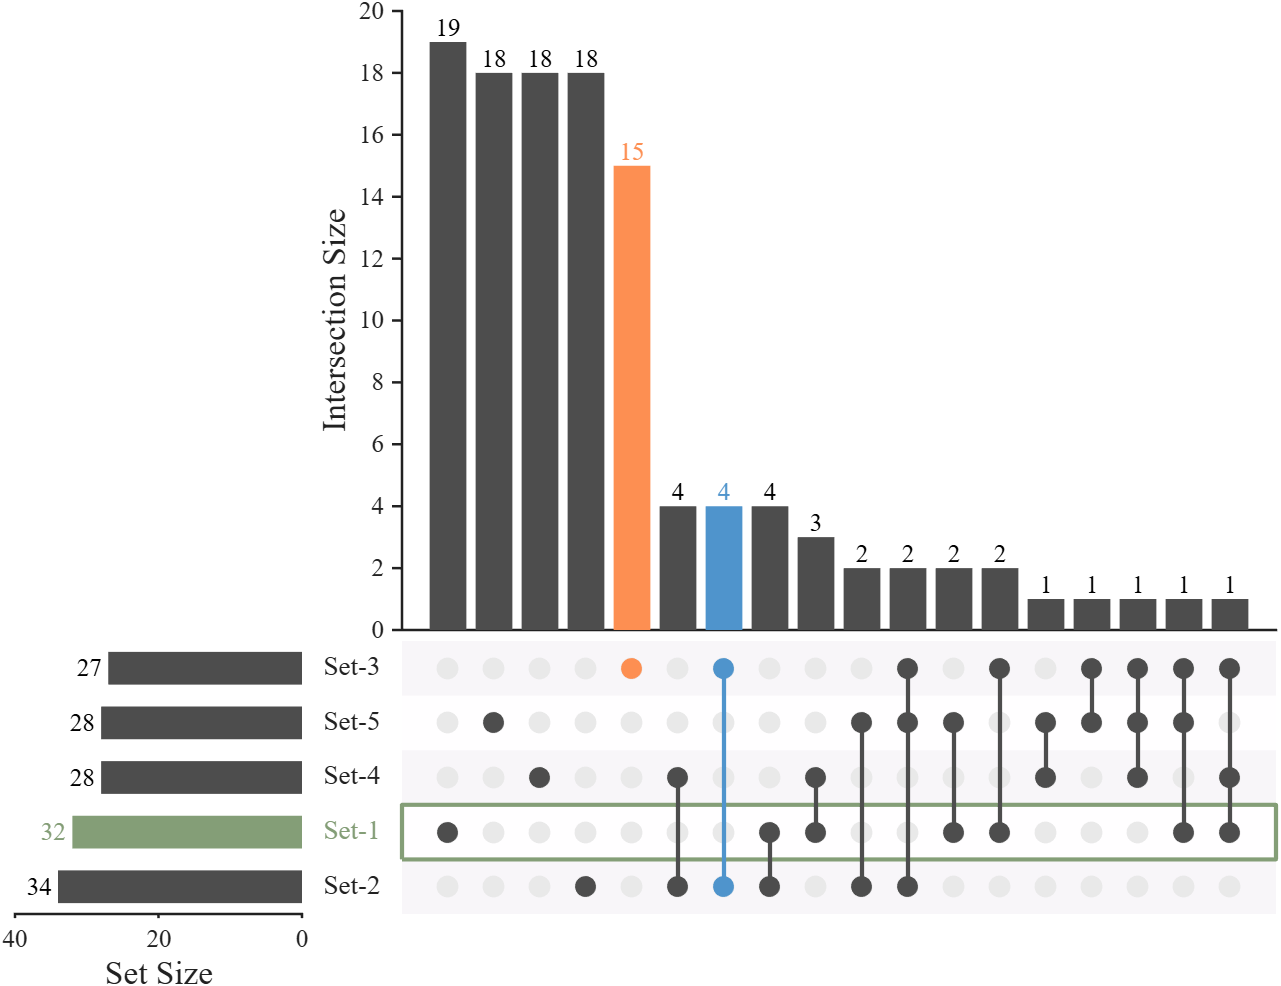
数据高亮
可以使用:
- obj.highlightI(n, Color) 进行竖向柱状图高亮
- obj.highlightS(n, Color) 进行横向柱状图高亮
matlab
rng(1)
% Define set names (5 categories).
setMat = rand([200, 5]) > 0.85;

% Create UpSet plot object.
USP = UpSetPlot(setMat);

% Grayscale color scheme
USP.BarColorI = [.3, .3, .3];
USP.BarColorS = [.3, .3, .3];
USP.LineColor = [.3, .3, .3];

USP.calc();
USP.draw();


% Highlight for intersection size bar chart
USP.highlightI(7, [79,148,204]./255)
USP.highlightI(5, [253,143,82]./255)

% Highlight for Set size bar chart
USP.highlightS(2, [132,158,119]./255)
结
工具函数代码可在以下三个仓库获取:
- 【fileexchange】https://www.mathworks.com/matlabcentral/fileexchange/123695-upset-plot
- 【gitee】https://gitee.com/slandarer/matlab-up-set-plot
- 【github】https://github.com/slandarer/MATLAB-UpSet-plot
以下是当前版本工具函数完整代码:在进行版本更新时大概率不会顺便更新此代码,因此建议去仓库获取。
matlab
classdef UpSetPlot < handle
% UpSetPlot: Visualization of set intersections.
%   Supports both 'distinct' (mutually exclusive) and 'intersect' (overlapping) modes.
% =========================================================================
% Basic usage
% -------------------------------------------------------------------------
% setMat = rand([200, 5]) > 0.85;
%
% USP = UpSetPlot(setMat);
% USP.calc();
% USP.draw();
% =========================================================================
% ## fileexchange
% Zhaoxu Liu / slandarer (2026). UpSet plot
% (https://www.mathworks.com/matlabcentral/fileexchange/123695-upset-plot),
% MATLAB Central File Exchange. Retrieved April 27, 2026.
% ## gitee
% https://gitee.com/slandarer/matlab-up-set-plot
% ## github
% https://github.com/slandarer/MATLAB-UpSet-plot

    properties
        arginList = {'SetName', 'Mode', 'BarColorI', 'BarColorS', 'LineColor'}
        fig = []     % Figure handle
        axI          % Axes for Intersection size bar chart.
        axS          % Axes for Set size horizontal bar chart.
        axC          % Axes for Connection matrix chart.


        SetNum  = 0
        SetName = {}
        SetMat       % Binary set matrix (samples × sets)
                     % ---------------------------------
                     %  A  B  C  sets
                     % [1  0  0] sample-1
                     % [0  1  0] sample-2
                     % [... ...] ... ...
                     % [0  0  1] sample-n
                     % ---------------------------------
                     %     -> 1 = sample belongs to set.
                     %     -> 0 = sample does not belong.

        Mode = 'distinct' % UpSet mode: 'distinct'(default) / 'intersect'
        % =================================================================
        BarColorI = [ 66,182,195]./255;
        BarColorS = [253,255,228; 164,218,183;  68,181,197;  44,126,185;  35, 51,154]./255;
        LineColor = [ 61, 58, 61]./255;
        % try:
        % BarColorI = [ 61, 58, 61]./255;
        % BarColorS = [ 61, 58, 61]./255;
        % LineColor = [ 61, 58, 61]./255;
        %
        % BarColorI = [  0,  0,245; 245,  0,  0]./255;
        % BarColorS = cool;
        % LineColor = [ 61, 58, 61]./255;

        PatchColor  = [248,246,249; 255,254,255]./255;
        BkgDotColor = [233,233,233]./255;
        % =================================================================
        sortSetSize, sortSetIndex,
        nzCount, nzIndex, nzNum, binCount,
        fulBool, decList, decCode, SetSize, oriIndex
        barHdlI, barHdlS, txtHdlI, txtHdlS, nameHdl,
        bkgEdgeHdl, olineHdl
    end

    methods
        function obj = UpSetPlot(varargin)
            if isa(varargin{1}, 'matlab.ui.Figure')
                obj.fig = varargin{1}; varargin(1) = [];
            end

            obj.SetMat = varargin{1};
            obj.SetNum = size(obj.SetMat, 2);
            varargin(1) = [];

            % Parse name-value input arguments.
            for i = 1:2:(length(varargin) - 1)
                tIndex = ismember(lower(obj.arginList), lower(varargin{i}));
                if any(tIndex)
                    obj.(obj.arginList{tIndex}) = varargin{i + 1};
                end
            end

            if isempty(obj.SetName) || (length(obj.SetName) < obj.SetNum)
                obj.SetName = compose('Set-%d', 1:obj.SetNum);
            end
        end

        function obj = calc(obj)
            % Binarize and remove all-zero rows
            obj.SetMat = obj.SetMat > 0;
            obj.SetMat = obj.SetMat(any(obj.SetMat, 2), :);

            obj.SetSize = sum(obj.SetMat, 1);

            % Generate all non-empty set combinations (2^n - 1)
            obj.fulBool = dec2bin(1:(2^obj.SetNum - 1)) - '0';

            % Convert each sample row to decimal code
            obj.decList = 2.^((obj.SetNum - 1) : -1 : 0).';
            obj.oriIndex = obj.SetMat*obj.decList;
            obj.decCode = sort(obj.oriIndex);

            % Count occurrences of each combination (distinct mode)
            obj.binCount = zeros(2^obj.SetNum - 1, 1);
            obj.binCount(unique(obj.decCode)) = diff([0; find([diff(obj.decCode); 1])]);

            % Convert to intersect mode if requested
            if strcmpi(obj.Mode, 'intersect')
                inclusion = (obj.fulBool * obj.fulBool.') == repmat(sum(obj.fulBool, 2), [1, 2^obj.SetNum - 1]);
                obj.binCount = inclusion * obj.binCount;
            end

            obj.nzIndex = 1:length(obj.binCount);
            obj.nzIndex = obj.nzIndex(obj.binCount > 0);
            obj.nzCount = obj.binCount(obj.binCount > 0);
            [obj.nzCount, tInd] = sort(obj.nzCount, 'descend');
            obj.nzIndex = obj.nzIndex(tInd);
            obj.nzNum = length(obj.nzIndex);

            obj.sortSetIndex = 1:obj.SetNum;
            [obj.sortSetSize, obj.sortSetIndex] = sort(obj.SetSize, 'descend');
        end

        function obj = draw(obj, MaxBars)
            if nargin < 2
                MaxBars = 25;
            end

            if isempty(obj.fig)
                obj.fig = figure('Units','normalized', 'Position',[.3, .2, .5, .63], 'Color',[1,1,1]);
            end

            % Axes for Intersection size bar chart.
            obj.axI = axes('Parent',obj.fig, 'NextPlot','add', 'Position',[.33, .35, .655, .59], ...
                'LineWidth',1.2, 'Box','off', 'TickDir','out', 'FontName','Times New Roman', ...
                'FontSize',12, 'XTick',[], 'XLim',[0, min(MaxBars, obj.nzNum) + 1]);
            obj.axI.YLabel.String = 'Intersection Size';
            obj.axI.YLabel.FontSize = 16;
            % Axes for Set size horizontal bar chart.
            obj.axS = axes('Parent',obj.fig, 'NextPlot','add', 'Position',[.04, .08, .215, .26], ...
                'LineWidth',1.2, 'Box','off', 'TickDir','out', 'FontName','Times New Roman', ...
                'FontSize',12, 'YColor','none', 'YLim',[.5, obj.SetNum + .5], ...
                'YAxisLocation','right', 'XDir','reverse', 'YTick',[]);
            obj.axS.XLabel.String = 'Set Size';
            obj.axS.XLabel.FontSize = 16;
            % Axes for Connection matrix chart.
            obj.axC = axes('Parent',obj.fig, 'NextPlot','add', 'Position',[.33, .08, .655, .26], ...
                'YColor','none', 'YLim',[.5, obj.SetNum + .5], ...
                'XColor','none', 'XLim',obj.axI.XLim);


            % ==== Plot intersection size bar chart =======================
            obj.barHdlI = bar(obj.axI, obj.nzCount(1:min(MaxBars, obj.nzNum)));
            obj.barHdlI.EdgeColor = 'none';
            % Apply color mapping to bars.
            if size(obj.BarColorI, 1) == 1
                obj.BarColorI = obj.BarColorI([1, 1], :);
            end
            tX = linspace(0, 1, size(obj.BarColorI, 1))';
            pX = linspace(0, 1, min(MaxBars, obj.nzNum));
            tC = interp1(tX, obj.BarColorI, pX);
            obj.barHdlI.FaceColor = 'flat';
            obj.barHdlI.CData = tC;
            % Add value labels above bars.
            obj.txtHdlI = text(obj.axI, 1:min(MaxBars, obj.nzNum), obj.nzCount(1:min(MaxBars, obj.nzNum)), ...
                string(obj.nzCount(1:min(MaxBars, obj.nzNum))), 'HorizontalAlignment','center', ...
                'VerticalAlignment','bottom', 'FontName','Times New Roman', 'FontSize',12, 'Color','k');


            % ==== Plot set size horizontal bar chart =====================
            obj.barHdlS = barh(obj.axS, obj.sortSetSize, 'BarWidth', .6);
            obj.barHdlS.EdgeColor = 'none';
            obj.barHdlS.BaseLine.Color = 'none';
            % Apply color mapping to horizontal bars.
            if size(obj.BarColorS, 1) == 1
                obj.BarColorS = obj.BarColorS([1, 1], :);
            end
            tX = linspace(0, 1, size(obj.BarColorS, 1))';
            pX = linspace(0, 1, obj.SetNum);
            tC = interp1(tX, obj.BarColorS, pX);
            obj.barHdlS.FaceColor = 'flat';
            obj.barHdlS.CData = tC;
            % Add set names as annotations.
            for i = 1:obj.SetNum
                obj.nameHdl(i) = annotation('textbox', [(obj.axS.Position(1) + obj.axS.Position(3) + obj.axI.Position(1))/2 - .02, ...
                     obj.axS.Position(2) + obj.axS.Position(4)./obj.SetNum.*(i - .5) - .02, .04, .04], ...
                    'String', obj.SetName{obj.sortSetIndex(i)}, 'HorizontalAlignment','center', 'VerticalAlignment','middle', ...
                    'FitBoxToText','on', 'LineStyle','none', 'FontName','Times New Roman', 'FontSize',13);
            end
            % Add value labels to the left of bars.
            obj.txtHdlS = text(obj.axS, obj.sortSetSize, 1:obj.SetNum, compose('%d ', obj.sortSetSize), 'HorizontalAlignment','right', ...
                'VerticalAlignment','middle', 'FontName','Times New Roman', 'FontSize',12, 'Color','k');


            % ==== Plot connection matrix chart ===========================
            % Background stripes for alternating rows.
            for i = 1:obj.SetNum
                fill(obj.axC, obj.axI.XLim([1,2,2,1]), [-.5, -.5, .5, .5] + i, ...
                    obj.PatchColor(mod(i+1, 2)+1, :), 'EdgeColor', 'none');
            end
            for i = 1:obj.SetNum
                obj.bkgEdgeHdl(i) = plot(obj.axC, obj.axI.XLim([1,2,2,1,1]), [-.5, -.5, .5, .5,-.5] + i, ...
                    'Color','none', 'LineWidth',2);
            end
            % Empty dots.
            [tX, tY] = meshgrid(1:min(MaxBars, obj.nzNum), 1:obj.SetNum);
            plot(obj.axC, tX(:), tY(:), 'o', 'Color',obj.BkgDotColor(1, :), ...
                'MarkerFaceColor',obj.BkgDotColor(1, :), 'MarkerSize',10);
            % Draw connection lines and filled dots for active combinations.
            for i = 1:min(MaxBars, obj.nzNum)
                tY = find(obj.fulBool(obj.nzIndex(i), obj.sortSetIndex));
                tX = tY.*0 + i;
                obj.olineHdl(i) = plot(obj.axC, tX, tY, '-o', 'Color',obj.LineColor(1, :), ...
                    'MarkerEdgeColor','none', 'MarkerFaceColor',obj.LineColor(1, :), ...
                    'MarkerSize',10, 'LineWidth',2);
            end

        end

        function highlightI(obj, n, Color)
            if nargin < 3
                Color = [.8, 0, 0];
            end
            obj.barHdlI.CData(n, :) = Color;
            set(obj.olineHdl(n), 'Color',Color, 'MarkerFaceColor',Color);
            set(obj.txtHdlI(n), 'Color',Color);
        end

        function highlightS(obj, n, Color)
            if nargin < 3
                Color = [.8, 0, 0];
            end
            obj.barHdlS.CData(n, :) = Color;
            set(obj.txtHdlS(n), 'Color',Color);
            set(obj.nameHdl(n), 'Color',Color);
            set(obj.bkgEdgeHdl(n), 'Color',Color);
        end
    end
end