📌 学习目标
- 掌握用Markers添加自定义图标的实现方法
- 理解相关API的使用
- 能够独立完成类似功能开发
⭕️👉课程完整目录⬅️⭕️
🎯 核心概念
使用Markers向地图添加自定义图标。
💻 完 整 代 码
代码示例
js
const geojson = {
    'type': 'FeatureCollection',
    'features': [
        {
            'type': 'Feature',
            'properties': {
                'message': 'Foo',
                'iconSize': [60, 60]
            },
            'geometry': {
                'type': 'Point',
                'coordinates': [-66.324462890625, -16.024695711685304]
            }
        },
        {
            'type': 'Feature',
            'properties': {
                'message': 'Bar',
                'iconSize': [50, 50]
            },
            'geometry': {
                'type': 'Point',
                'coordinates': [-61.2158203125, -15.97189158092897]
            }
        },
        {
            'type': 'Feature',
            'properties': {
                'message': 'Baz',
                'iconSize': [40, 40]
            },
            'geometry': {
                'type': 'Point',
                'coordinates': [-63.29223632812499, -18.28151823530889]
            }
        }
    ]
};

const map = new maplibregl.Map({
    container: 'map',
    style: 'https://demotiles.maplibre.org/style.json',
    center: [-65.017, -16.457],
    zoom: 5
});

// 向地图添加Markers图标
geojson.features.forEach((marker) => {
    // 创建Markers图标DOM元素
    const el = document.createElement('div');
    el.className = 'marker';
    el.style.backgroundImage =
        `url(https://picsum.photos/${
            marker.properties.iconSize.join('/')
        }/)`;
    el.style.width = `${marker.properties.iconSize[0]}px`;
    el.style.height = `${marker.properties.iconSize[1]}px`;

    el.addEventListener('click', () => {
        window.alert(marker.properties.message);
    });

    // 向地图添加Markers图标
    new maplibregl.Marker({element: el})
        .setLngLat(marker.geometry.coordinates)
        .addTo(map);
});
代码示例
html
<!DOCTYPE html>
<html lang="en">
<head>
    <title>Add custom icons with Markers</title>
    <meta property="og:description" content="向地图添加自定义标记图标。" />
    <meta property="og:created" content="2025-06-25" />
    <meta charset='utf-8'>
    <meta name="viewport" content="width=device-width, initial-scale=1">
    <link rel='stylesheet' href='https://unpkg.com/maplibre-gl@5.24.0/dist/maplibre-gl.css' />
    <script src='https://unpkg.com/maplibre-gl@5.24.0/dist/maplibre-gl.js'></script>
    <style>
        body { margin: 0; padding: 0; }
        html, body, #map { height: 100%; }
    </style>
</head>
<body>
<style>
    .marker {
        display: block;
        border: none;
        border-radius: 50%;
        cursor: pointer;
        padding: 0;
    }
</style>

<div id="map"></div>

<script>
    const geojson = {
        'type': 'FeatureCollection',
        'features': [
            {
                'type': 'Feature',
                'properties': {
                    'message': 'Foo',
                    'iconSize': [60, 60]
                },
                'geometry': {
                    'type': 'Point',
                    'coordinates': [-66.324462890625, -16.024695711685304]
                }
            },
            {
                'type': 'Feature',
                'properties': {
                    'message': 'Bar',
                    'iconSize': [50, 50]
                },
                'geometry': {
                    'type': 'Point',
                    'coordinates': [-61.2158203125, -15.97189158092897]
                }
            },
            {
                'type': 'Feature',
                'properties': {
                    'message': 'Baz',
                    'iconSize': [40, 40]
                },
                'geometry': {
                    'type': 'Point',
                    'coordinates': [-63.29223632812499, -18.28151823530889]
                }
            }
        ]
    };

    const map = new maplibregl.Map({
        container: 'map',
        style: 'https://demotiles.maplibre.org/style.json',
        center: [-65.017, -16.457],
        zoom: 5
    });

    // 向地图添加标记
    geojson.features.forEach((marker) => {
        // 为标记创建一个DOM元素
        const el = document.createElement('div');
        el.className = 'marker';
        el.style.backgroundImage =
            `url(https://picsum.photos/${
                marker.properties.iconSize.join('/')
            }/)`;
        el.style.width = `${marker.properties.iconSize[0]}px`;
        el.style.height = `${marker.properties.iconSize[1]}px`;

        el.addEventListener('click', () => {
            window.alert(marker.properties.message);
        });

        // 将标记添加到地图
        new maplibregl.Marker({element: el})
            .setLngLat(marker.geometry.coordinates)
            .addTo(map);
    });
</script>
</body>
</html>
🔍 代码解析
初始化地图
使用 new maplibregl.Map() 创建地图实例,配置基本参数。本示例的核心特色是展示如何使用 maplibregl.Marker 添加自定义DOM元素作为地图标记。
关键配置项
- container: 地图容器的 DOM 元素 ID
- style : 使用 MapLibre 官方样式
https://demotiles.maplibre.org/style.json - center : 地图初始中心点
[-65.017, -16.457](南美洲区域) - zoom: 初始缩放级别为 5,显示区域级别视图
创建自定义DOM元素
javascript
const el = document.createElement('div');
el.className = 'marker';
el.style.backgroundImage = `url(https://picsum.photos/${marker.properties.iconSize.join('/')}/)`;
el.style.width = `${marker.properties.iconSize[0]}px`;
el.style.height = `${marker.properties.iconSize[1]}px`;

el.addEventListener('click', () => {
    window.alert(marker.properties.message);
});
添加Marker到地图
javascript
new maplibregl.Marker({element: el})
    .setLngLat(marker.geometry.coordinates)
    .addTo(map);
Marker CSS样式
css
.marker {
    display: block;
    border: none;
    border-radius: 50%;
    cursor: pointer;
    padding: 0;
}
⚙️ 参数说明
| 参数 | 类型 | 必填 | 默认值 | 说明 |
|---|---|---|---|---|
| container | string | 是 | - | 地图容器元素的 ID |
| style | string/object | 是 | - | 地图样式 URL 或内联样式对象 |
| center | number, number | 否 | [0, 0] |
初始中心点坐标 |
| zoom | number | 否 | 0 |
初始缩放级别 |
Marker 构造参数
| 参数 | 类型 | 必填 | 说明 |
|---|---|---|---|
| element | HTMLElement | 否 | 自定义 DOM 元素,不提供则使用默认标记 |
| anchor | string | 否 | 锚点位置,默认 center |
Marker 方法
| 方法 | 说明 |
|---|---|
setLngLat(lnglat) |
设置标记位置 |
addTo(map) |
将标记添加到地图 |
remove() |
从地图移除标记 |
🎨 效果说明
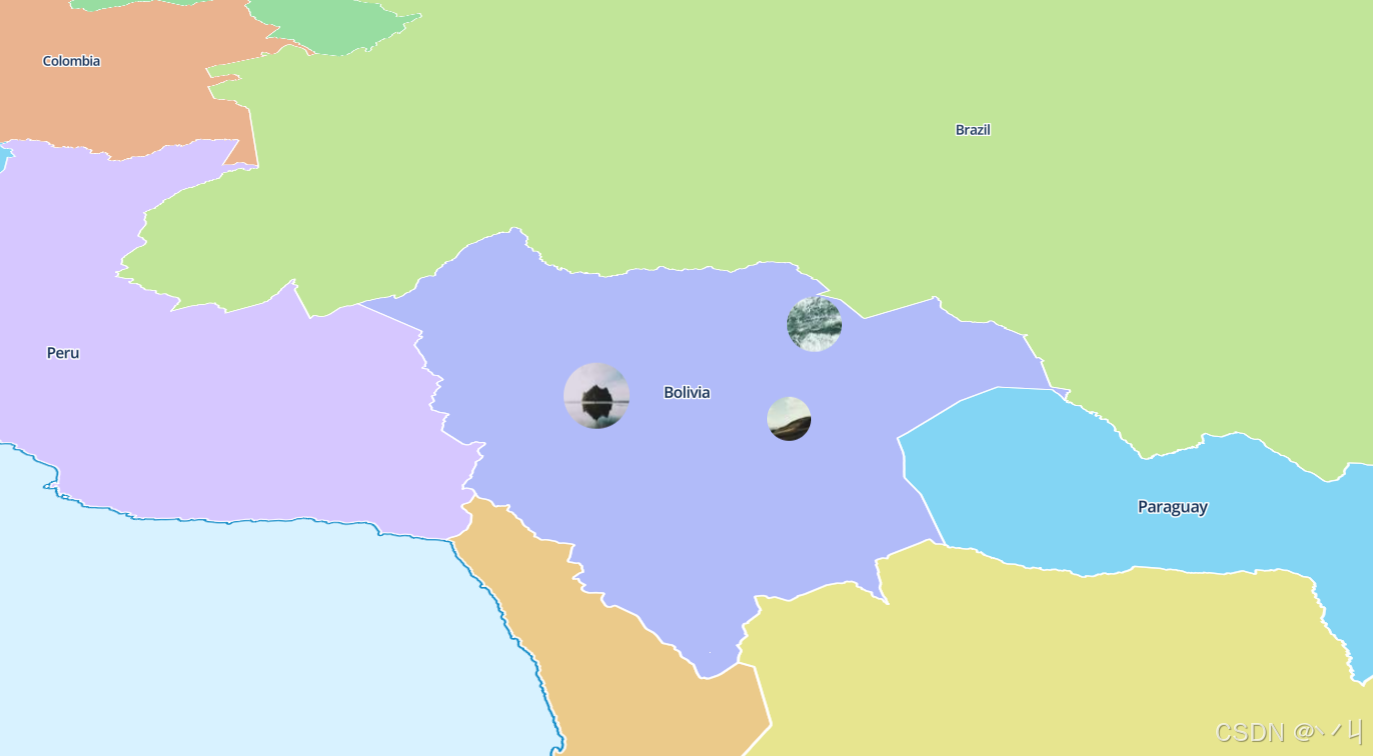


运行代码后,地图上会显示三个圆形图标标记:
- Foo : 坐标
[-66.32, -16.02],图标大小 60x60 像素 - Bar : 坐标
[-61.22, -15.97],图标大小 50x50 像素 - Baz : 坐标
[-63.29, -18.28],图标大小 40x40 像素
交互功能:
- 点击图标会弹出对应的消息(Foo、Bar 或 Baz)
- 图标显示为圆形(通过
border-radius: 50%) - 支持鼠标拖拽、滚轮缩放等标准地图交互
💡 常 见 问 题
Q1: Marker 和符号图层有什么区别?
A: Marker 是 DOM 元素,适合少量标记和复杂交互;符号图层是 WebGL 渲染,适合大量标记和高性能场景。
Q2: 如何调整 Marker 的锚点位置?
A: 在创建 Marker 时传入 anchor 参数:
javascript
new maplibregl.Marker({element: el, anchor: 'bottom'})Q3: 如何移除 Marker?
A: 调用 Marker 实例的 remove() 方法:
javascript
const marker = new maplibregl.Marker({element: el}).addTo(map);
marker.remove();
Q4: 可以给 Marker 添加弹窗吗?
A: 可以,使用 setPopup() 方法:
javascript
new maplibregl.Marker({element: el})
    .setPopup(new maplibregl.Popup().setHTML('<h3>标题</h3>'))
    .addTo(map);
📝 练习任务
- 基础练习:修改图标的大小和形状,观察效果
- 进阶挑战:为每个 Marker 添加不同颜色的边框
- 拓展思考:如何实现 Marker 的拖拽功能?
🌟 最佳实践
- 性能考虑: 大量标记(>100)建议使用符号图层而非 Marker
- 样式统一: 使用 CSS class 而非内联样式管理 Marker 外观
- 事件委托: 对于多个 Marker,考虑使用事件委托优化性能
- 响应式设计 : 使用
position:absolute和transform确保 Marker 定位准确 - 清理资源: 在地图销毁时移除所有 Marker
- 可访问性: 为 Marker 添加适当的 ARIA 属性和 tabindex
🔗 延伸阅读
-
下一课预告:将继续学习地图图层的基础知识
本文是MapLibre GL JS实践课程系列的一部分,欢迎关注收藏