上一次我们介绍了如何开发一个简易的 prometheus 监控 openGauss 指标,麻雀虽小五脏俱全。要想真正的把指标监控起来,还需要 Prometheus 能监控我们新增的指标,下面将主要介绍两部分的内容:
- 使用 Docker 运行 Prometheus
- Prometheus 中添加 Target
使用 Docker 运行 Prometheus
DockerHub 中搜索 Prometheus 有很多相关的镜像,本次示例使用 ubuntu/prometheus:2.25-21.04_beta,选好镜像就可以运行了。
Go
docker run -d --name prometheus -p 30090:9090 ubuntu/prometheus:2.25-21.04_beta因为我本地的 9090 端口已经运行了其他的服务,所以选择了一个其他没有被占用的端口,不然会报错,Ports are not available
Go
PS D:\workspace\demo\opengauss_exporter> docker run -d --name prometheus -p 9090:9090 ubuntu/prometheus:2.25-21.04_beta
18c6721082306f919448b7cf1337cd5e3cebb475ee27053873ef8251cb825cc5
docker: Error response from daemon: Ports are not available: listen tcp 0.0.0.0:9090: bind: Only one usage of each socket address (protocol/network address/port) is normally permitted.
正运行之后,可以直接在浏览器中输入 http://127.0.0.1:30090 ,能够正常打开页面说明已经正确启动了 Prometheus。
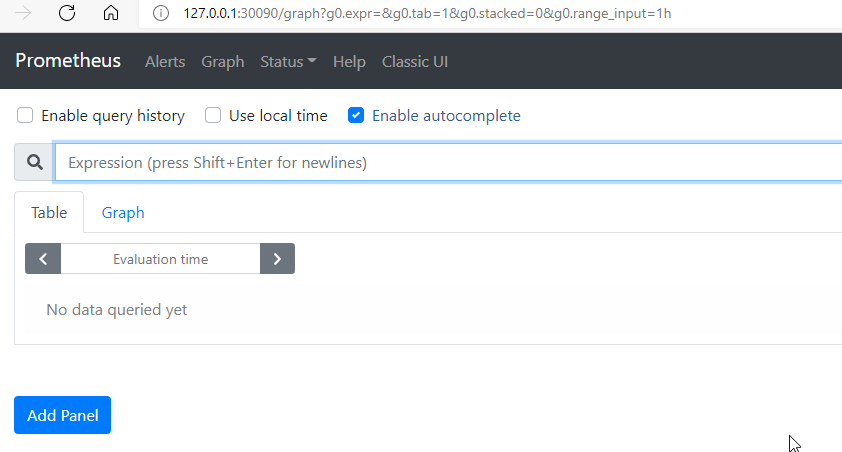
又一个问题来了,虽然已经启动,但是还是无法查看我们自定的指标,如何把自定义的指标加入到 Promentheus 中呢?
Prometheus 中添加 Target
因为是以 Docker 方式运行,直接在 Docker 中修改文件这条路是不通的,怎么办呢?我这里提供两种解决方案:
- 挂载文件方式
- 自定义镜像
本次只介绍 自定义镜像 的方式修改配置文件,具体操作步骤如下:
- 创建一个 prometheus.yml 文件,
- 创建 Dockerfile 文件
- 添加 COPY 命令,复制 prometheus.yml 文件到镜像的 /etc/prometheus/prometheus.yml
- 构建镜像
示例 prometheus.yml 内容
cs
global:
  scrape_interval:     15s
  evaluation_interval: 15s

alerting:
  alertmanagers:
  - static_configs:
    - targets:

rule_files:

scrape_configs:
  - job_name: 'prometheus'
    static_configs:
    - targets:
      - localhost:9090
      - 192.168.3.205:9101 # 请查看自己本机 IP 以及运行 metric 的端口,按实际填写
示例 Dockerfile 内容
Go
FROM ubuntu/prometheus:2.25-21.04_beta
COPY prometheus.yml /etc/prometheus/prometheus.yml
示例 构建镜像,docker build -t prometheus-gs .
Go
PS D:\workspace\demo\opengauss_exporter> docker build -t prometheus-gs .
[+] Building 0.1s (7/7) FINISHED
 => [internal] load build definition from Dockerfile                                                                                                                                                               0.0s
 => => transferring dockerfile: 481B                                                                                                                                                                               0.0s
 => [internal] load .dockerignore                                                                                                                                                                                  0.0s
 => => transferring context: 2B                                                                                                                                                                                    0.0s
 => [internal] load metadata for docker.io/ubuntu/prometheus:2.25-21.04_beta                                                                                                                                       0.0s
 => [internal] load build context                                                                                                                                                                                  0.0s
 => => transferring context: 36B                                                                                                                                                                                   0.0s
 => CACHED [1/2] FROM docker.io/ubuntu/prometheus:2.25-21.04_beta                                                                                                                                                  0.0s
 => [2/2] COPY prometheus.yml /etc/prometheus/prometheus.yml                                                                                                                                                       0.0s
 => exporting to image                                                                                                                                                                                             0.0s
 => => exporting layers                                                                                                                                                                                            0.0s
 => => writing image sha256:18de8748c8eac70dc3918fbe37893a172cc044efb54925597b9a36bfb8eaccde                                                                                                                       0.0s
 => => naming to docker.io/library/prometheus-gs                                                                                                                                                                   0.0s

Use 'docker scan' to run Snyk tests against images to find vulnerabilities and learn how to fix them
PS D:\workspace\demo\opengauss_exporter>注意,这里是要把 prometheus.yml 和 Dockerfile 放在同一个目录下。
通过新的镜像运行 Prometheus,docker run -d --name prometheus-gs -p 30090:9090 prometheus-gs
Go
PS D:\workspace\demo\opengauss_exporter> docker run -d --name prometheus-gs -p 30090:9090 prometheus-gs
bf16322611291fe28c1a02f55953a1a6de972094e9947b02bd22aac11c29b9b7
PS D:\workspace\demo\opengauss_exporter> docker ps
CONTAINER ID   IMAGE                       COMMAND                  CREATED         STATUS          PORTS                                         NAMES
bf1632261129   prometheus-gs               "/usr/bin/prometheus..."   9 seconds ago   Up 8 seconds    0.0.0.0:30090->9090/tcp, :::30090->9090/tcp   prometheus-gs
c781ed7fe975   enmotech/opengauss:latest   "entrypoint.sh gauss..."   2 weeks ago     Up 21 minutes   0.0.0.0:5432->5432/tcp, :::5432->5432/tcp     opengauss
PS D:\workspace\demo\opengauss_exporter>
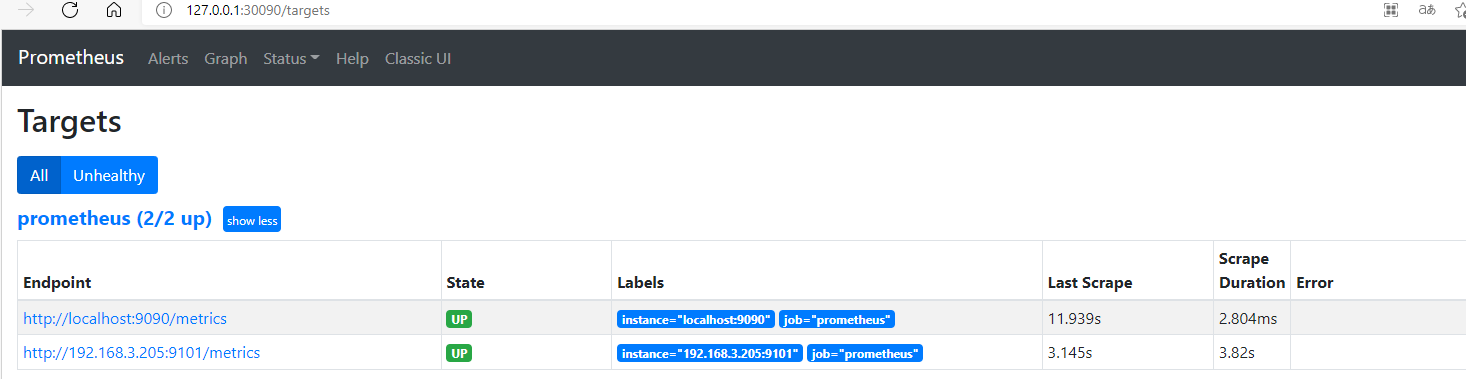
现在再打开 Prometheus,定位到 Target, http://127.0.0.1:30090/targets, 如果刚才新加的 target 也出现了,就说明成功的将新的指标加入到了 Prometheus 中。
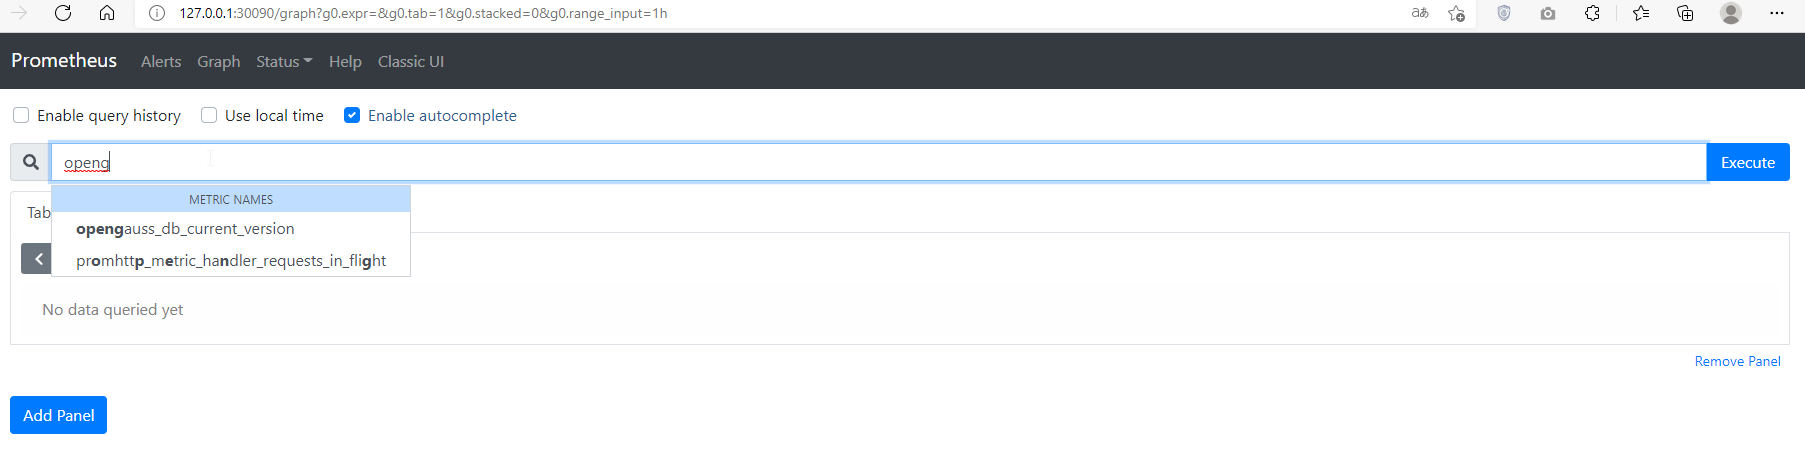
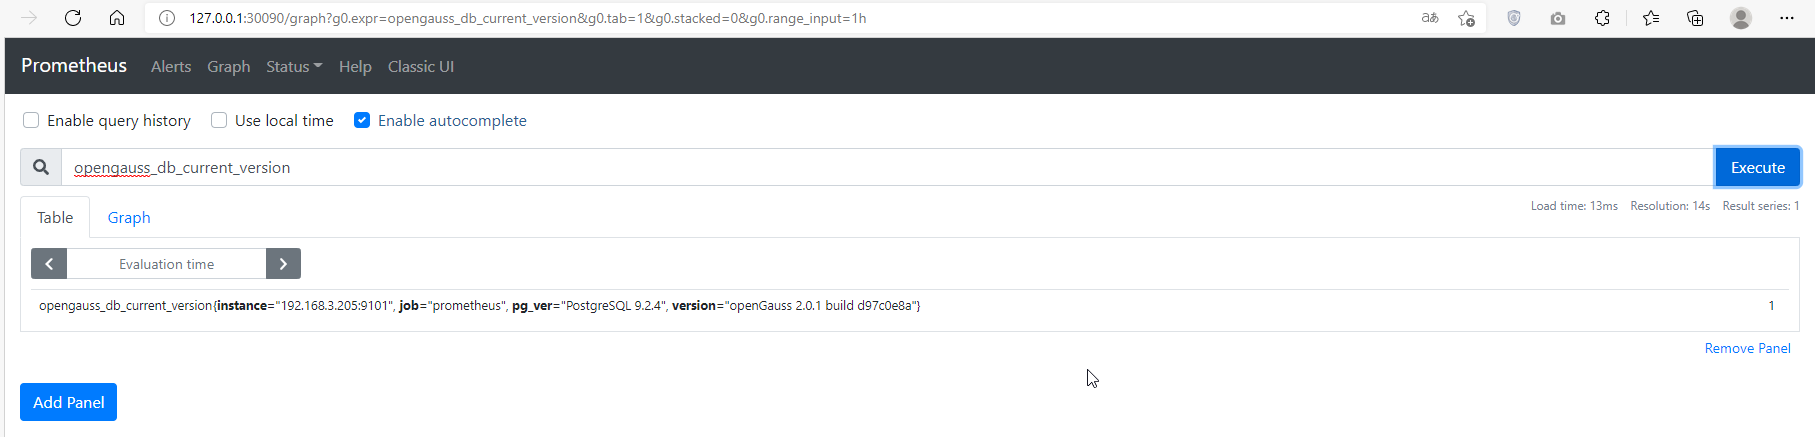
已经可以在 graph http://127.0.0.1:30090/graph 下面查看我们新增的指标了,在输入框中输入关键字,系统将会提示出相关的指标,然后再执行,就可以看到数据了。
转载:华为云论坛