大家好,我是Java1234_小锋老师,分享一套锋哥原创的基于Spark实时交通流量分析与拥堵预测系统(Java版本+可视化大屏+Kafka+SpringBoot+Vue3)
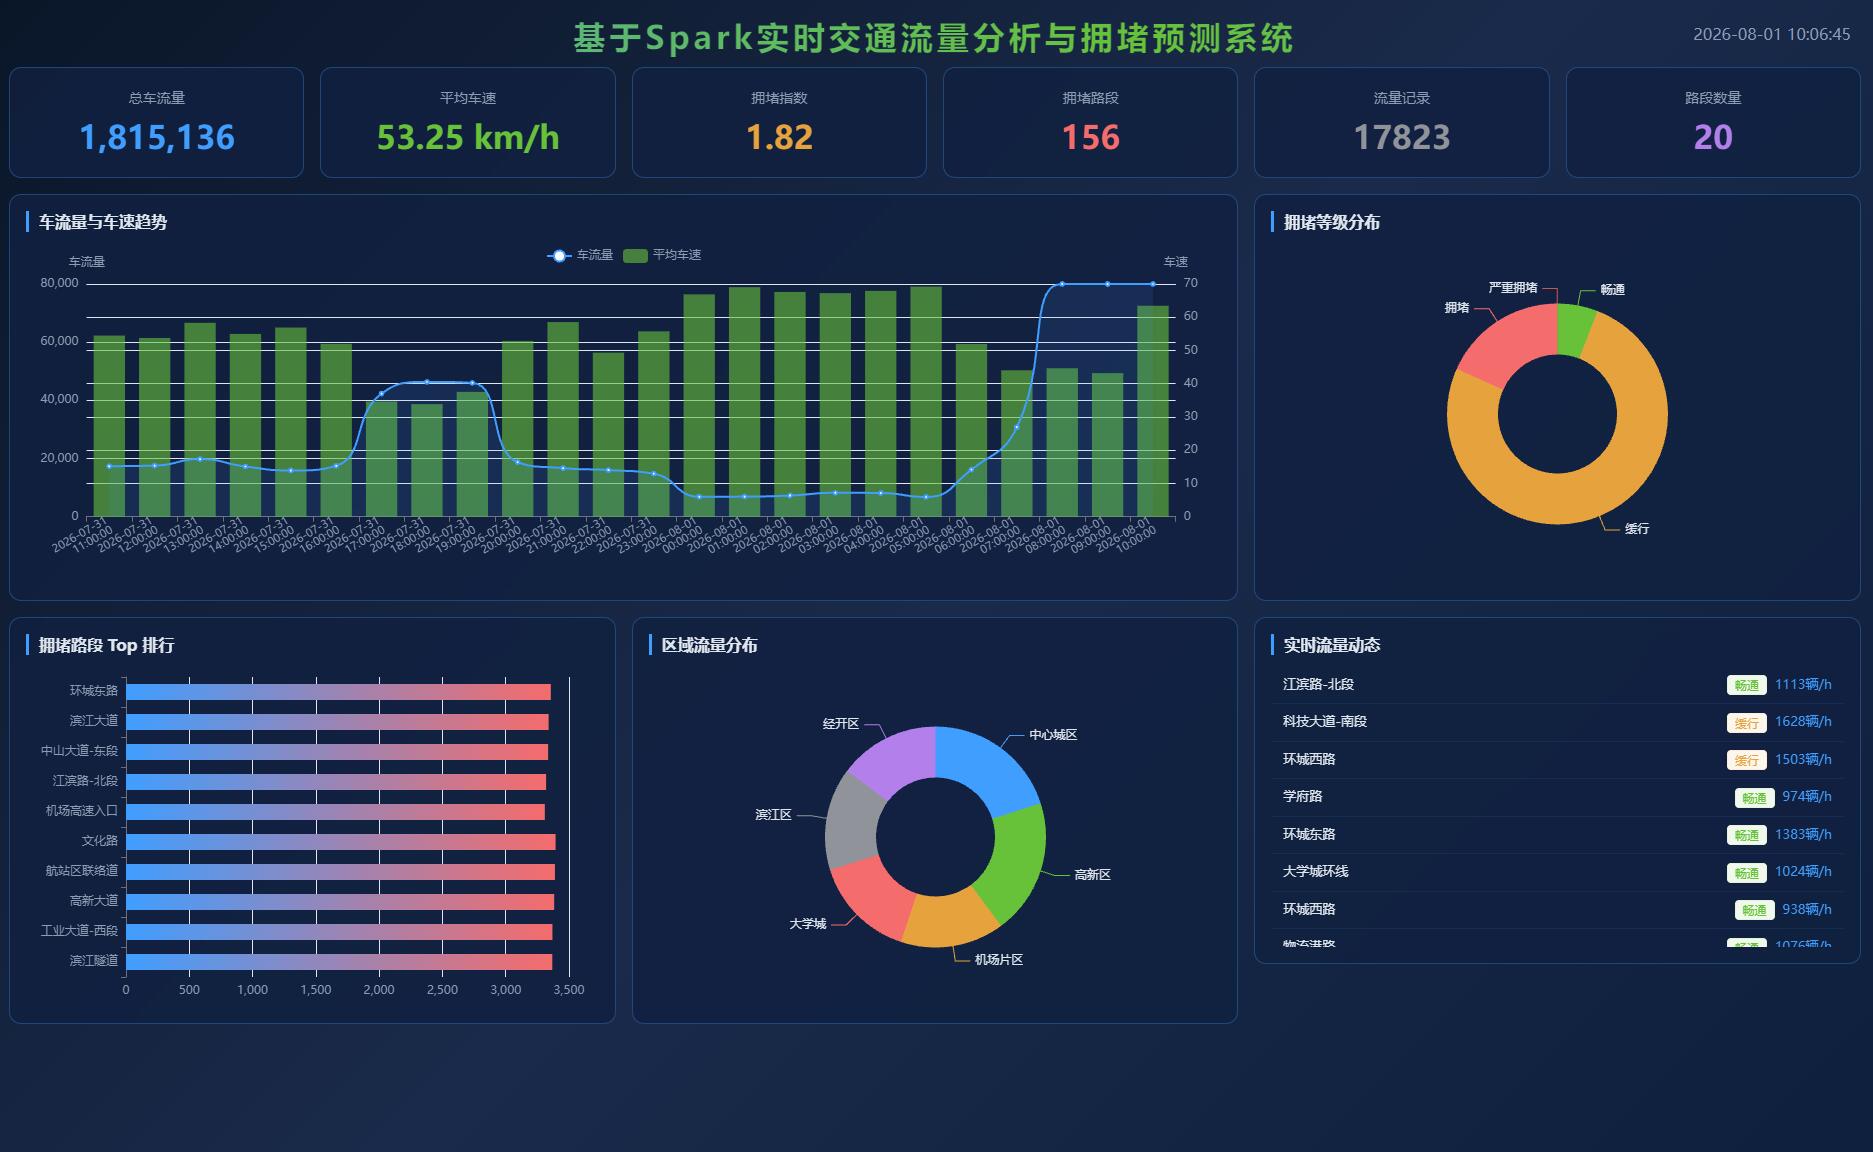
项目介绍
随着城市化进程不断加快,机动车保有量持续上升,城市道路拥堵问题日益突出。传统交通管理系统多依赖人工巡查与事后统计,难以对海量、高速产生的交通流数据进行实时感知与趋势研判,导致调度决策滞后。为缓解上述问题,本文设计并实现了一套"基于Spark实时交通流量分析与拥堵预测系统"。系统采用前后端分离架构:前端基于Vue3、Vite、Element Plus与ECharts构建管理后台与可视化大屏;后端基于Java 17与Spring Boot 3提供REST接口,结合Spring Security与JWT完成管理员身份认证与权限控制;数据层使用MySQL 8存储路段、流量、统计与预测结果,持久层采用MyBatis-Plus;实时链路引入Kafka作为交通事件消息中间件,使用Apache Spark完成窗口聚合统计,并基于Spark ML线性回归实现车流量预测与误差评估(RMSE、MAE、MAPE)。
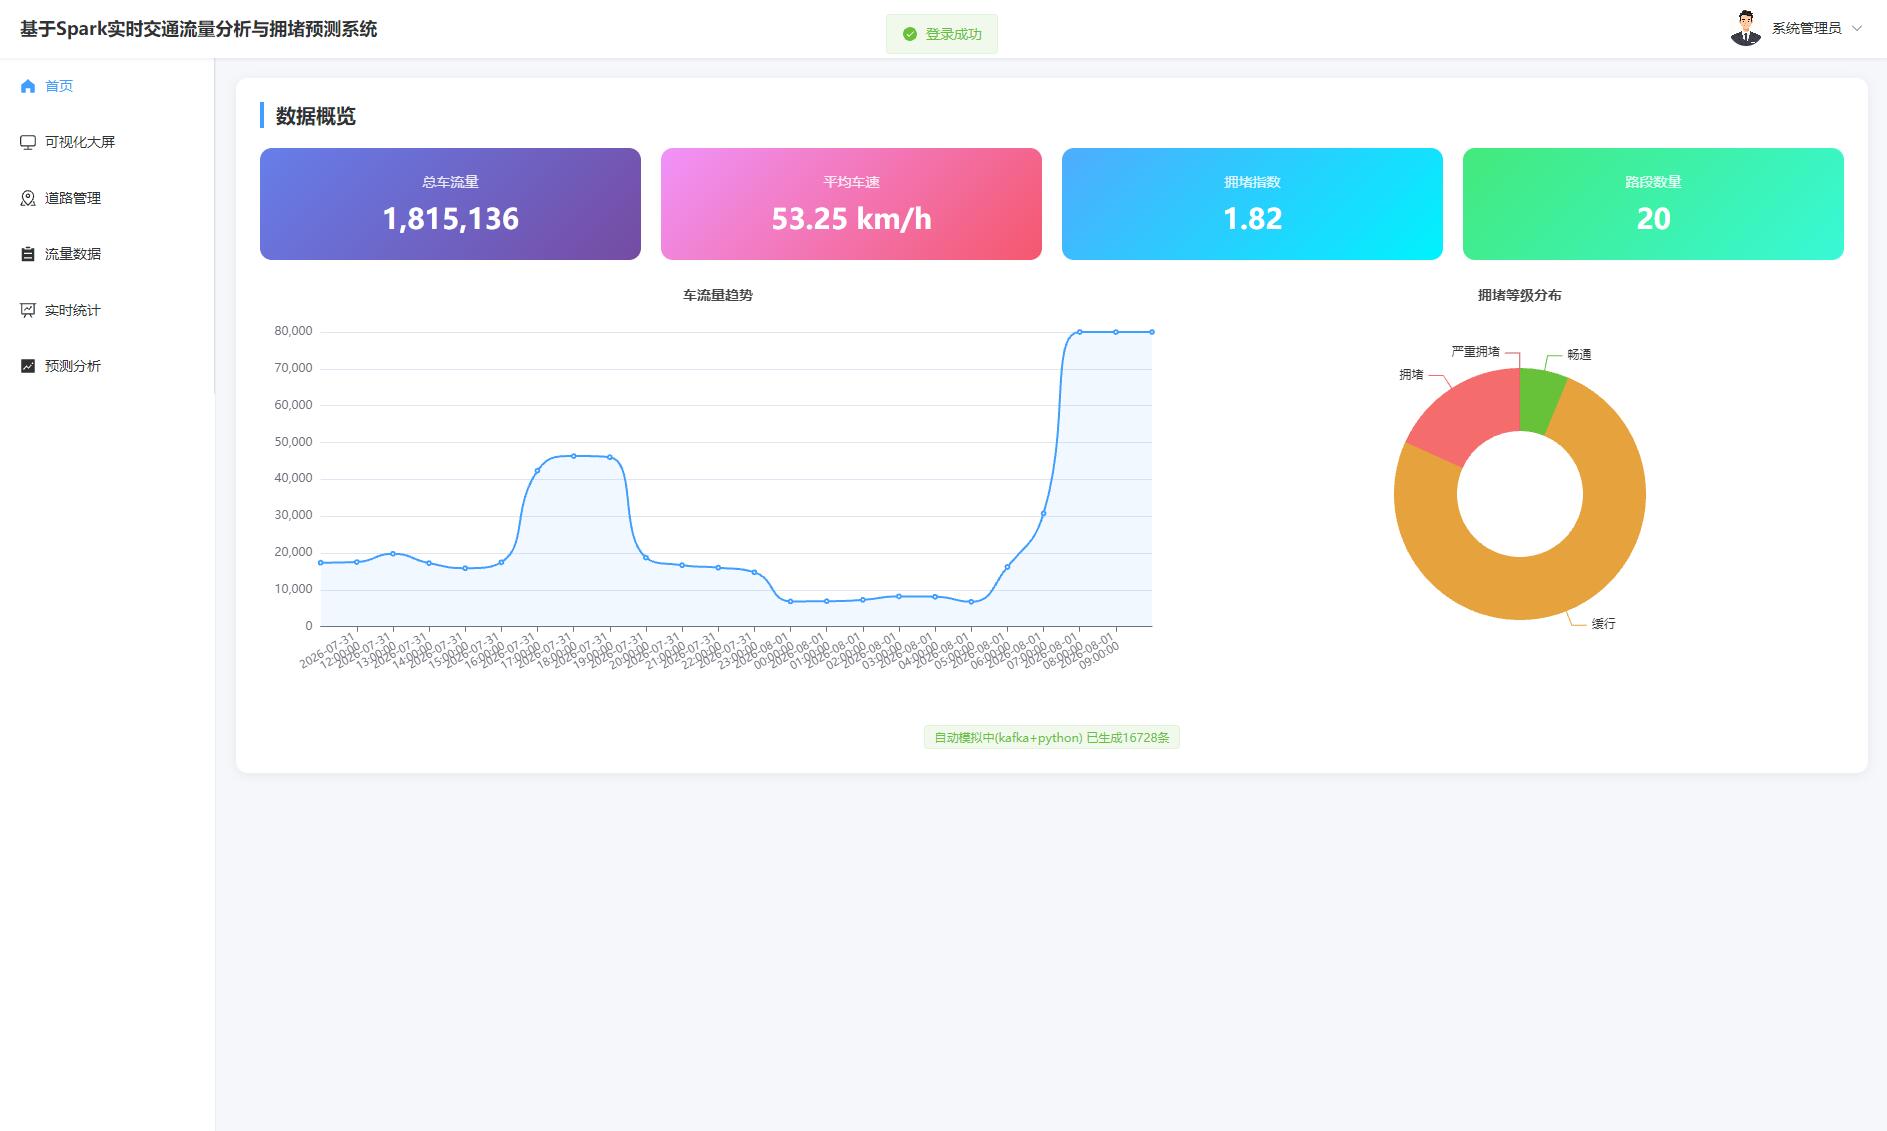
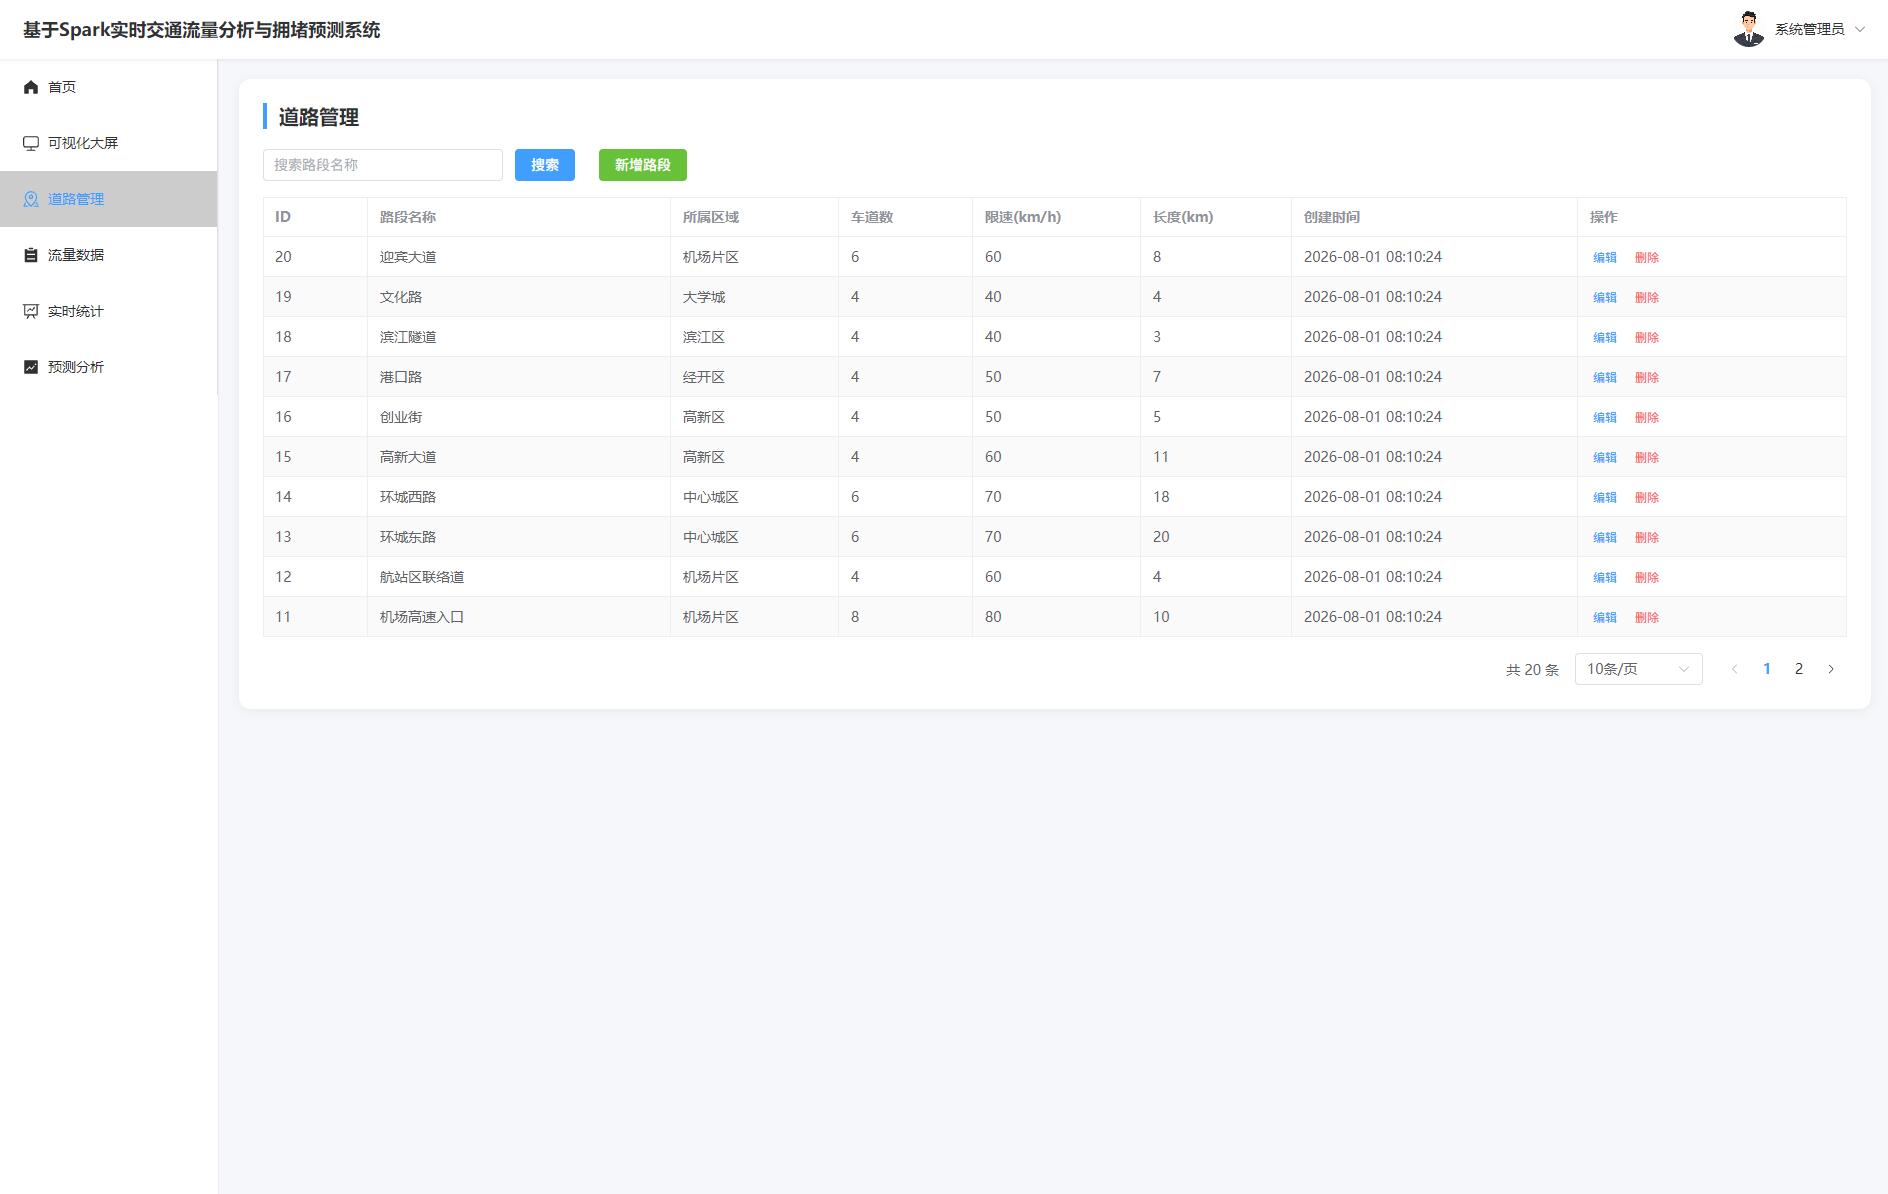
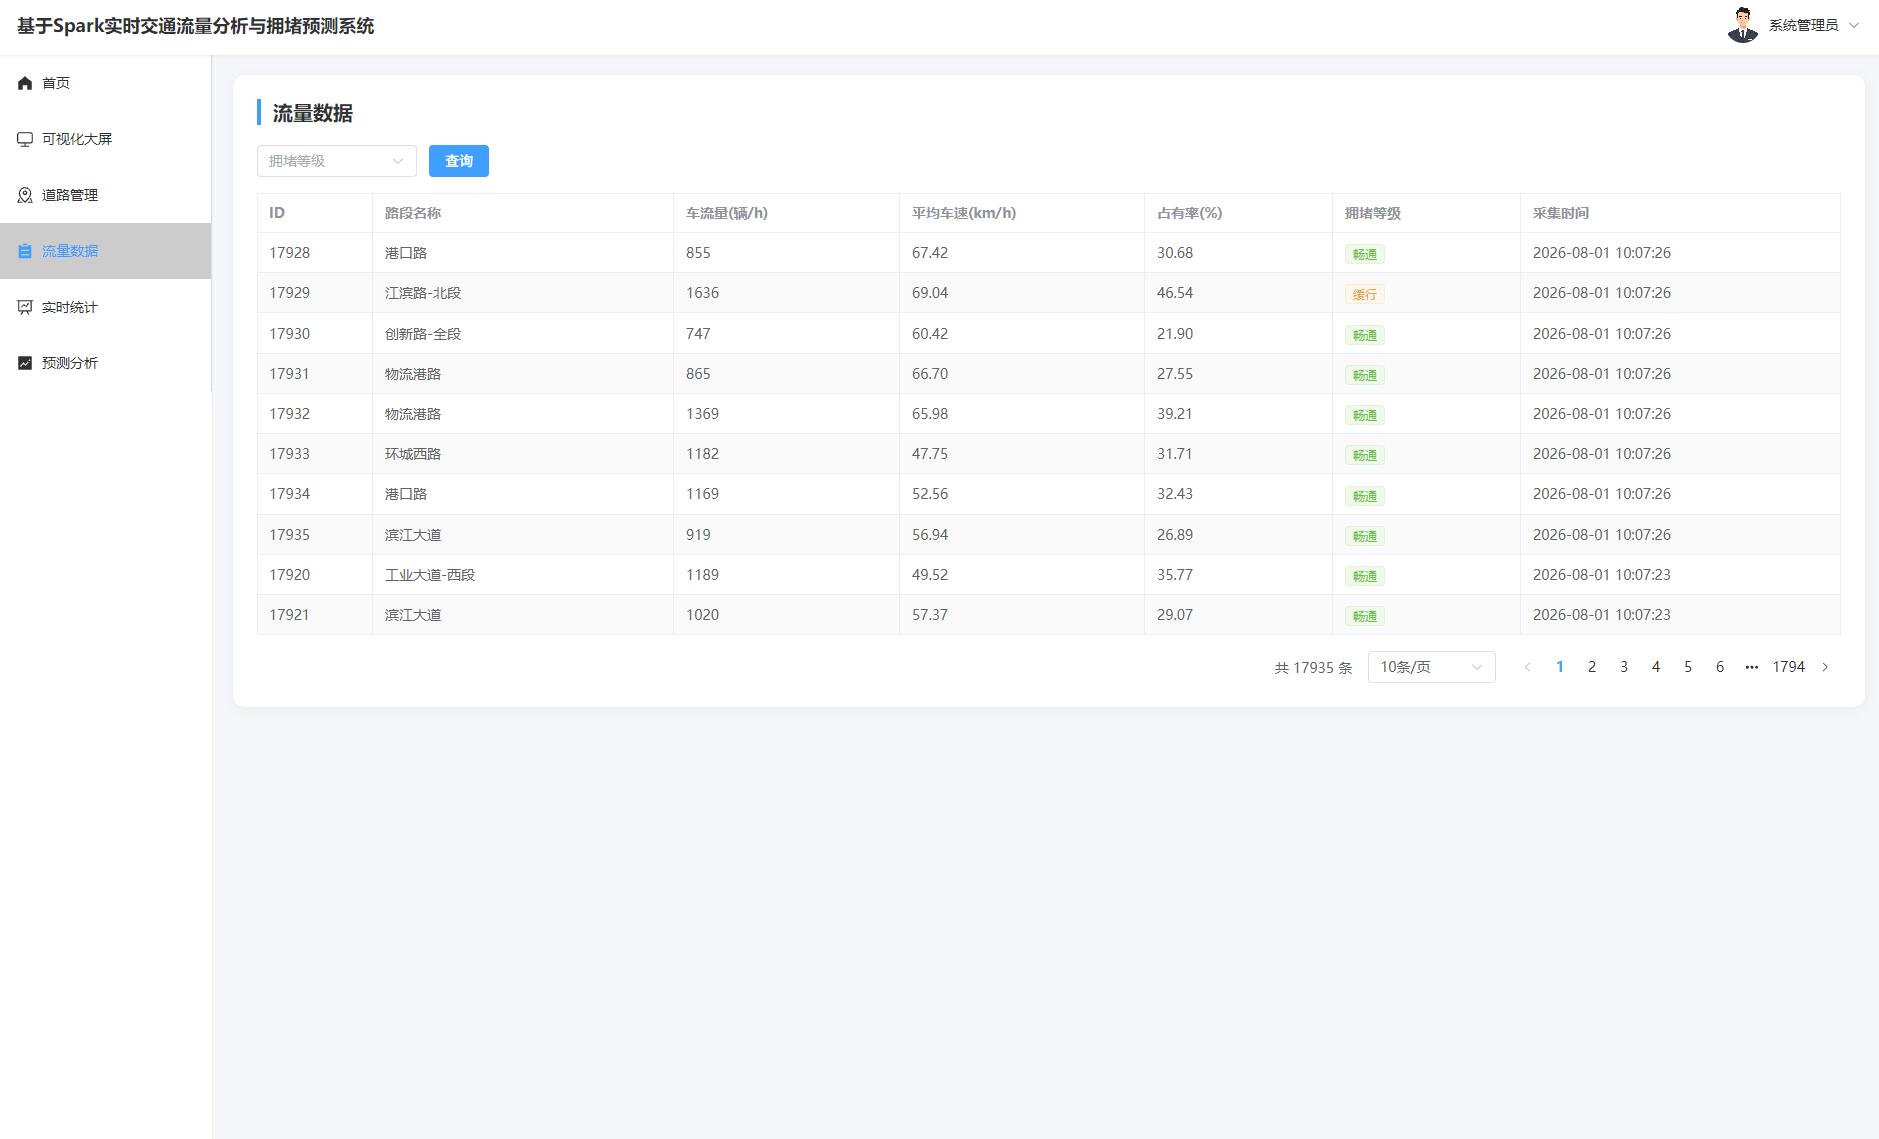
系统实现了管理员登录与个人中心、道路路段管理、交通流量查询、实时窗口统计、拥堵预测分析以及可视化大屏展示等功能。针对Kafka不可用场景,系统提供纯Java写库降级策略,保证演示与运行的鲁棒性。测试结果表明,系统能够稳定完成交通事件采集、实时统计分析与拥堵趋势预测,界面交互清晰,数据展示及时,满足本科毕业设计对完整性、可演示性与技术综合性的要求。
源码下载
链接: https://pan.baidu.com/s/1UpZs6bvGZxwXy9vhyCHqRQ?pwd=1234
提取码: 1234
系统展示
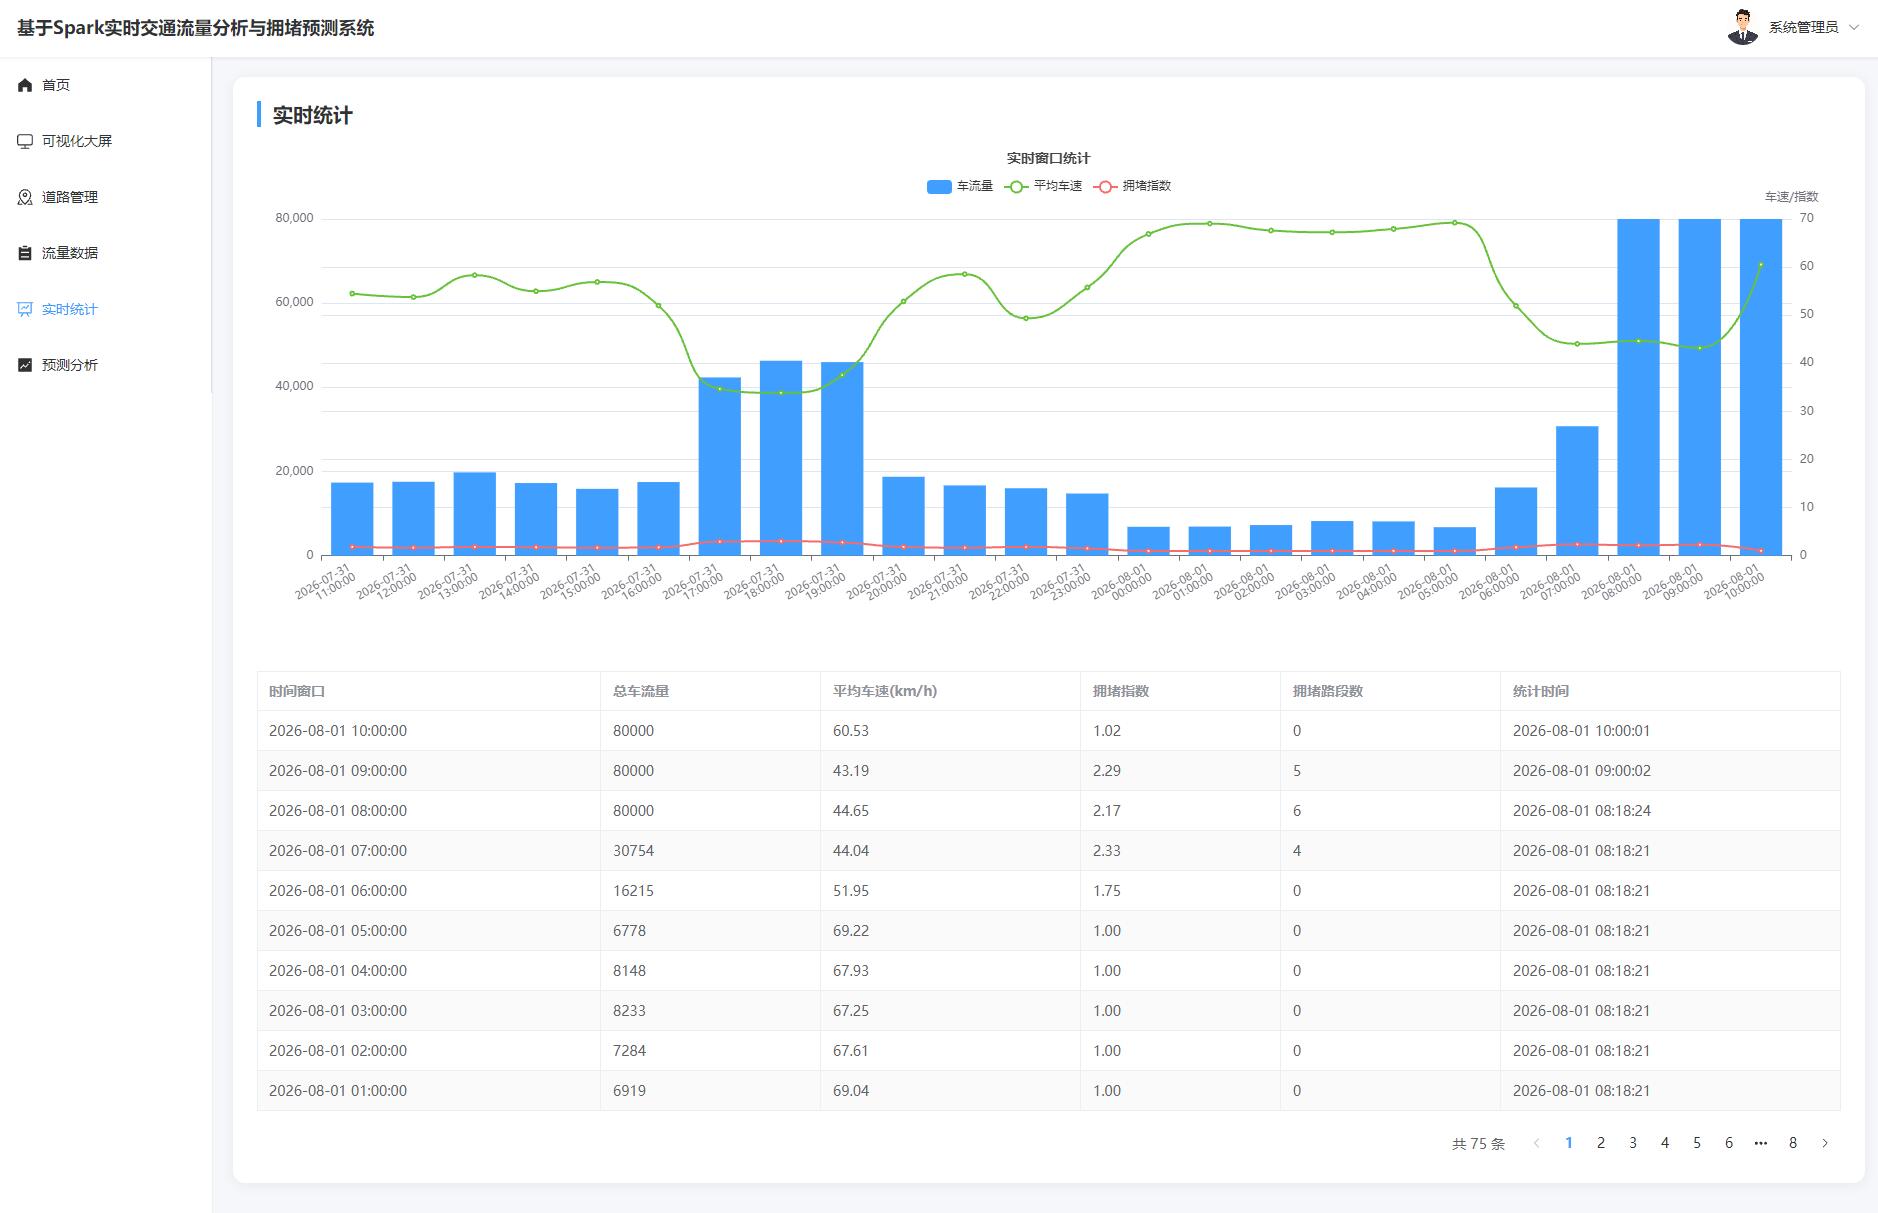

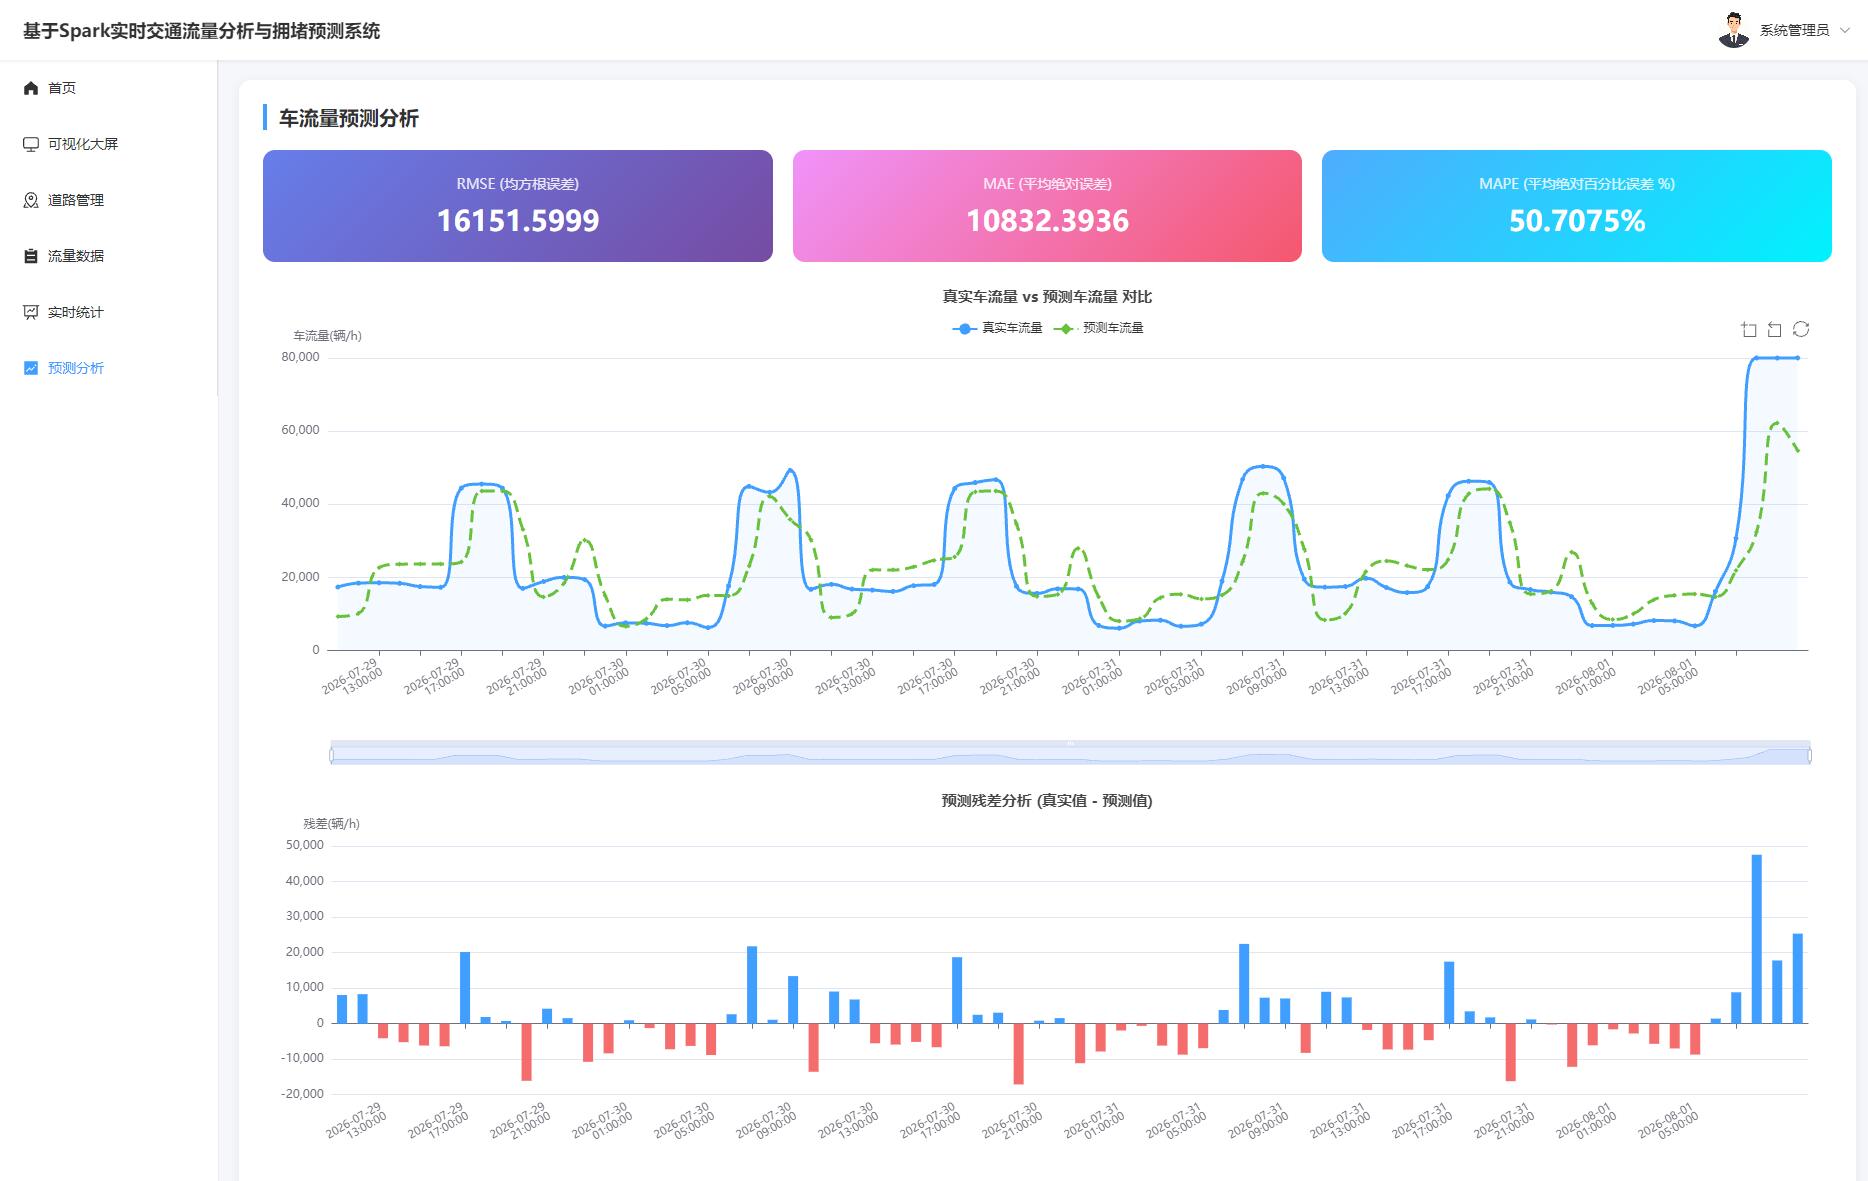
核心代码
java
package com.java1234.controller;

import com.java1234.common.PageResult;
import com.java1234.common.Result;
import com.java1234.dto.ErrorMetricOut;
import com.java1234.dto.PredictionOut;
import com.java1234.service.PredictionService;
import org.springframework.web.bind.annotation.GetMapping;
import org.springframework.web.bind.annotation.RequestMapping;
import org.springframework.web.bind.annotation.RequestParam;
import org.springframework.web.bind.annotation.RestController;

import java.util.List;
import java.util.Map;

/**
 * 预测分析控制器
 */
@RestController
@RequestMapping("/api/prediction")
public class PredictionController {

    private final PredictionService predictionService;

    public PredictionController(PredictionService predictionService) {
        this.predictionService = predictionService;
    }

    /**
     * 分页查询预测结果
     */
    @GetMapping("/list")
    public Result<PageResult<PredictionOut>> list(
            @RequestParam(defaultValue = "1") int page,
            @RequestParam(defaultValue = "10") int size) {
        return Result.ok(predictionService.list(page, size));
    }

    /**
     * 对比图表数据
     */
    @GetMapping("/compare")
    public Result<List<PredictionOut>> compare() {
        return Result.ok(predictionService.compare());
    }

    /**
     * 最新误差指标
     */
    @GetMapping("/error")
    public Result<ErrorMetricOut> error() {
        return Result.ok(predictionService.error());
    }

    /**
     * 残差数据
     */
    @GetMapping("/residual")
    public Result<List<Map<String, Object>>> residual() {
        return Result.ok(predictionService.residual());
    }
}
html
<template>
  <div class="page-container">
    <div class="page-card">
      <div class="page-title">车流量预测分析</div>
      <div class="error-cards">
        <div class="error-card">
          <div class="metric-label">RMSE (均方根误差)</div>
          <div class="metric-value">{{ errorMetric.rmse }}</div>
        </div>
        <div class="error-card">
          <div class="metric-label">MAE (平均绝对误差)</div>
          <div class="metric-value">{{ errorMetric.mae }}</div>
        </div>
        <div class="error-card">
          <div class="metric-label">MAPE (平均绝对百分比误差 %)</div>
          <div class="metric-value">{{ errorMetric.mape }}%</div>
        </div>
      </div>
      <div ref="compareRef" class="pred-chart pred-chart-compare"></div>
      <div ref="residualRef" class="pred-chart pred-chart-residual"></div>
      <el-table :data="tableData" stripe border style="width:100%">
        <el-table-column prop="window_time" label="时间窗口" min-width="170">
          <template #default="{ row }">{{ formatWindowTime(row.window_time) }}</template>
        </el-table-column>
        <el-table-column prop="true_flow" label="真实车流量" min-width="130">
          <template #default="{ row }">
            <span style="color:#409eff;font-weight:600">{{ row.true_flow }}</span>
          </template>
        </el-table-column>
        <el-table-column prop="pred_flow" label="预测车流量" min-width="130">
          <template #default="{ row }">
            <span style="color:#67c23a;font-weight:600">{{ row.pred_flow }}</span>
          </template>
        </el-table-column>
        <el-table-column label="误差" min-width="120">
          <template #default="{ row }">
            <span :style="{ color: Math.abs(row.true_flow - row.pred_flow) > 500 ? '#f56c6c' : '#909399' }">
              {{ (row.true_flow - row.pred_flow).toFixed(2) }}
            </span>
          </template>
        </el-table-column>
        <el-table-column prop="create_time" label="生成时间" min-width="170">
          <template #default="{ row }">{{ formatDateTime(row.create_time) }}</template>
        </el-table-column>
      </el-table>
      <el-pagination style="margin-top:16px;justify-content:flex-end" v-model:current-page="page" v-model:page-size="size" :total="total" layout="total, prev, pager, next" @change="loadTable" />
    </div>
  </div>
</template>

<script setup>
/**
 * 车流量预测与误差分析页面
 */
import { ref, onMounted, onUnmounted } from 'vue'
import * as echarts from 'echarts'
import request from '@/utils/request'
import { formatDateTime, formatWindowTime } from '@/utils/format'

const errorMetric = ref({ rmse: 0, mae: 0, mape: 0 })
const tableData = ref([])
const page = ref(1)
const size = ref(10)
const total = ref(0)
const compareRef = ref(null)
const residualRef = ref(null)
let charts = []

function buildAxisLabel() {
  return {
    rotate: 30, interval: 'auto', hideOverlap: true, fontSize: 11, margin: 16,
    formatter(val) {
      const text = formatWindowTime(val)
      if (text.length >= 16) return `${text.slice(0, 10)}\n${text.slice(11)}`
      return text
    },
  }
}

function initCompareChart(data) {
  const chart = echarts.init(compareRef.value)
  const labels = data.map(d => formatWindowTime(d.window_time))
  const pointCount = data.length
  // 点数较多时缩小标记,并开启缩放便于查看局部
  const symbolSize = pointCount > 40 ? 5 : 8
  chart.setOption({
    title: { text: '真实车流量 vs 预测车流量 对比', left: 'center', textStyle: { fontSize: 15 } },
    tooltip: { trigger: 'axis' },
    legend: { data: ['真实车流量', '预测车流量'], top: 32 },
    toolbox: { feature: { dataZoom: { yAxisIndex: 'none' }, restore: {} }, right: 16, top: 28 },
    dataZoom: [
      { type: 'inside', start: 0, end: 100 },
      { type: 'slider', start: 0, end: 100, height: 18, bottom: 8 },
    ],
    xAxis: { type: 'category', data: labels, axisTick: { alignWithLabel: true }, axisLabel: buildAxisLabel() },
    yAxis: { type: 'value', name: '车流量(辆/h)' },
    series: [
      { name: '真实车流量', type: 'line', smooth: true, data: data.map(d => Number(d.true_flow)), itemStyle: { color: '#409eff' }, lineStyle: { width: 3 }, symbol: 'circle', symbolSize, areaStyle: { color: 'rgba(64,158,255,0.08)' } },
      { name: '预测车流量', type: 'line', smooth: true, data: data.map(d => Number(d.pred_flow)), itemStyle: { color: '#67c23a' }, lineStyle: { width: 3, type: 'dashed' }, symbol: 'diamond', symbolSize },
    ],
    grid: { left: 20, right: 24, bottom: 52, top: 72, containLabel: true },
  })
  charts.push(chart)
}

function initResidualChart(data) {
  const chart = echarts.init(residualRef.value)
  const labels = data.map(d => formatWindowTime(d.window_time))
  const barWidth = data.length > 40 ? 10 : 20
  chart.setOption({
    title: { text: '预测残差分析 (真实值 - 预测值)', left: 'center', textStyle: { fontSize: 15 } },
    tooltip: { trigger: 'axis' },
    dataZoom: [
      { type: 'inside', start: 0, end: 100 },
      { type: 'slider', start: 0, end: 100, height: 18, bottom: 8 },
    ],
    xAxis: { type: 'category', data: labels, axisTick: { alignWithLabel: true }, axisLabel: buildAxisLabel() },
    yAxis: { type: 'value', name: '残差(辆/h)' },
    series: [{ type: 'bar', data: data.map(d => ({ value: d.residual, itemStyle: { color: d.residual >= 0 ? '#409eff' : '#f56c6c' } })), barWidth }],
    grid: { left: 20, right: 24, bottom: 52, top: 56, containLabel: true },
  })
  charts.push(chart)
}

async function loadData() {
  const [errorRes, compareRes, residualRes] = await Promise.all([
    request.get('/prediction/error'),
    request.get('/prediction/compare'),
    request.get('/prediction/residual'),
  ])
  errorMetric.value = errorRes.data
  charts.forEach(c => c.dispose())
  charts = []
  initCompareChart(compareRes.data)
  initResidualChart(residualRes.data)
}

async function loadTable() {
  const res = await request.get('/prediction/list', { params: { page: page.value, size: size.value } })
  tableData.value = res.data.items
  total.value = res.data.total
}

onMounted(() => { loadData(); loadTable() })
onUnmounted(() => charts.forEach(c => c.dispose()))
</script>

<style scoped>
.pred-chart { width: 100%; margin-bottom: 24px; }
.pred-chart-compare { height: 480px; }
.pred-chart-residual { height: 420px; }
</style>