今天复刻的是:
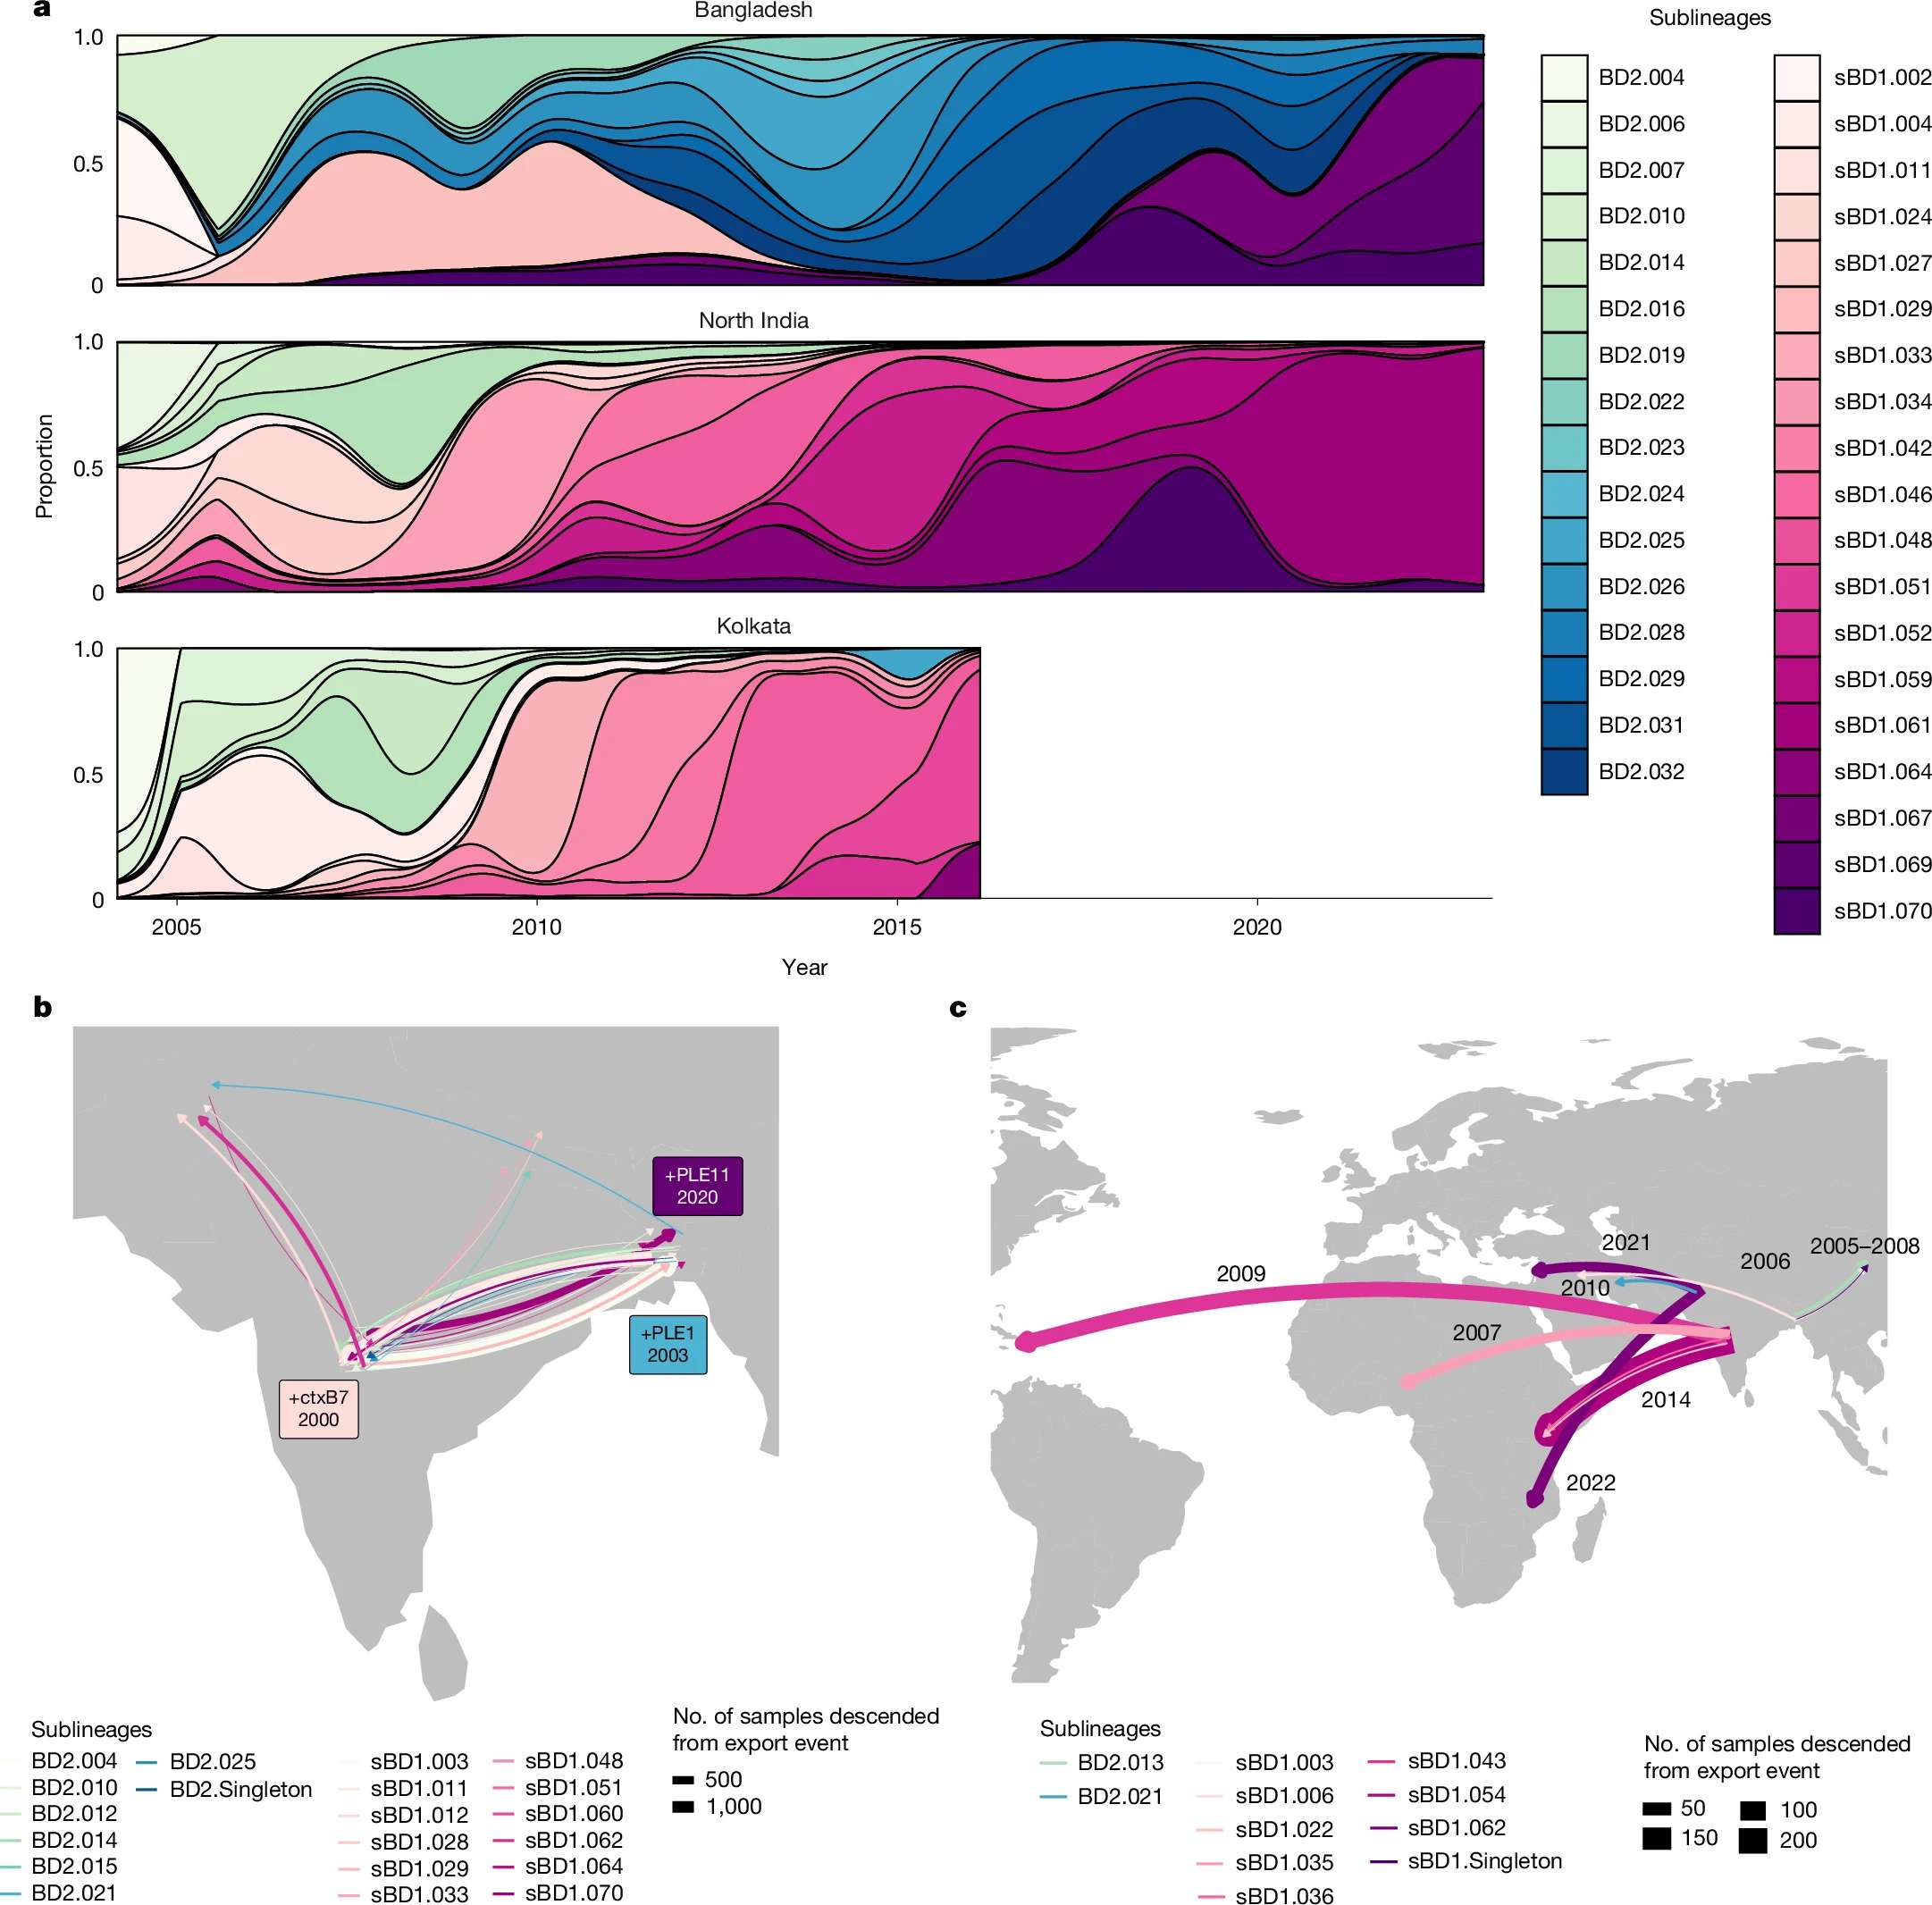
- Barton, A., Afrad, M.H., Taylor-Brown, A. et al. Evolution of pandemic cholera at its global source. Nature 653, 491--498 (2026). https://doi.org/10.1038/s41586-026-10340-x
的 Fig.2a,原图长这样:
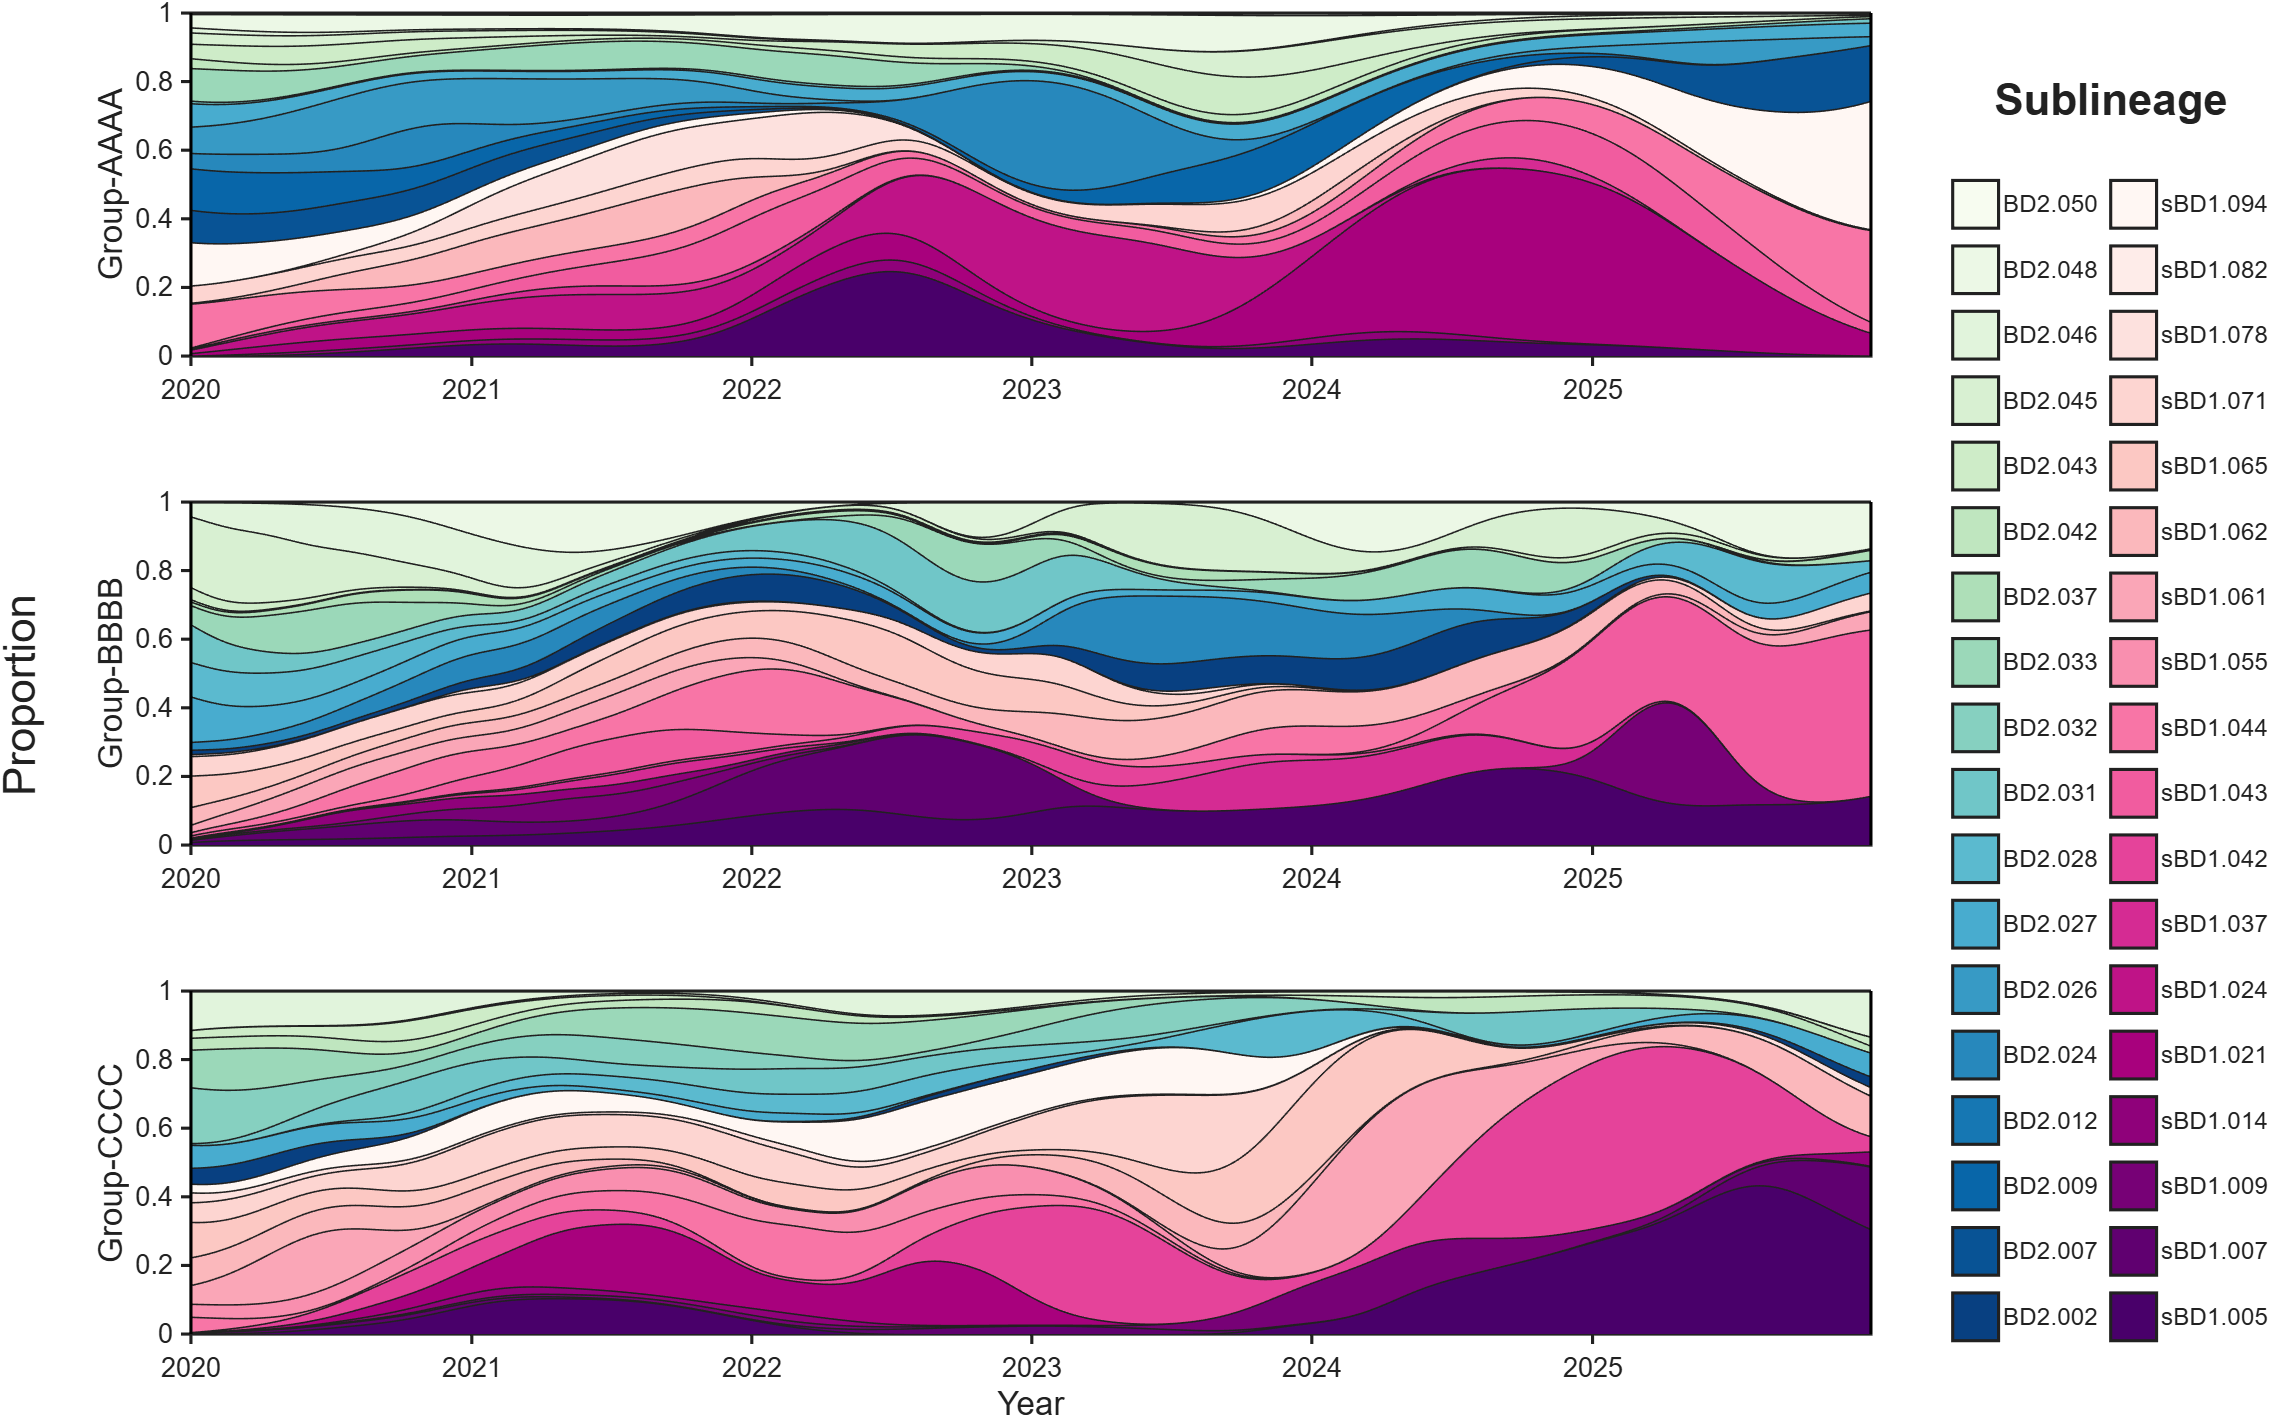
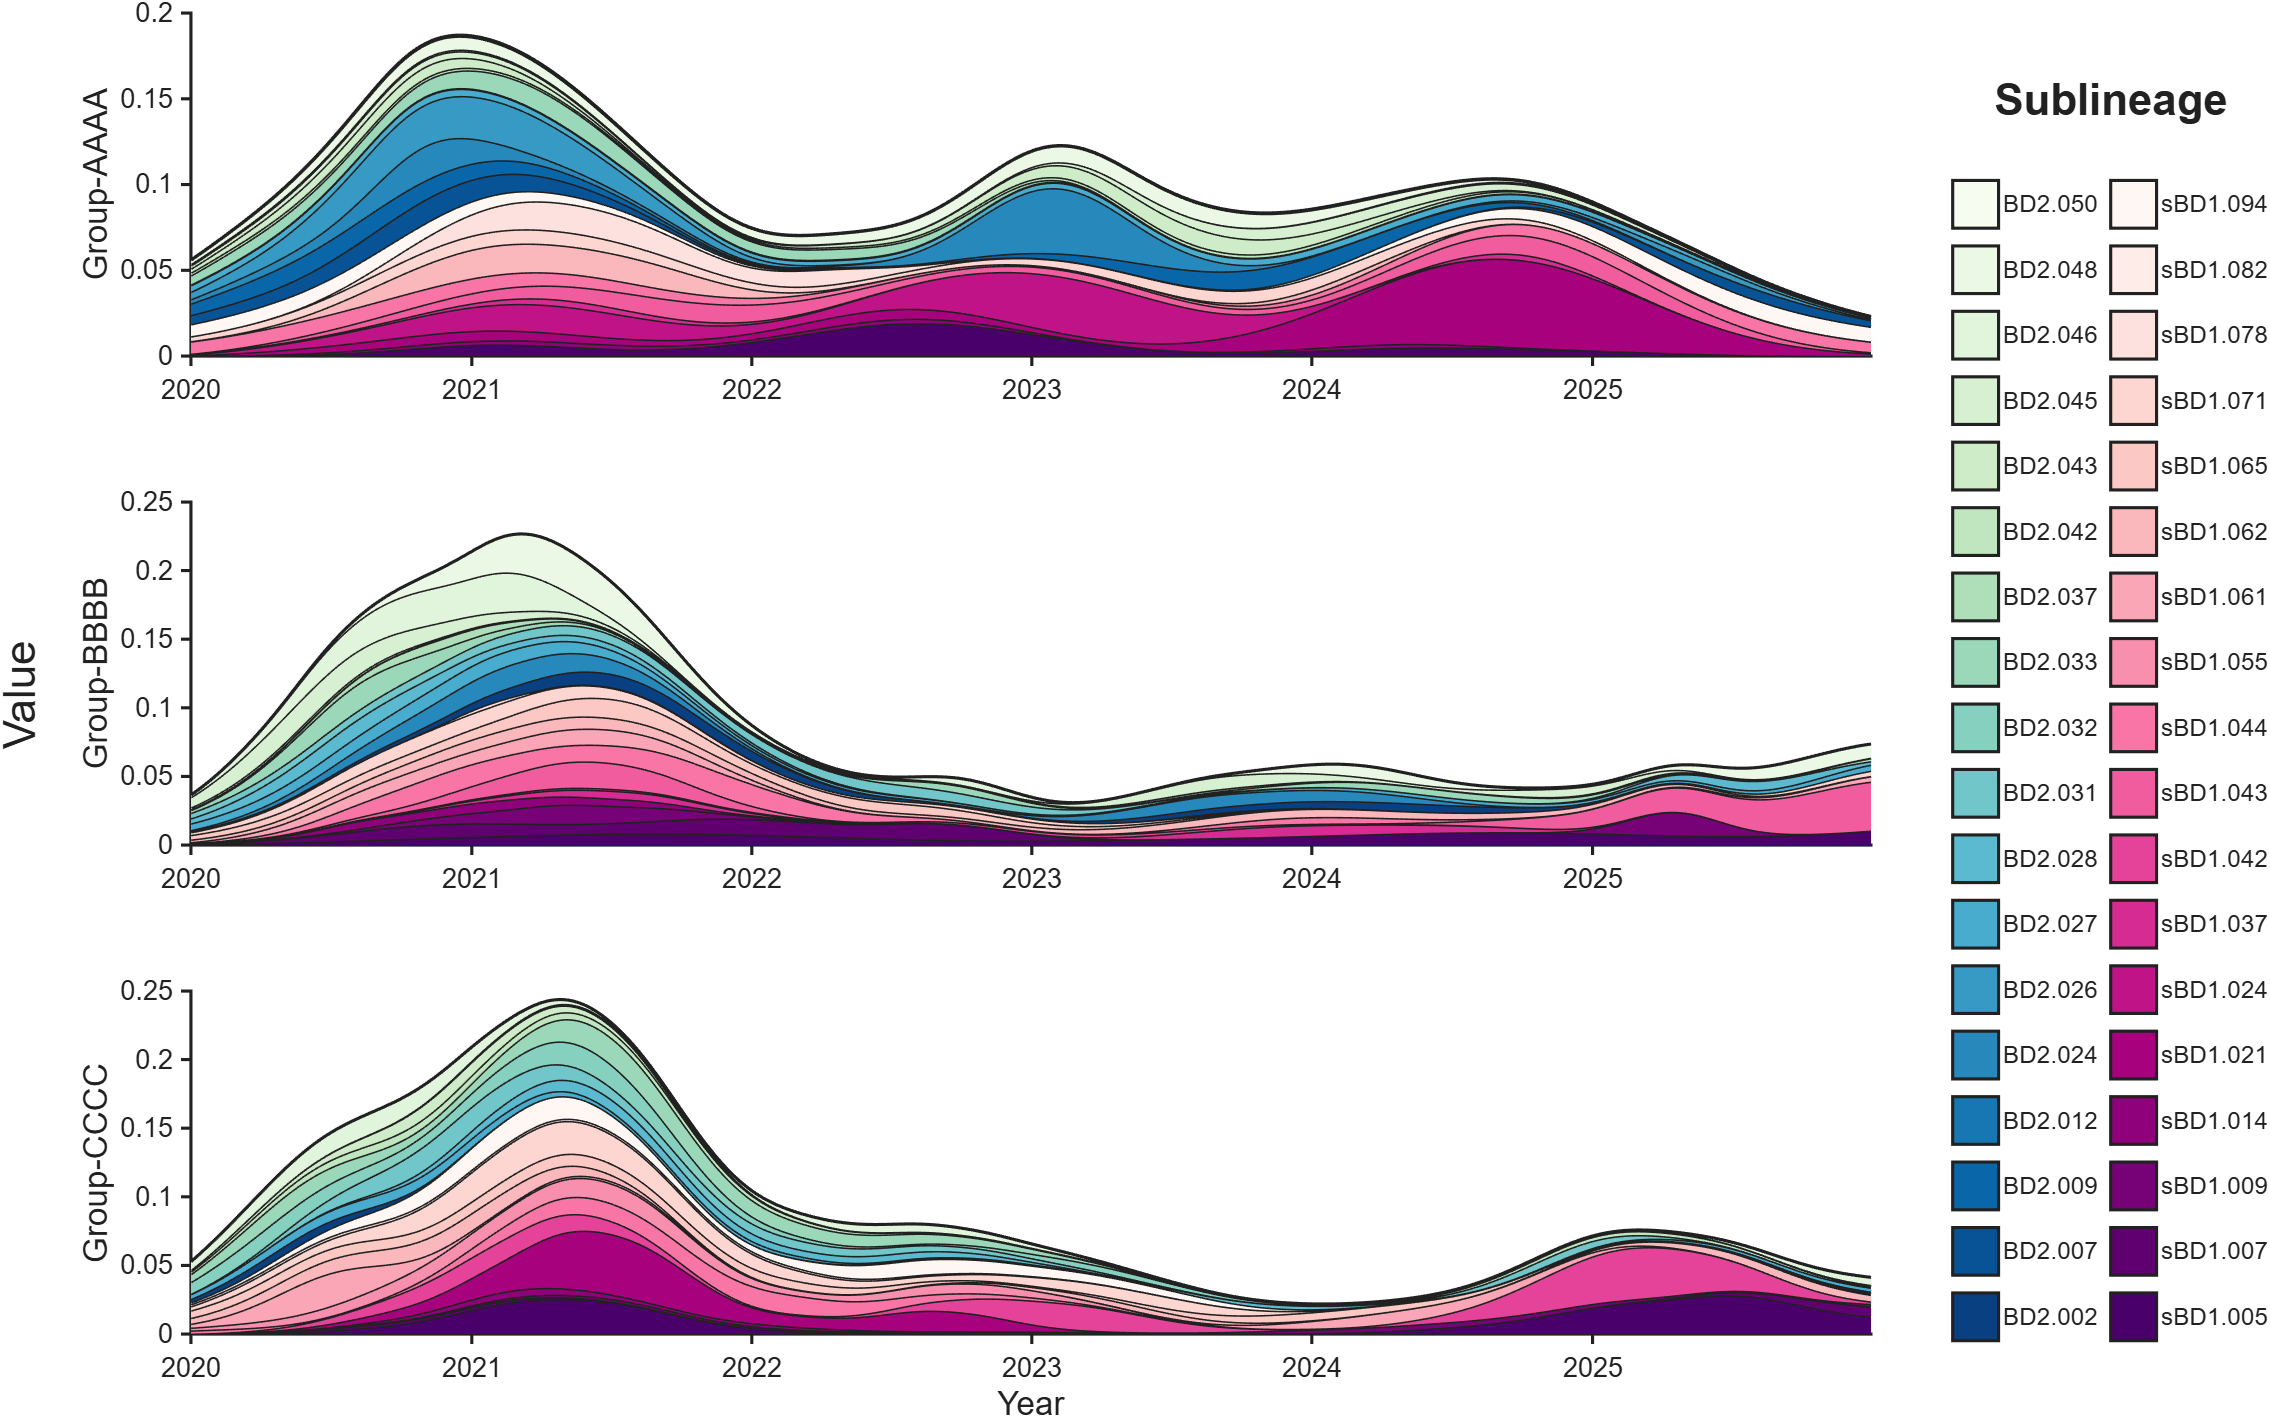
复刻效果(这里用的是我随机生成的数据)
正文部分
数据读取
matlab
% 数据读取
T1 = readtable('Group_AAAA.csv');
T2 = readtable('Group_BBBB.csv');
T3 = readtable('Group_CCCC.csv');
Data1 = T1{:, 4:end};
Data2 = T2{:, 4:end};
Data3 = T3{:, 4:end};

% 获取变量名
varNames = T1.Properties.VariableNames(4:end);
varNames = strrep(varNames, '_', '.');
gNames = {'Group-AAAA', 'Group-BBBB', 'Group-CCCC'};

% 获取日期
Year = T1.Year; Month = T1.Month; Day = T1.Day;
DT = datetime(Year, Month, Day);
这三组数据是我随机生成的,三组数据都长这样:
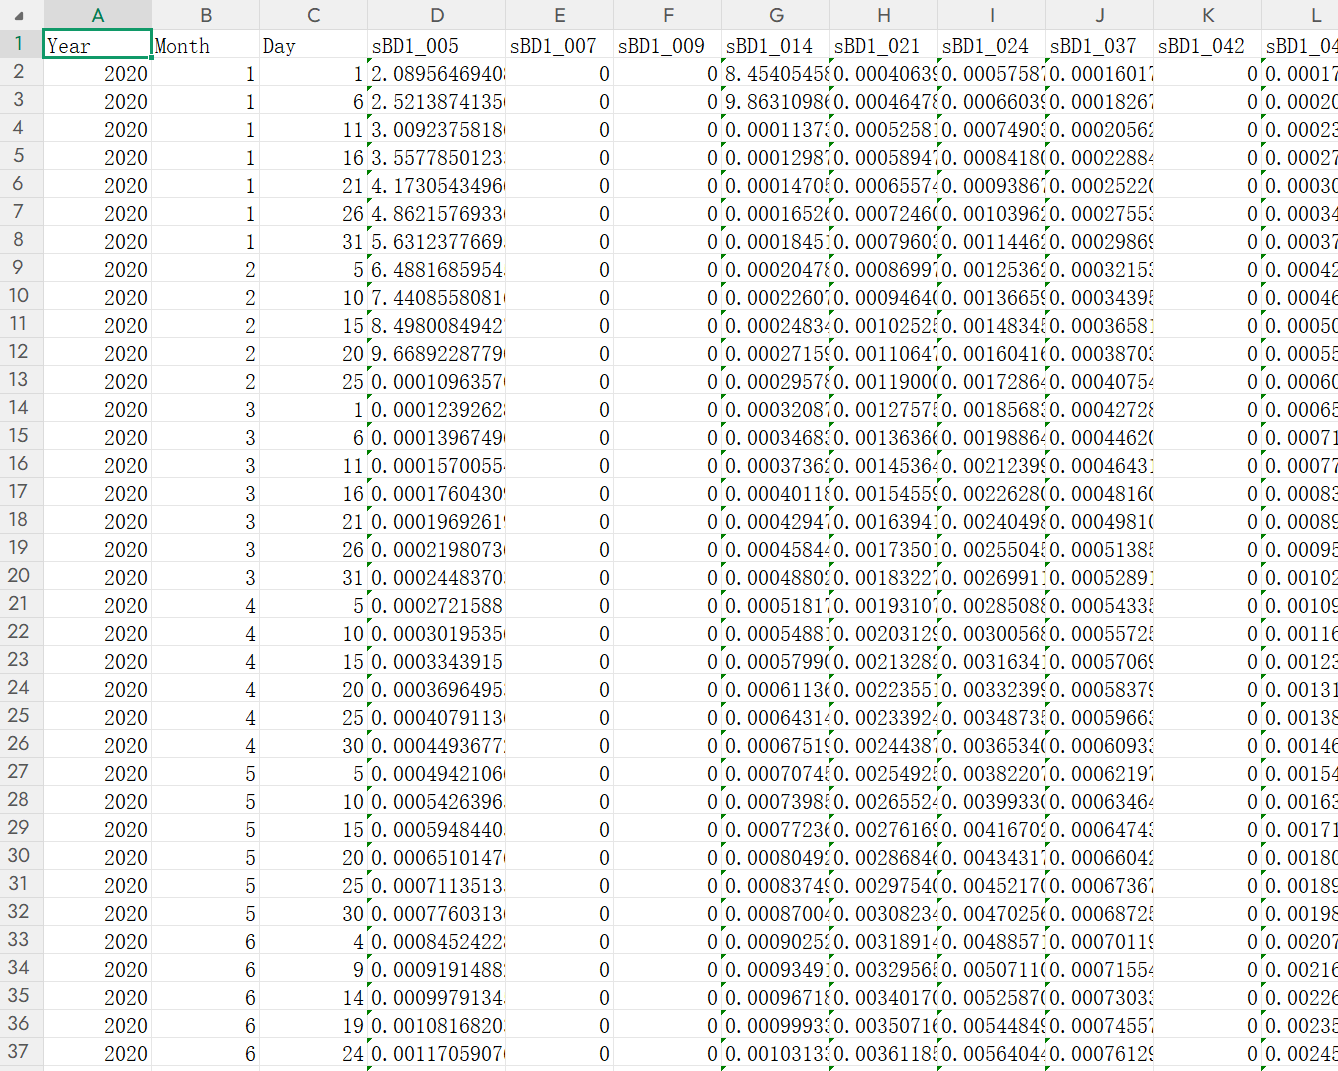
前三列分别是日期的年月日,后面的列都是用来绘图的变量。
配色获取
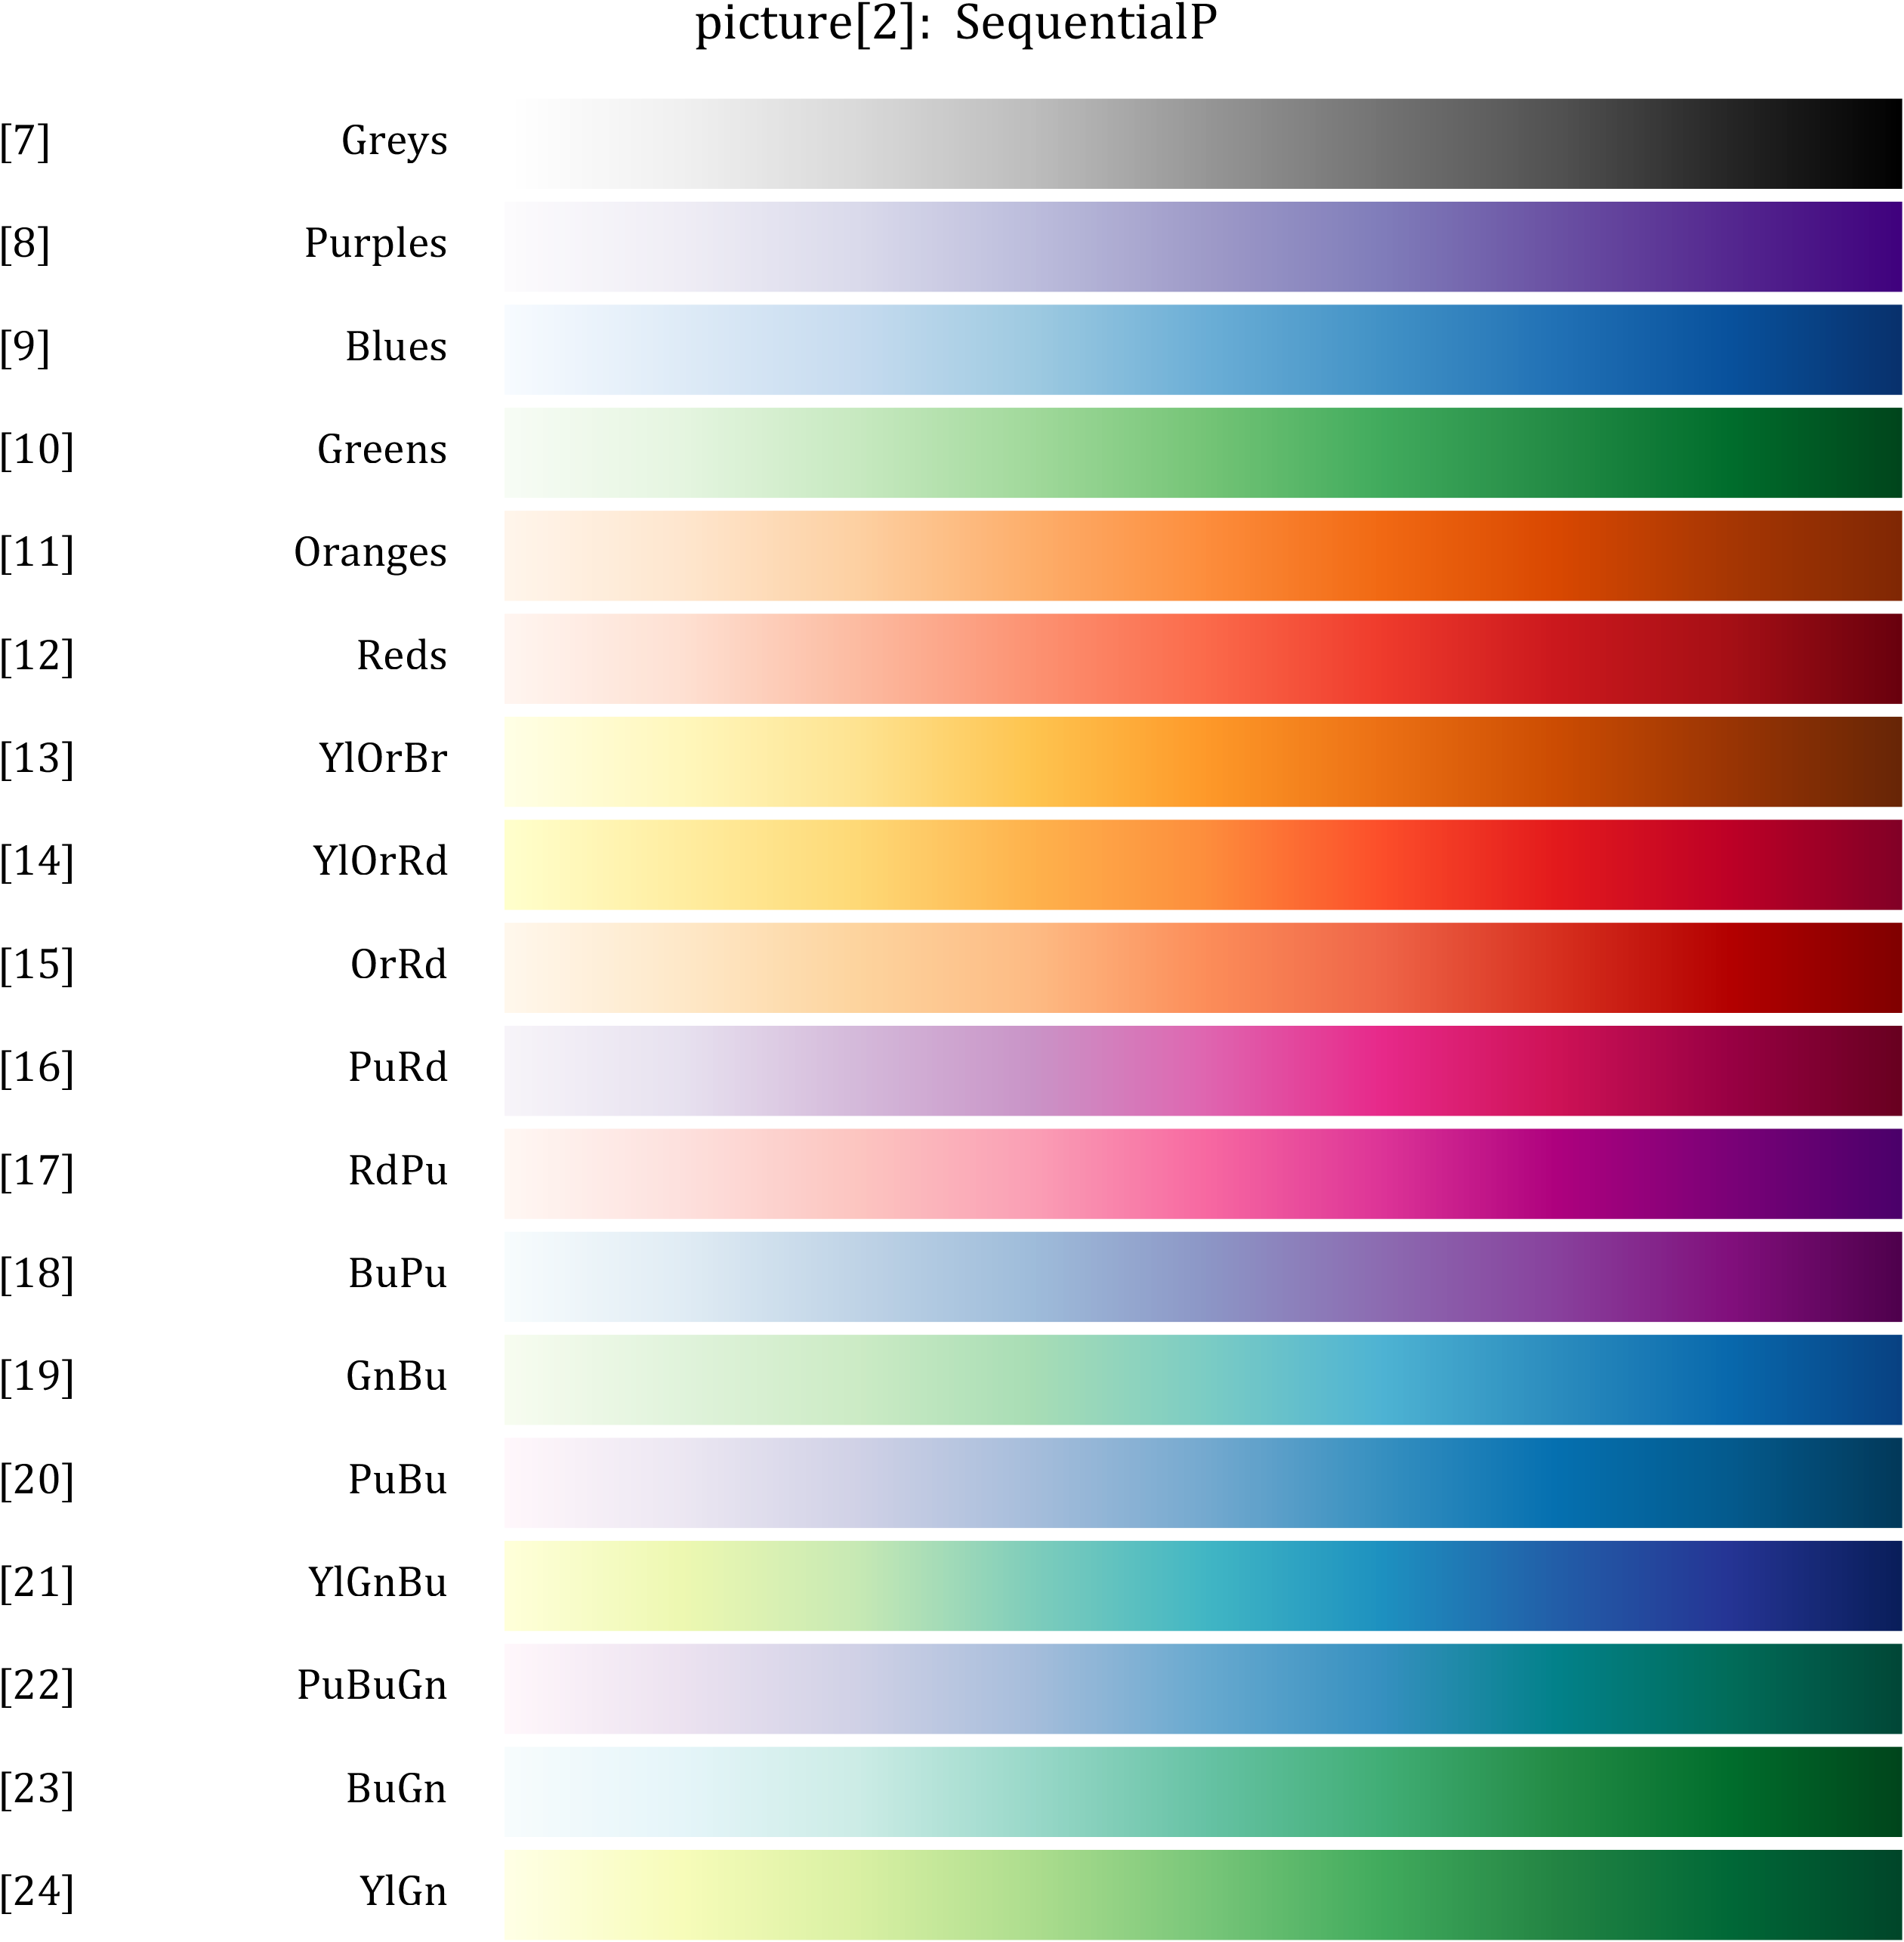
这里使用我编写的常用colormap合集工具slanCM:
matlab
% 获取配色
cmap = [flipud(slanCM(17, 18)); flipud(slanCM(19, 18))];
使用其中的 17 号配色 RdPu 及 19 号配色 GnBu:
绘图及相关技巧
由于 area 函数支持使用时间直接作为 x 轴,所以绘图非常简单,就创建三个子图然后依次:
matlab
aHdl1 = area(ax1, DT, Data1);
aHdl2 = area(ax2, DT, Data2);
aHdl3 = area(ax3, DT, Data3);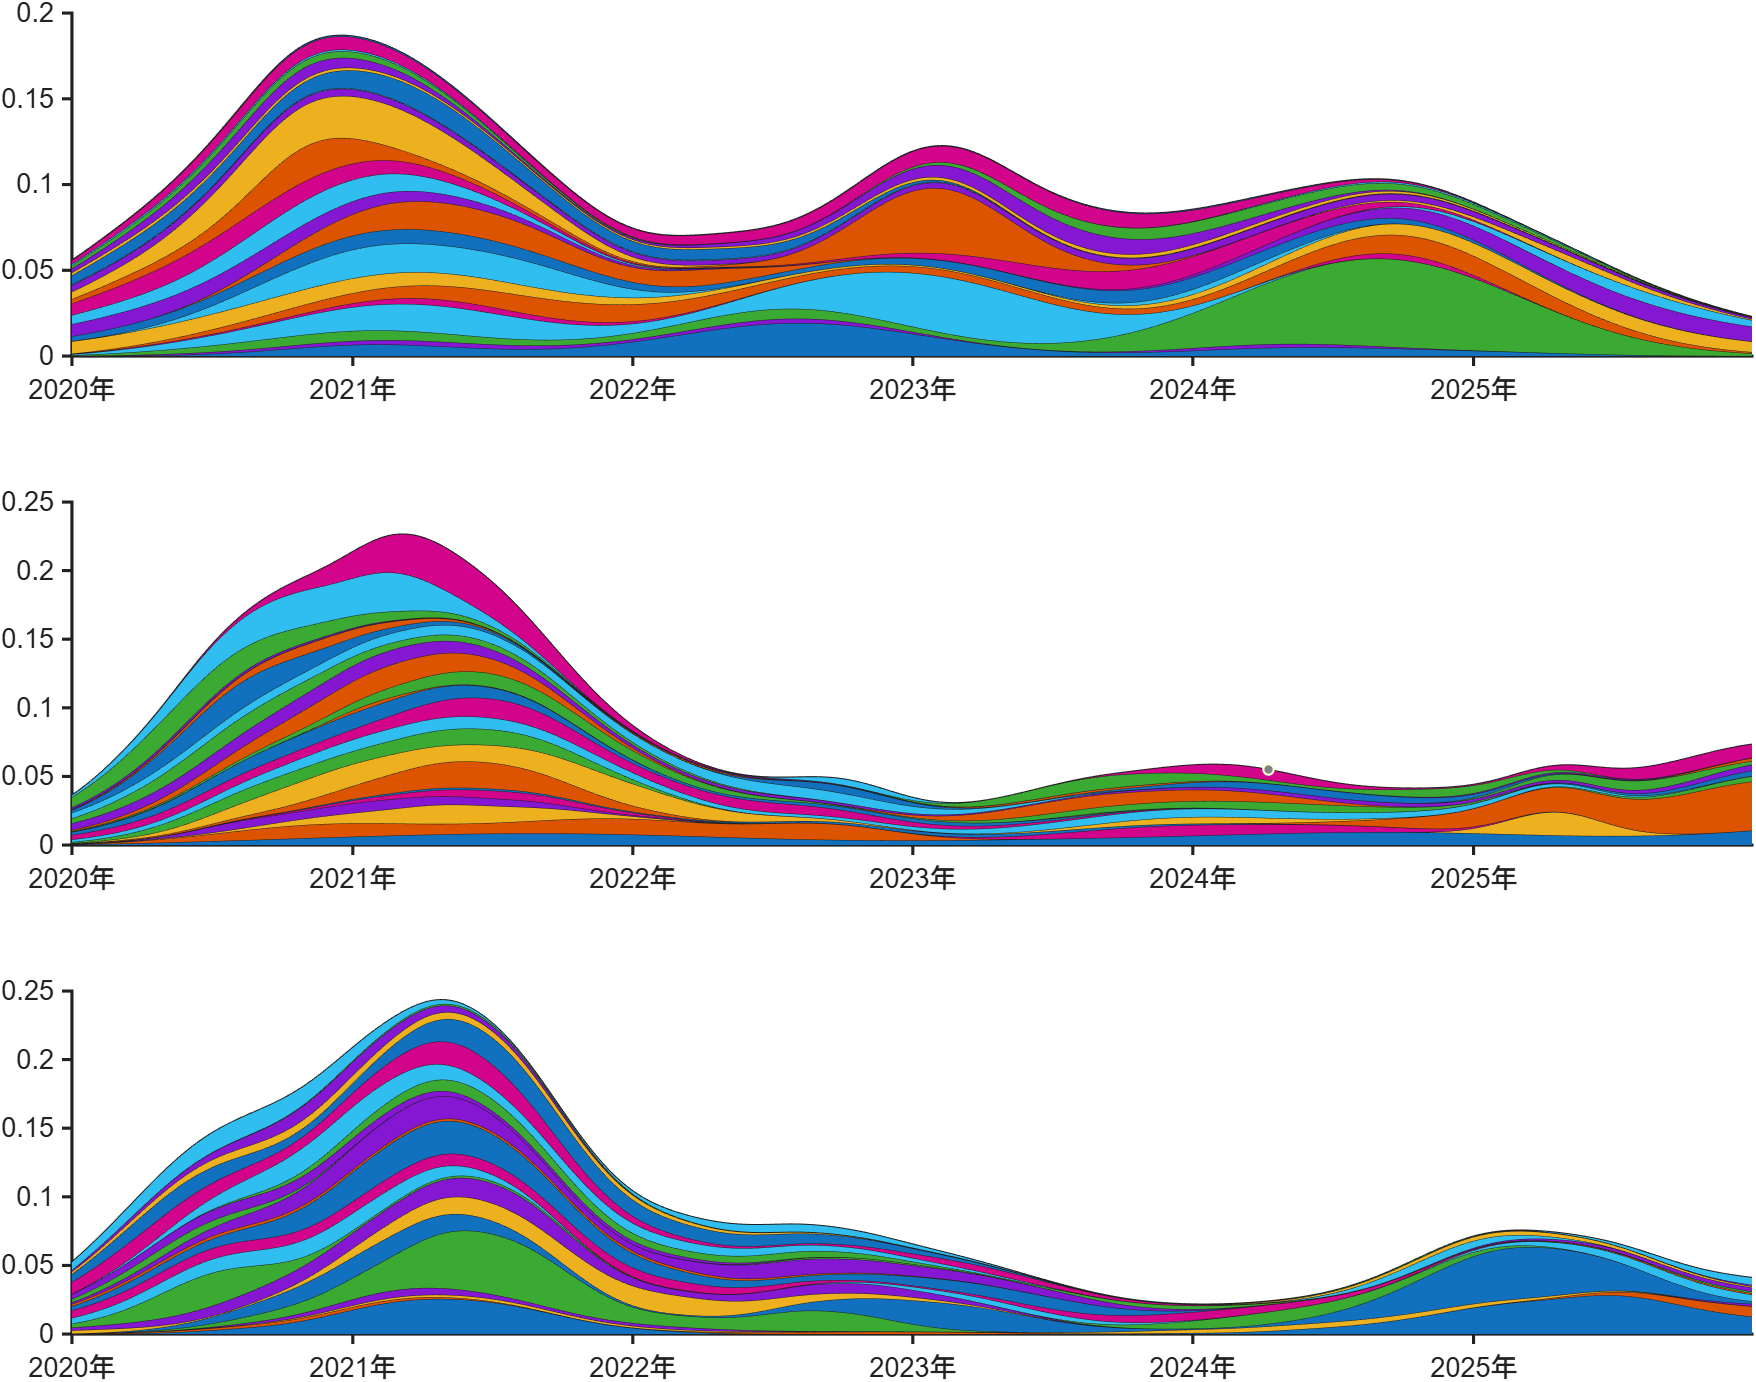
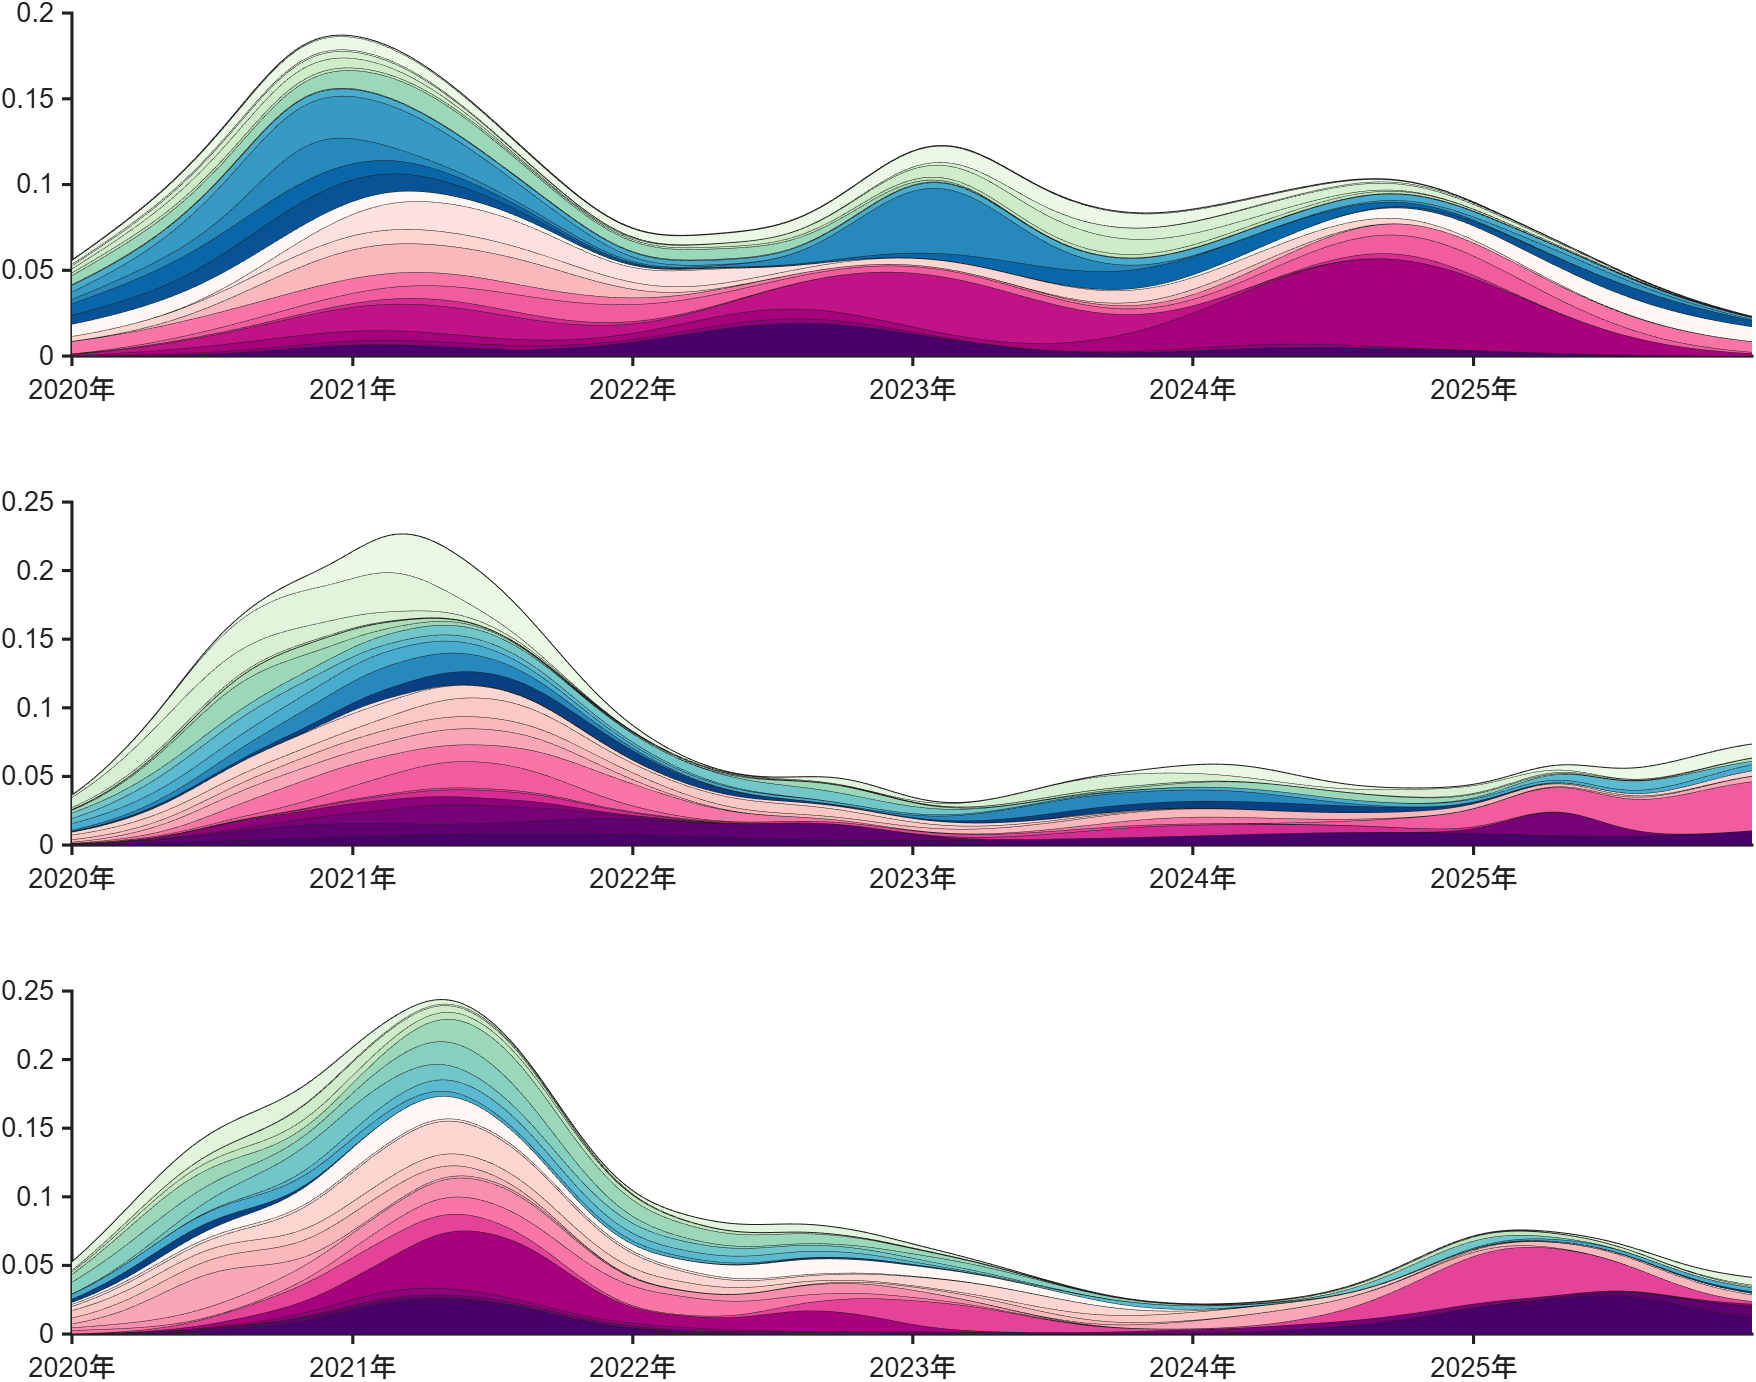
这里讲一个修改颜色的技巧,可以将颜色使用 num2cell 函数分割成元胞数组列向量,然后使用 set 函数批量设置属性:
set(aHdl1, {'FaceColor'}, num2cell(cmap, 2));
set(aHdl2, {'FaceColor'}, num2cell(cmap, 2));
set(aHdl3, {'FaceColor'}, num2cell(cmap, 2));
这样的写法对比使用 for 循环一个一个设置颜色快十几倍,这里只是设置 36 个对象可能看起来没那么明显,但是数量再多的话,比如成百上千个对象会快非常多。
数值堆叠面积图-绘图部分完整代码
matlab
% 图窗及坐标区域创建
fig = figure('Units','normalized', 'Position',[.02,.05,.9,.88], 'Color','w');
ax1 = axes('Parent',fig, 'Position',[.1, 2/3 + .065, .7, 1/3 - .1], 'NextPlot','add', ...
    'TickLength',[.005,.001], 'LineWidth',1.5, 'TickDir','out', 'FontSize',13, 'FontName','Arial');
ax2 = axes('Parent',fig, 'Position',[.1, 1/3 + .065, .7, 1/3 - .1], 'NextPlot','add', ...
    'TickLength',[.005,.001], 'LineWidth',1.5, 'TickDir','out', 'FontSize',13, 'FontName','Arial');
ax3 = axes('Parent',fig, 'Position',[.1, 0   + .065, .7, 1/3 - .1], 'NextPlot','add', ...
    'TickLength',[.005,.001], 'LineWidth',1.5, 'TickDir','out', 'FontSize',13, 'FontName','Arial');
% 绘图
aHdl1 = area(ax1, DT, Data1, 'LineWidth',1.5); set(aHdl1, {'FaceColor'}, num2cell(cmap, 2));
aHdl2 = area(ax2, DT, Data2, 'LineWidth',1.5); set(aHdl2, {'FaceColor'}, num2cell(cmap, 2));
aHdl3 = area(ax3, DT, Data3, 'LineWidth',1.5); set(aHdl3, {'FaceColor'}, num2cell(cmap, 2));

% 添加标签及图例
set(ax1.YLabel, 'String',gNames{1}, 'FontSize',16)
set(ax2.YLabel, 'String',gNames{2}, 'FontSize',16)
set(ax3.YLabel, 'String',gNames{3}, 'FontSize',16)
set(ax3.XLabel, 'String','Year', 'FontSize',16)
ax1.XTickLabel = regexprep(ax1.XTickLabel, '\D', '');
ax2.XTickLabel = regexprep(ax2.XTickLabel, '\D', '');
ax3.XTickLabel = regexprep(ax3.XTickLabel, '\D', '');
annotation('textbox', [.03, .4995, .001, .001], 'String','Value', 'FontSize',21, 'FontName','Arial', ...
    'HorizontalAlignment','center', 'VerticalAlignment','middle', 'Rotation',90, 'EdgeColor','none');
lgdHdl = legend(ax1, varNames, 'AutoUpdate','off', 'Position', [.825, .05, .15, .9], 'NumColumns',2, 'Box','off');
lgdHdl.ItemTokenSize = [22, 22];
set(lgdHdl.Title, 'String','Sublineage', 'FontSize',21, 'FontName','Arial')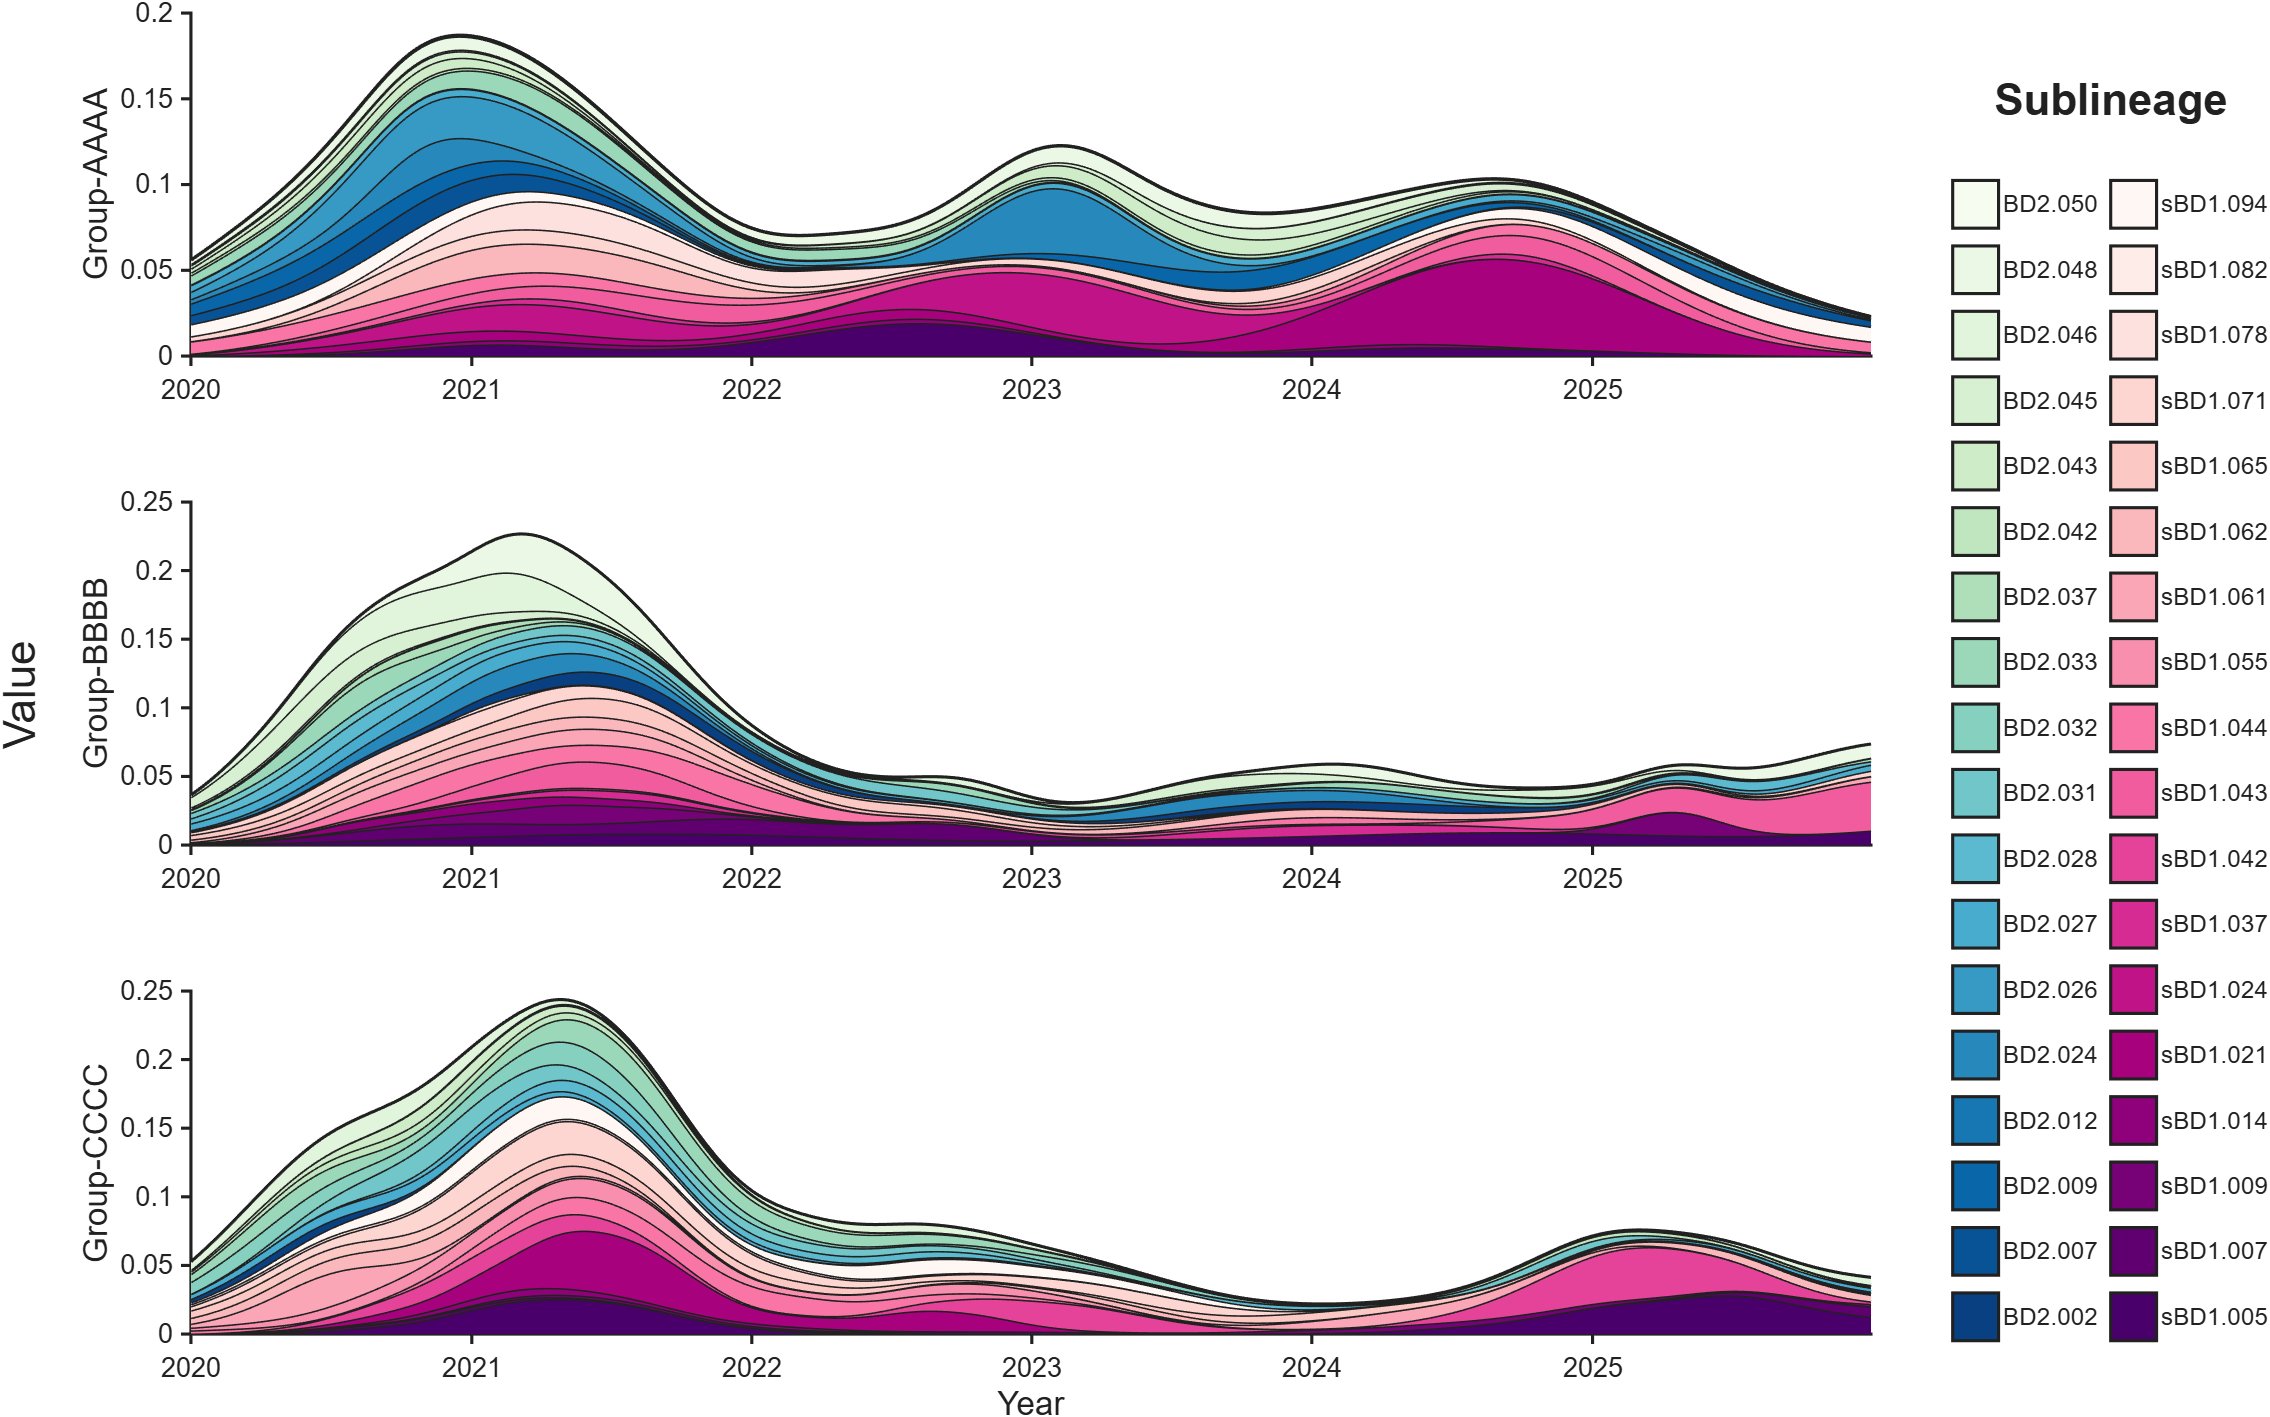
比例堆叠面积图-绘图部分完整代码
matlab
% 图窗及坐标区域创建
fig = figure('Units','normalized', 'Position',[.02,.05,.9,.88], 'Color','w');
ax1 = axes('Parent',fig, 'Position',[.1, 2/3 + .065, .7, 1/3 - .1], 'NextPlot','add', 'YLim',[0,1], ...
    'TickLength',[.005,.001], 'LineWidth',1.5, 'TickDir','out', 'FontSize',13, 'FontName','Arial');
ax2 = axes('Parent',fig, 'Position',[.1, 1/3 + .065, .7, 1/3 - .1], 'NextPlot','add', 'YLim',[0,1], ...
    'TickLength',[.005,.001], 'LineWidth',1.5, 'TickDir','out', 'FontSize',13, 'FontName','Arial');
ax3 = axes('Parent',fig, 'Position',[.1, 0   + .065, .7, 1/3 - .1], 'NextPlot','add', 'YLim',[0,1], ...
    'TickLength',[.005,.001], 'LineWidth',1.5, 'TickDir','out', 'FontSize',13, 'FontName','Arial');
% 绘图
N = length(varNames);
aHdl1 = area(ax1, DT, Data1./repmat(sum(Data1, 2), [1, N]), 'LineWidth',1.5); set(aHdl1, {'FaceColor'}, num2cell(cmap, 2));
aHdl2 = area(ax2, DT, Data2./repmat(sum(Data2, 2), [1, N]), 'LineWidth',1.5); set(aHdl2, {'FaceColor'}, num2cell(cmap, 2));
aHdl3 = area(ax3, DT, Data3./repmat(sum(Data3, 2), [1, N]), 'LineWidth',1.5); set(aHdl3, {'FaceColor'}, num2cell(cmap, 2));

% 添加标签及图例
set(ax1.YLabel, 'String',gNames{1}, 'FontSize',16)
set(ax2.YLabel, 'String',gNames{2}, 'FontSize',16)
set(ax3.YLabel, 'String',gNames{3}, 'FontSize',16)
set(ax3.XLabel, 'String','Year', 'FontSize',16)
ax1.XTickLabel = regexprep(ax1.XTickLabel, '\D', '');
ax2.XTickLabel = regexprep(ax2.XTickLabel, '\D', '');
ax3.XTickLabel = regexprep(ax3.XTickLabel, '\D', '');
annotation('textbox', [.03, .4995, .001, .001], 'String','Proportion', 'FontSize',21, 'FontName','Arial', ...
    'HorizontalAlignment','center', 'VerticalAlignment','middle', 'Rotation',90, 'EdgeColor','none');
lgdHdl = legend(ax1, varNames, 'AutoUpdate','off', 'Position', [.825, .05, .15, .9], 'NumColumns',2, 'Box','off');
lgdHdl.ItemTokenSize = [22, 22];
set(lgdHdl.Title, 'String','Sublineage', 'FontSize',21, 'FontName','Arial')

% 尝试绘制边框
try
    xline(ax1, ax1.XLim, 'Color','k', 'Alpha',1, 'LineWidth',1.5)
    xline(ax2, ax2.XLim, 'Color','k', 'Alpha',1, 'LineWidth',1.5)
    xline(ax3, ax3.XLim, 'Color','k', 'Alpha',1, 'LineWidth',1.5)
catch
end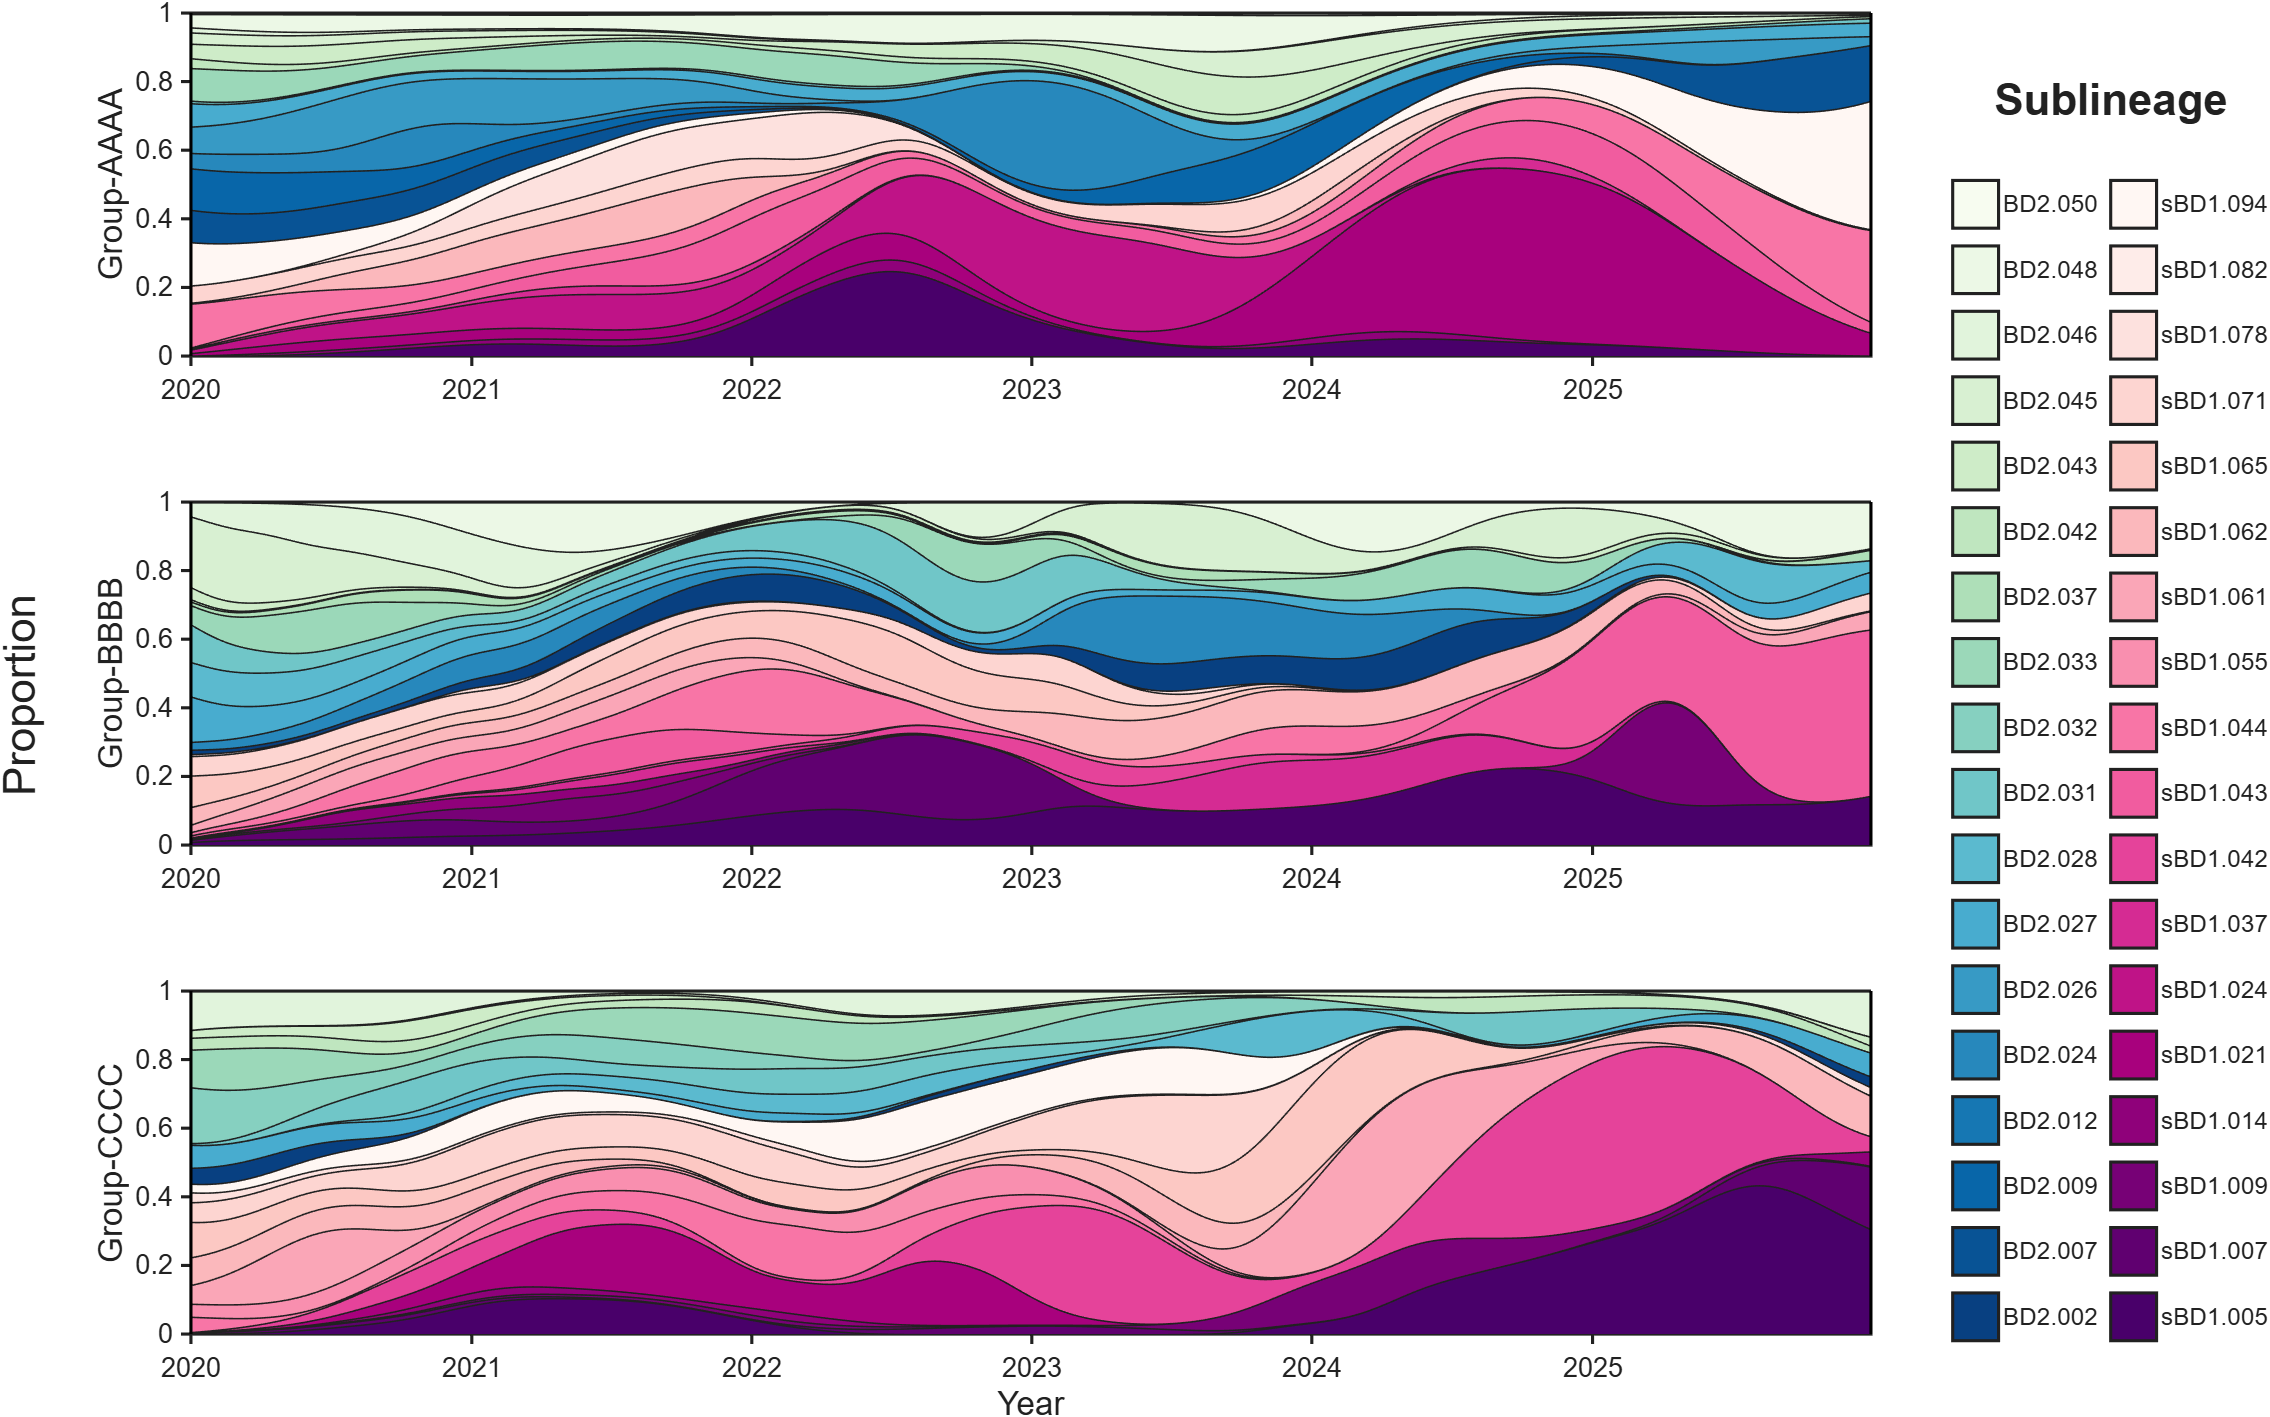
结
完整代码、相关工具函数、及本文所使用数据已经放在如下gitee仓库:
网盘链接,不做后续更新: