本次分享一个Python基因组数据可视化工具figeno。
figeno擅长可视化三代long reads、跨区域基因组断点视图(multi-regions across genomic breakpoints)、表观组数据(HiC、ATAC-seq和ChIP-seq等)可视化、WGS中的CNV和SV可视化等。
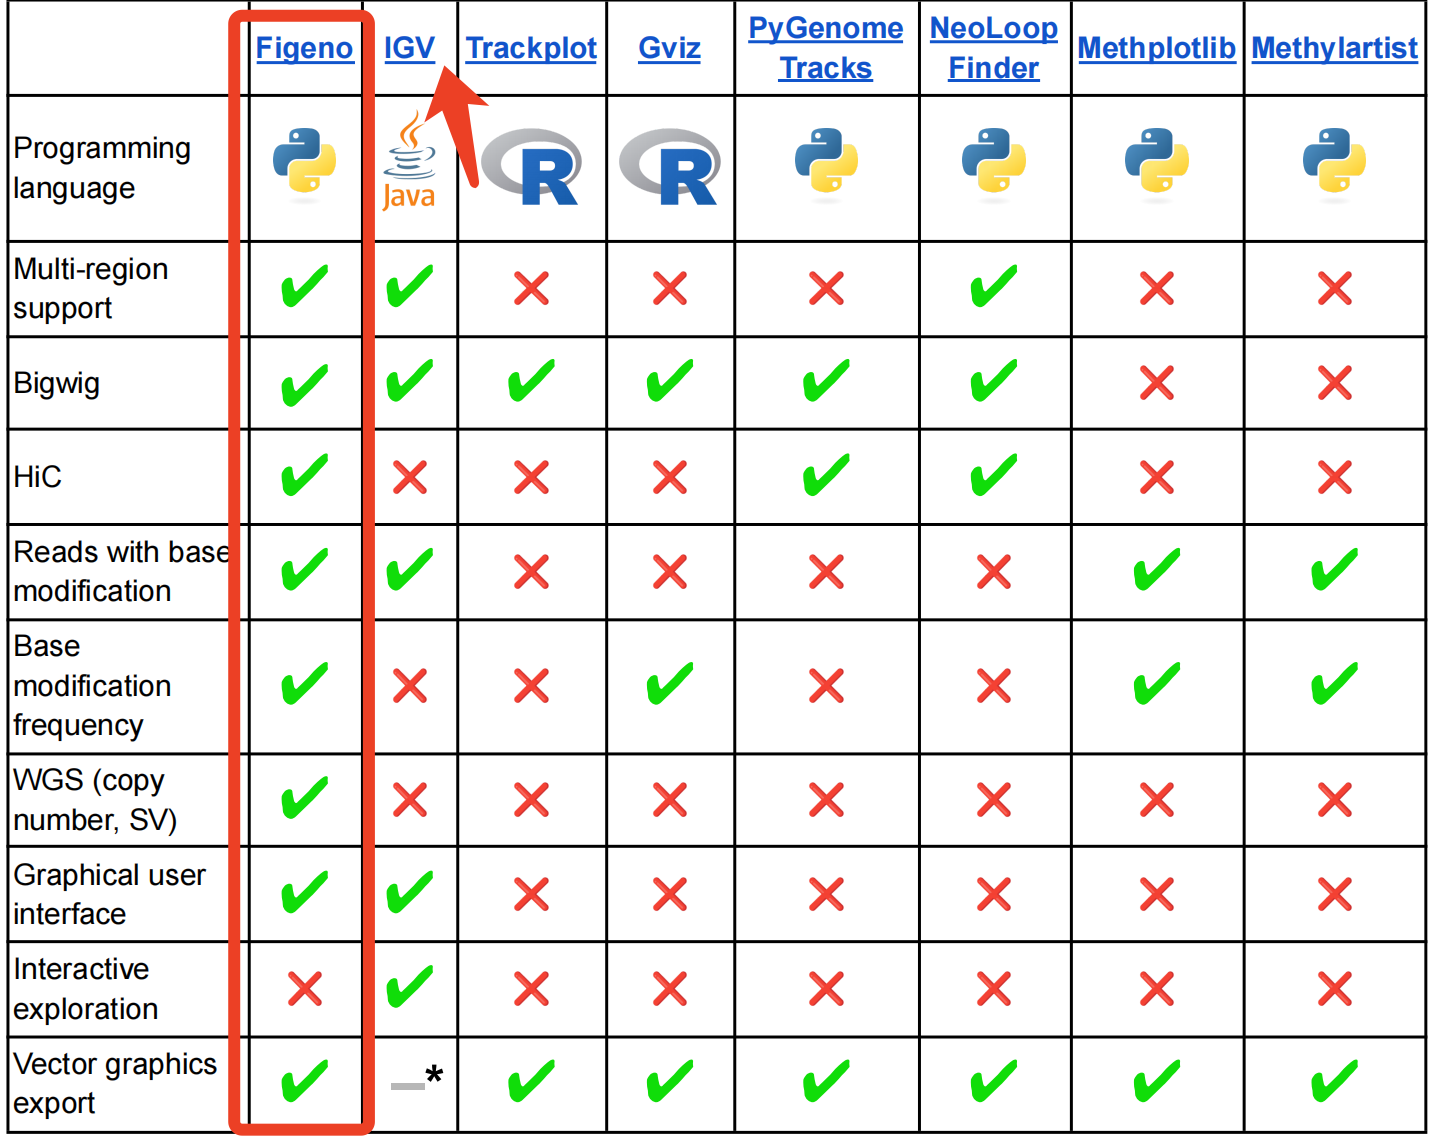
figeno部分功能优秀于老牌工具如IGV,详细对比如下,
以下简单列举figeno使用案例:
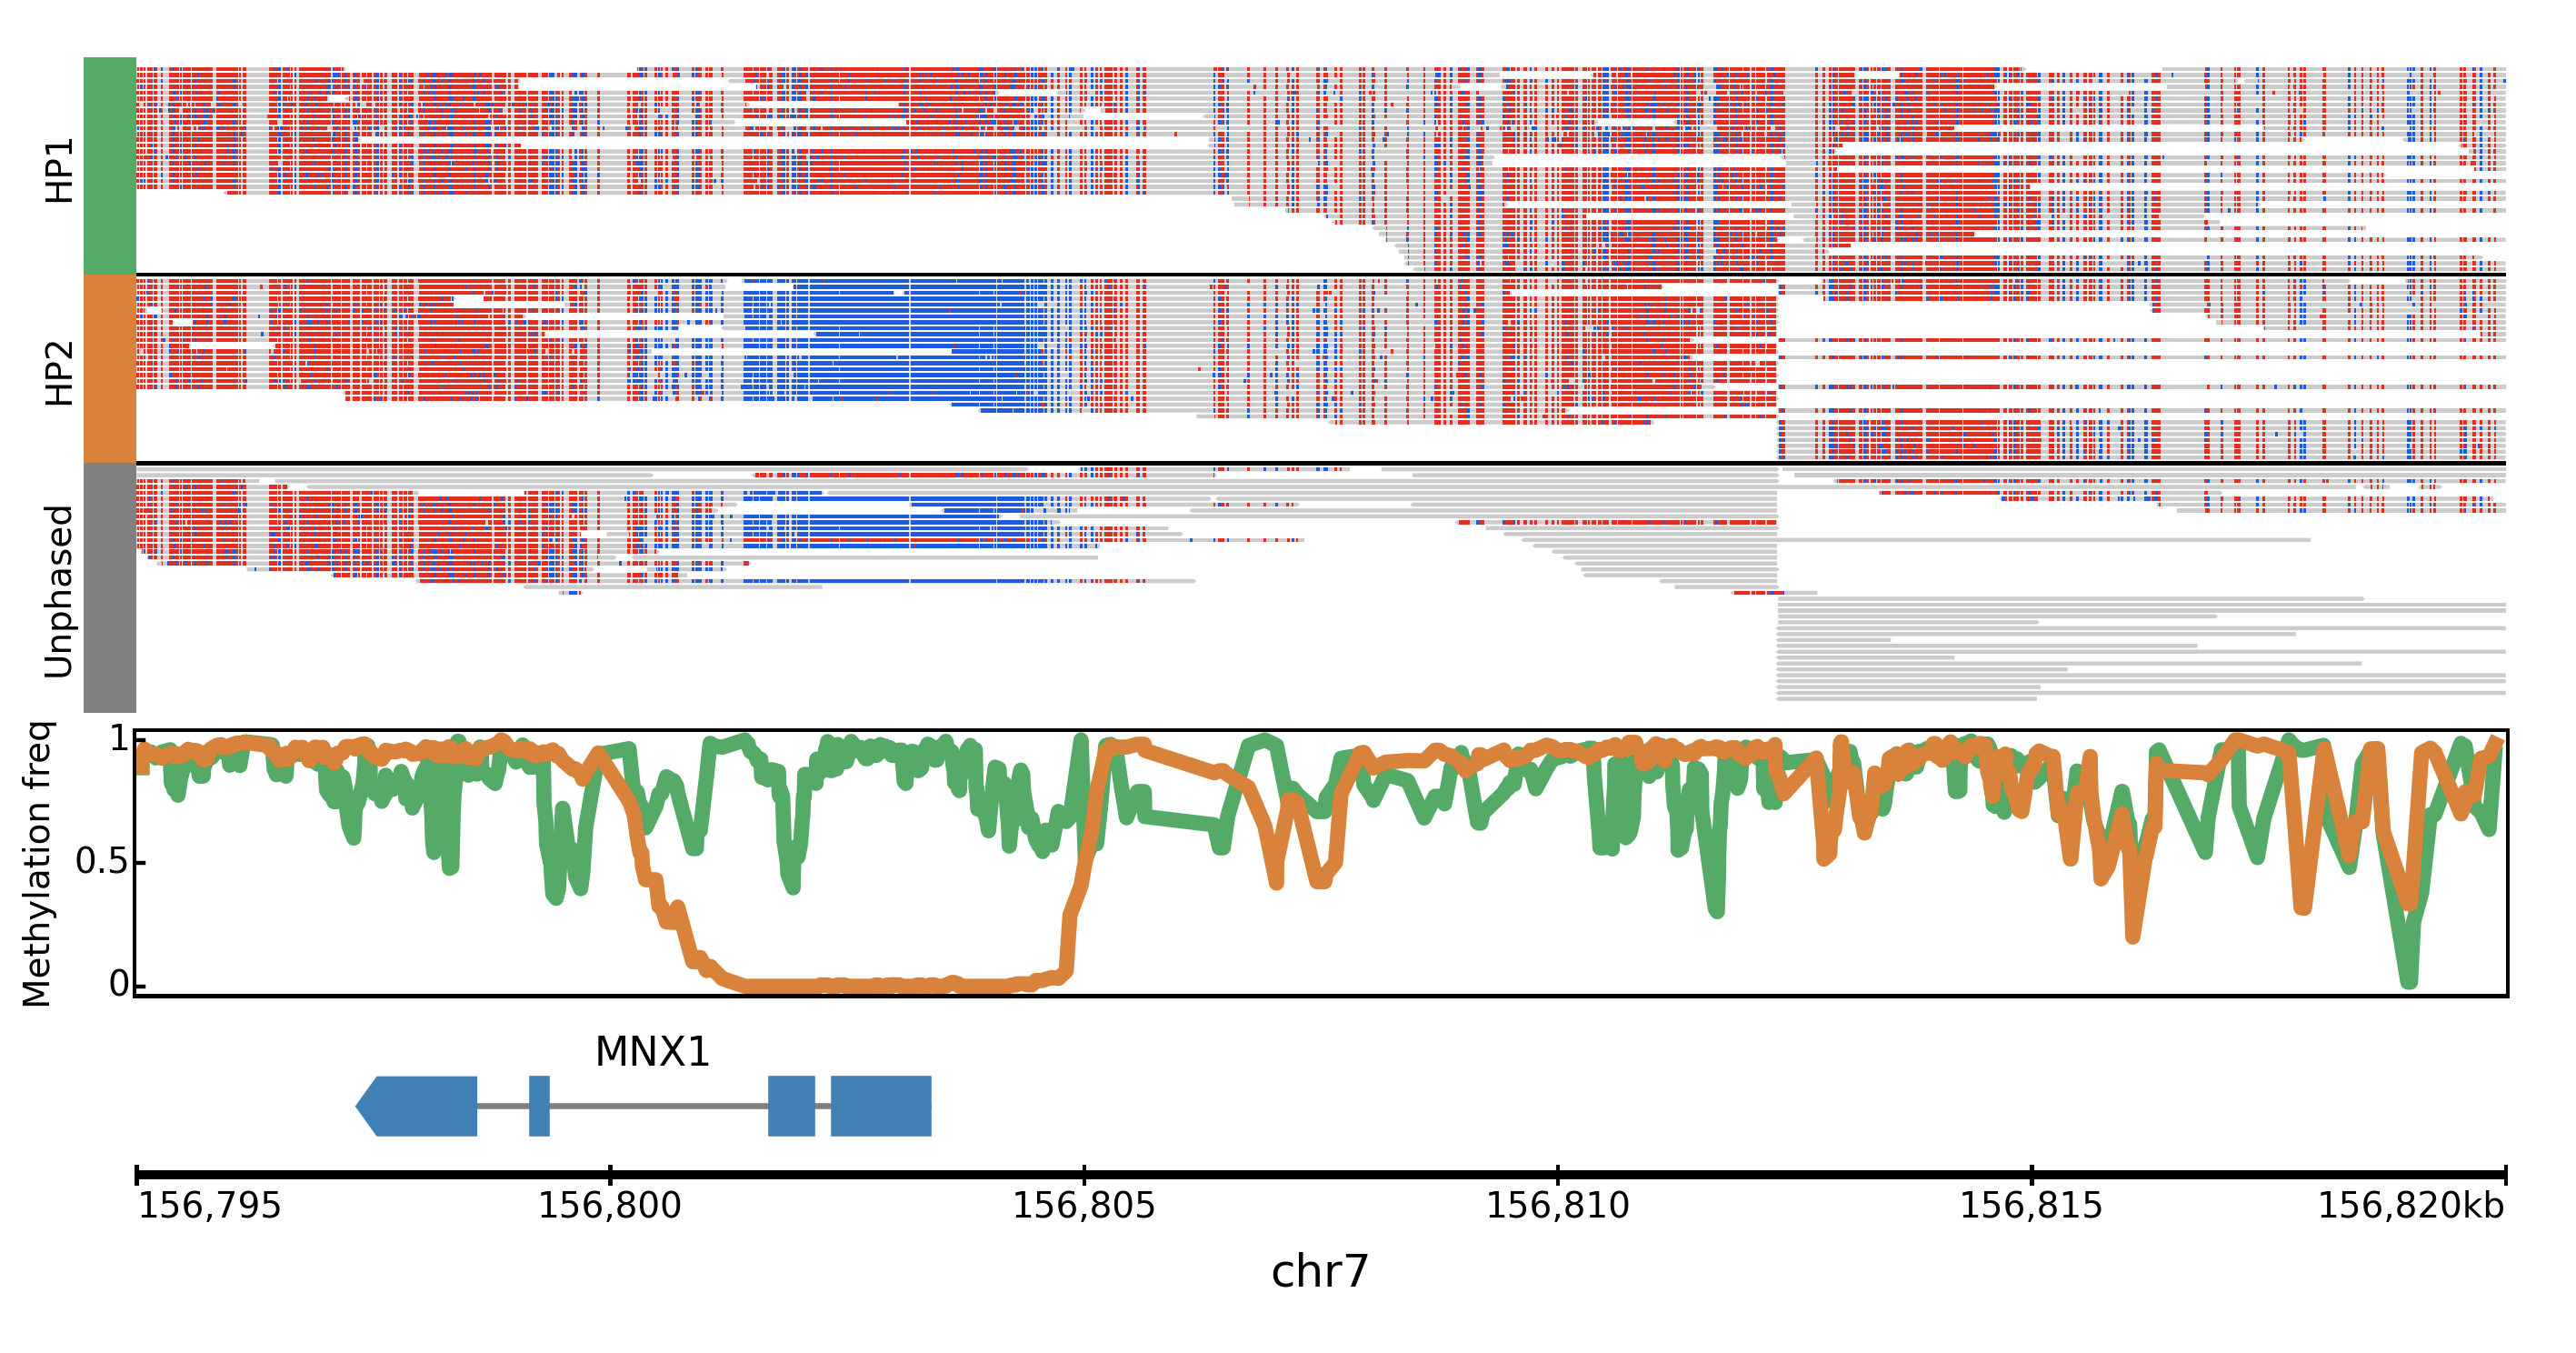
支持三代测序数据可视化(Nanopore, PacBio数据),例如, base modification(5mC、hmC、6 mA、5mC、5hmC))
支持多种格式数据类型输入
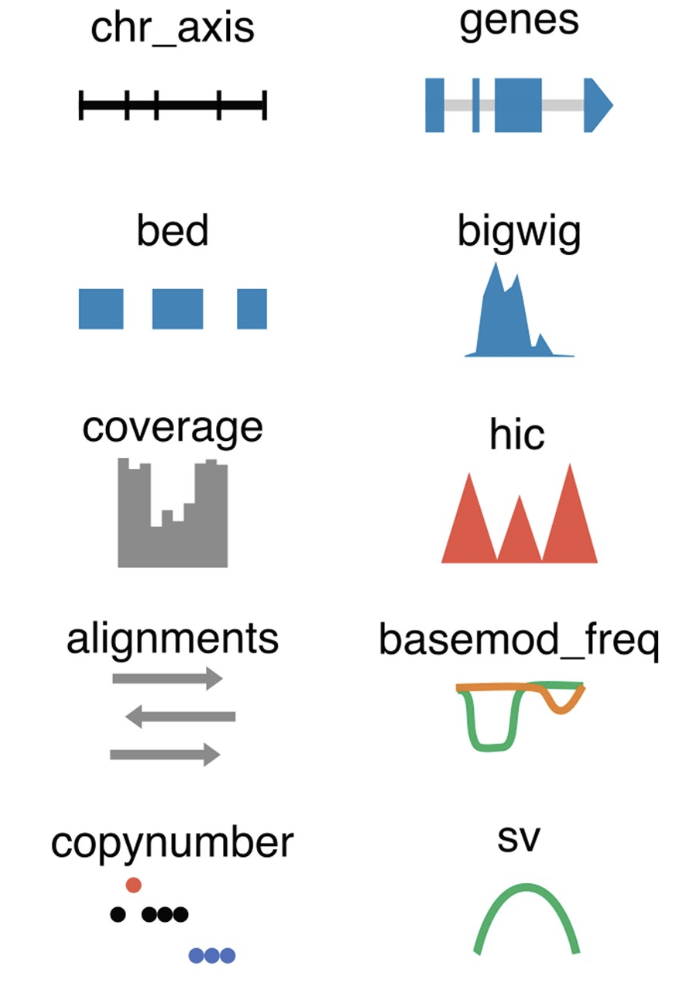
chr_axis: the genomic coordinates,
genes: annotated genes in the region
bed:additional custom genomic annotation
bigwig:visualization of epigenetic data types including ChIP-seq or ATAC-seq
hic:visualize HiC data (.cool format)等。
支持多种格式publication-quality fIgures导出
例如,bitmap (png)或者矢量图r(svg, pdf)等
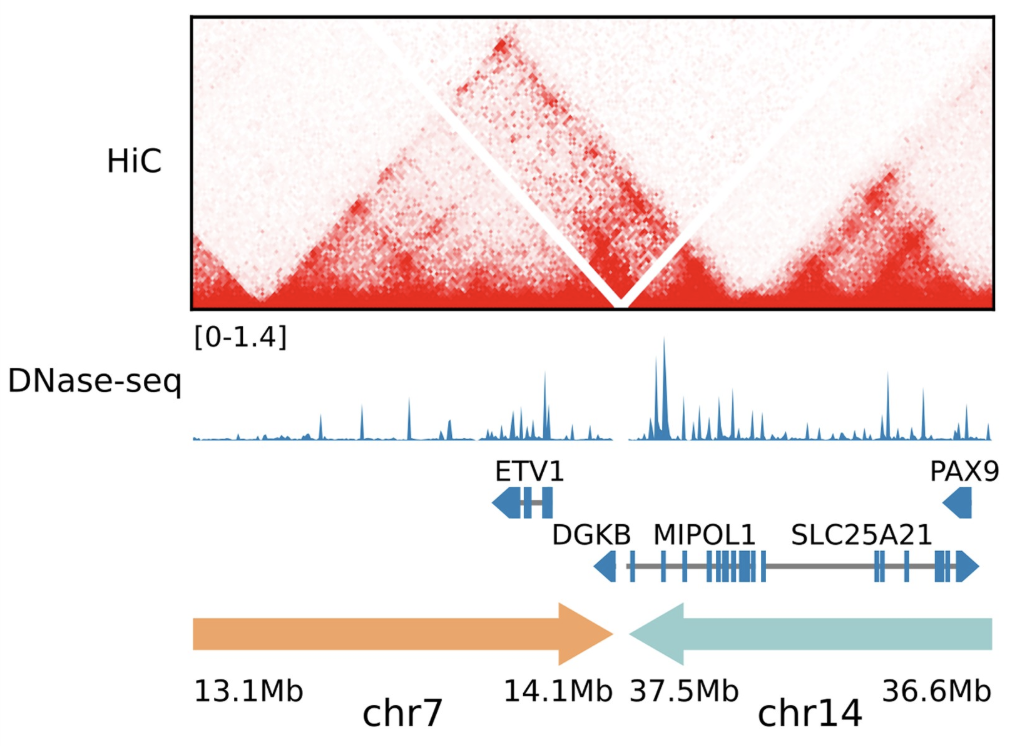
HiC data across breakpoints,展示跨基因组区域的染色质相互作用,
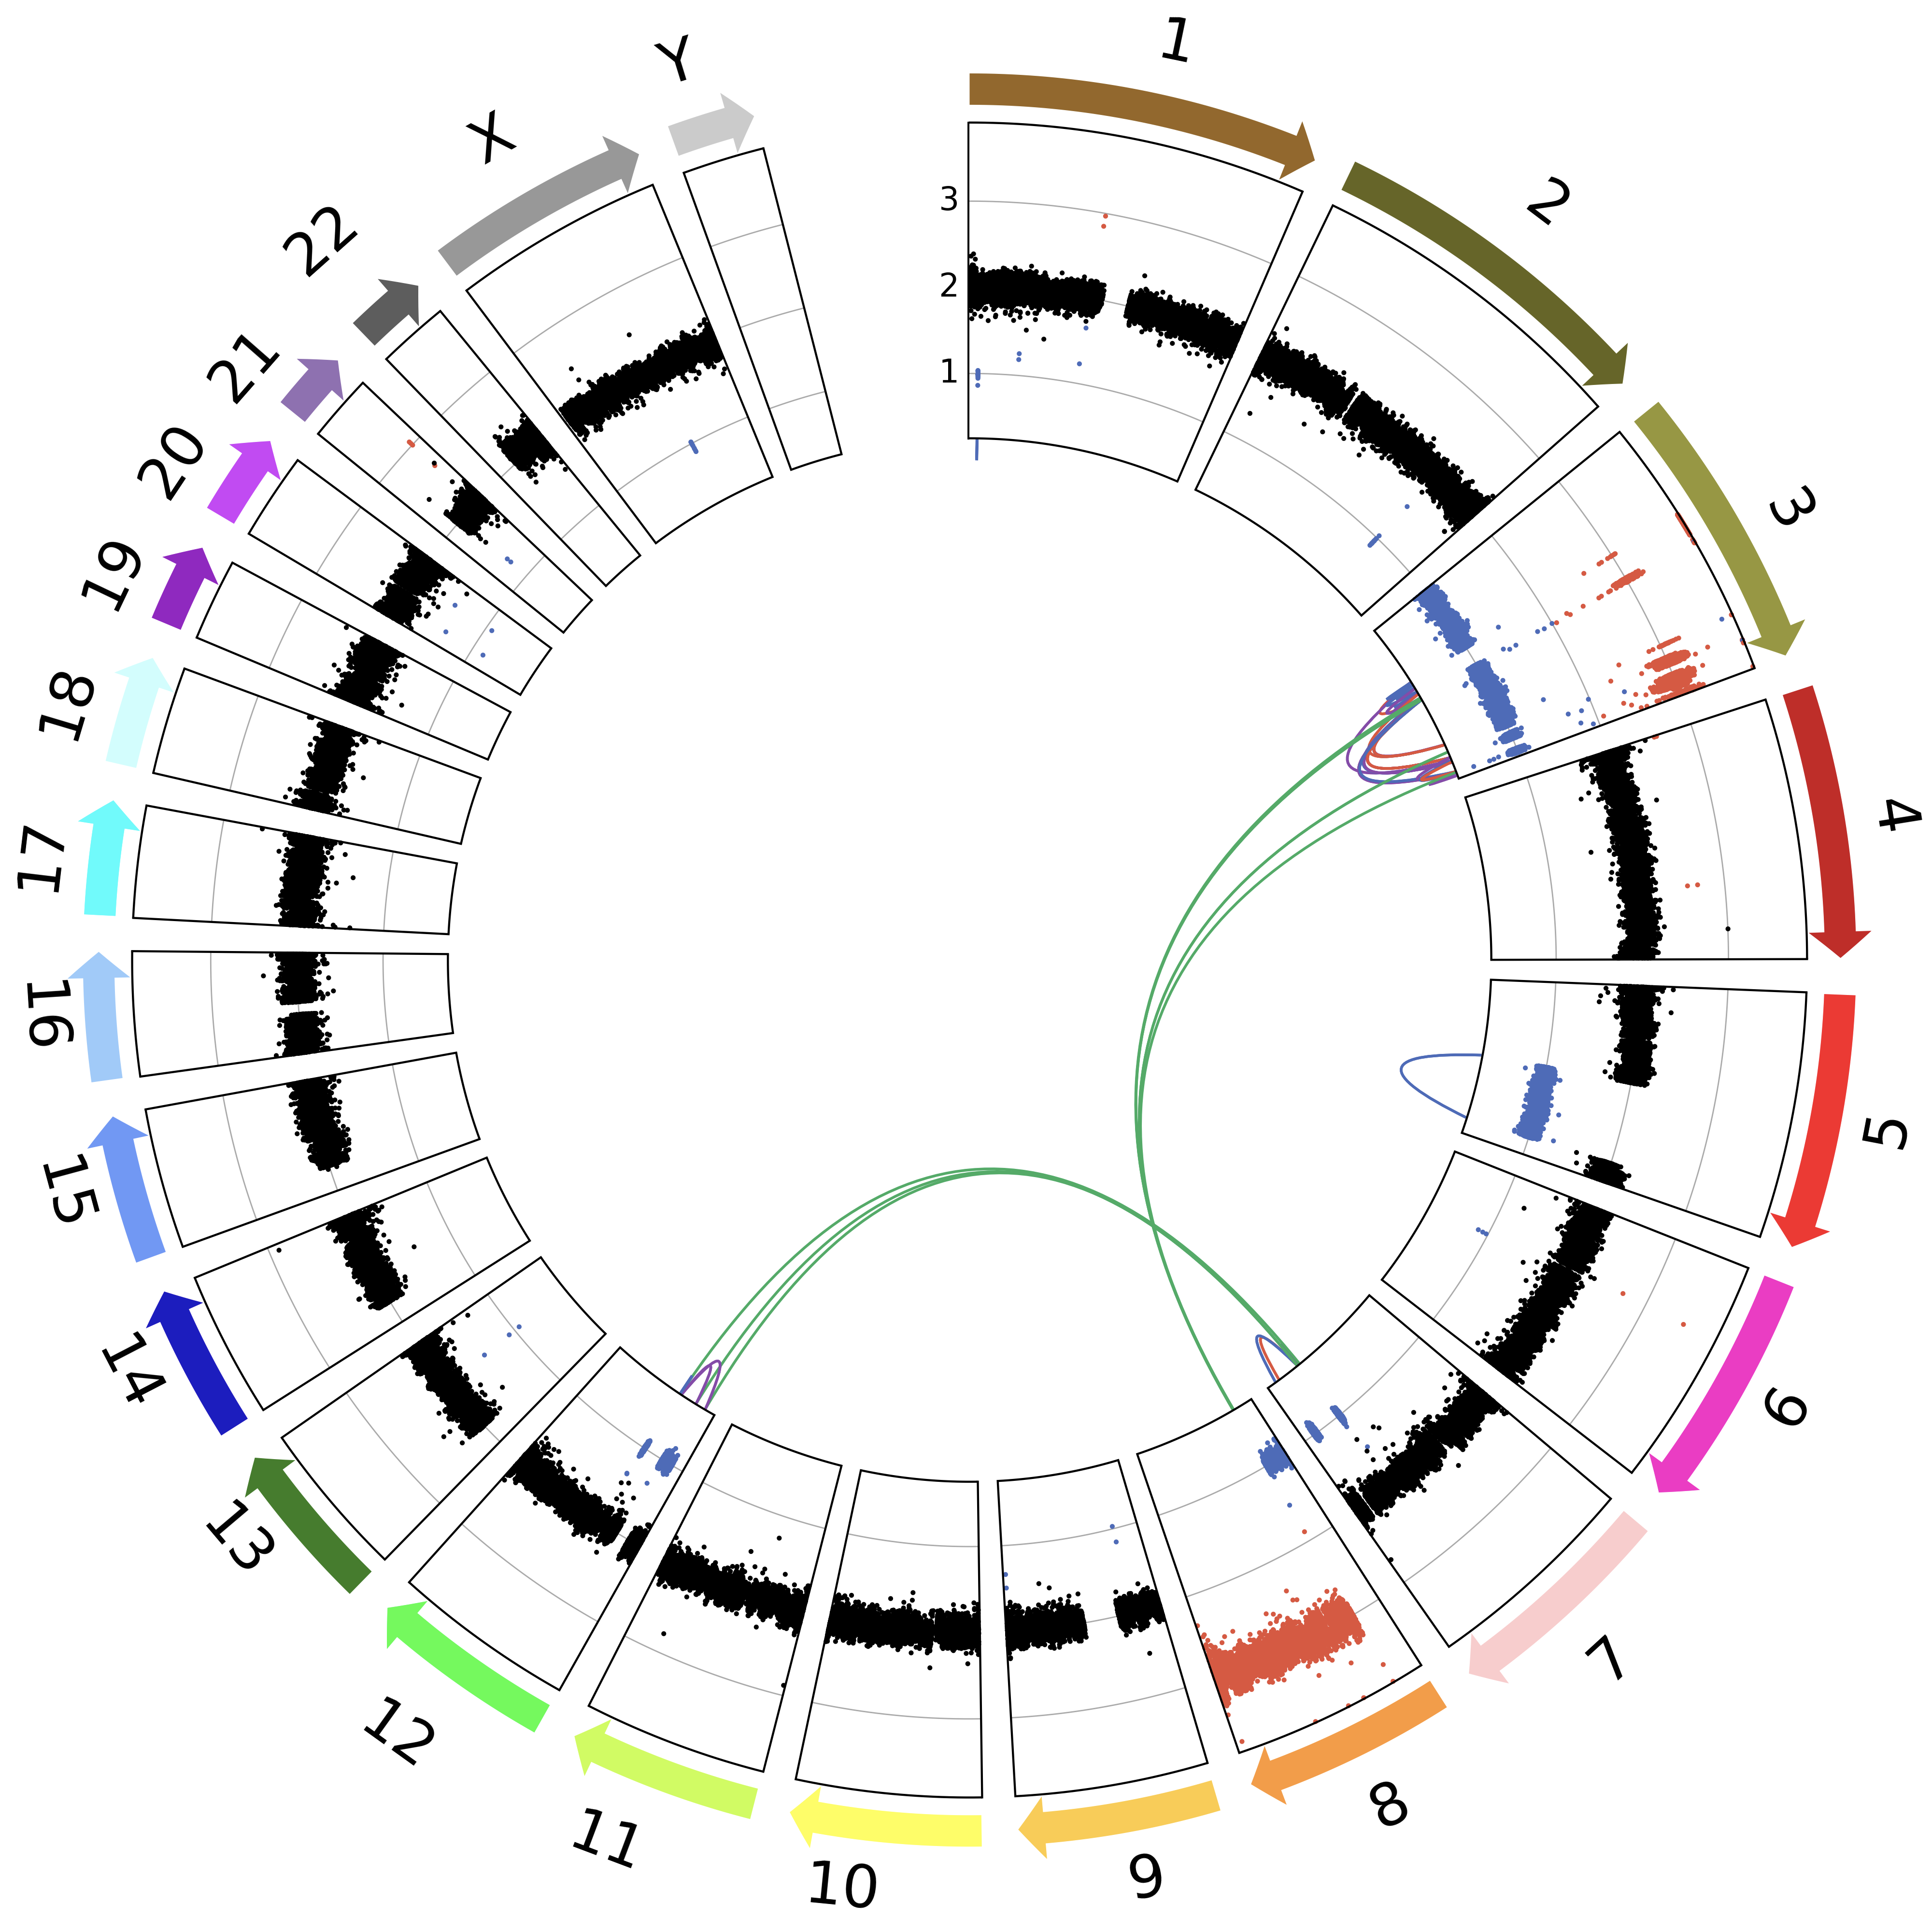
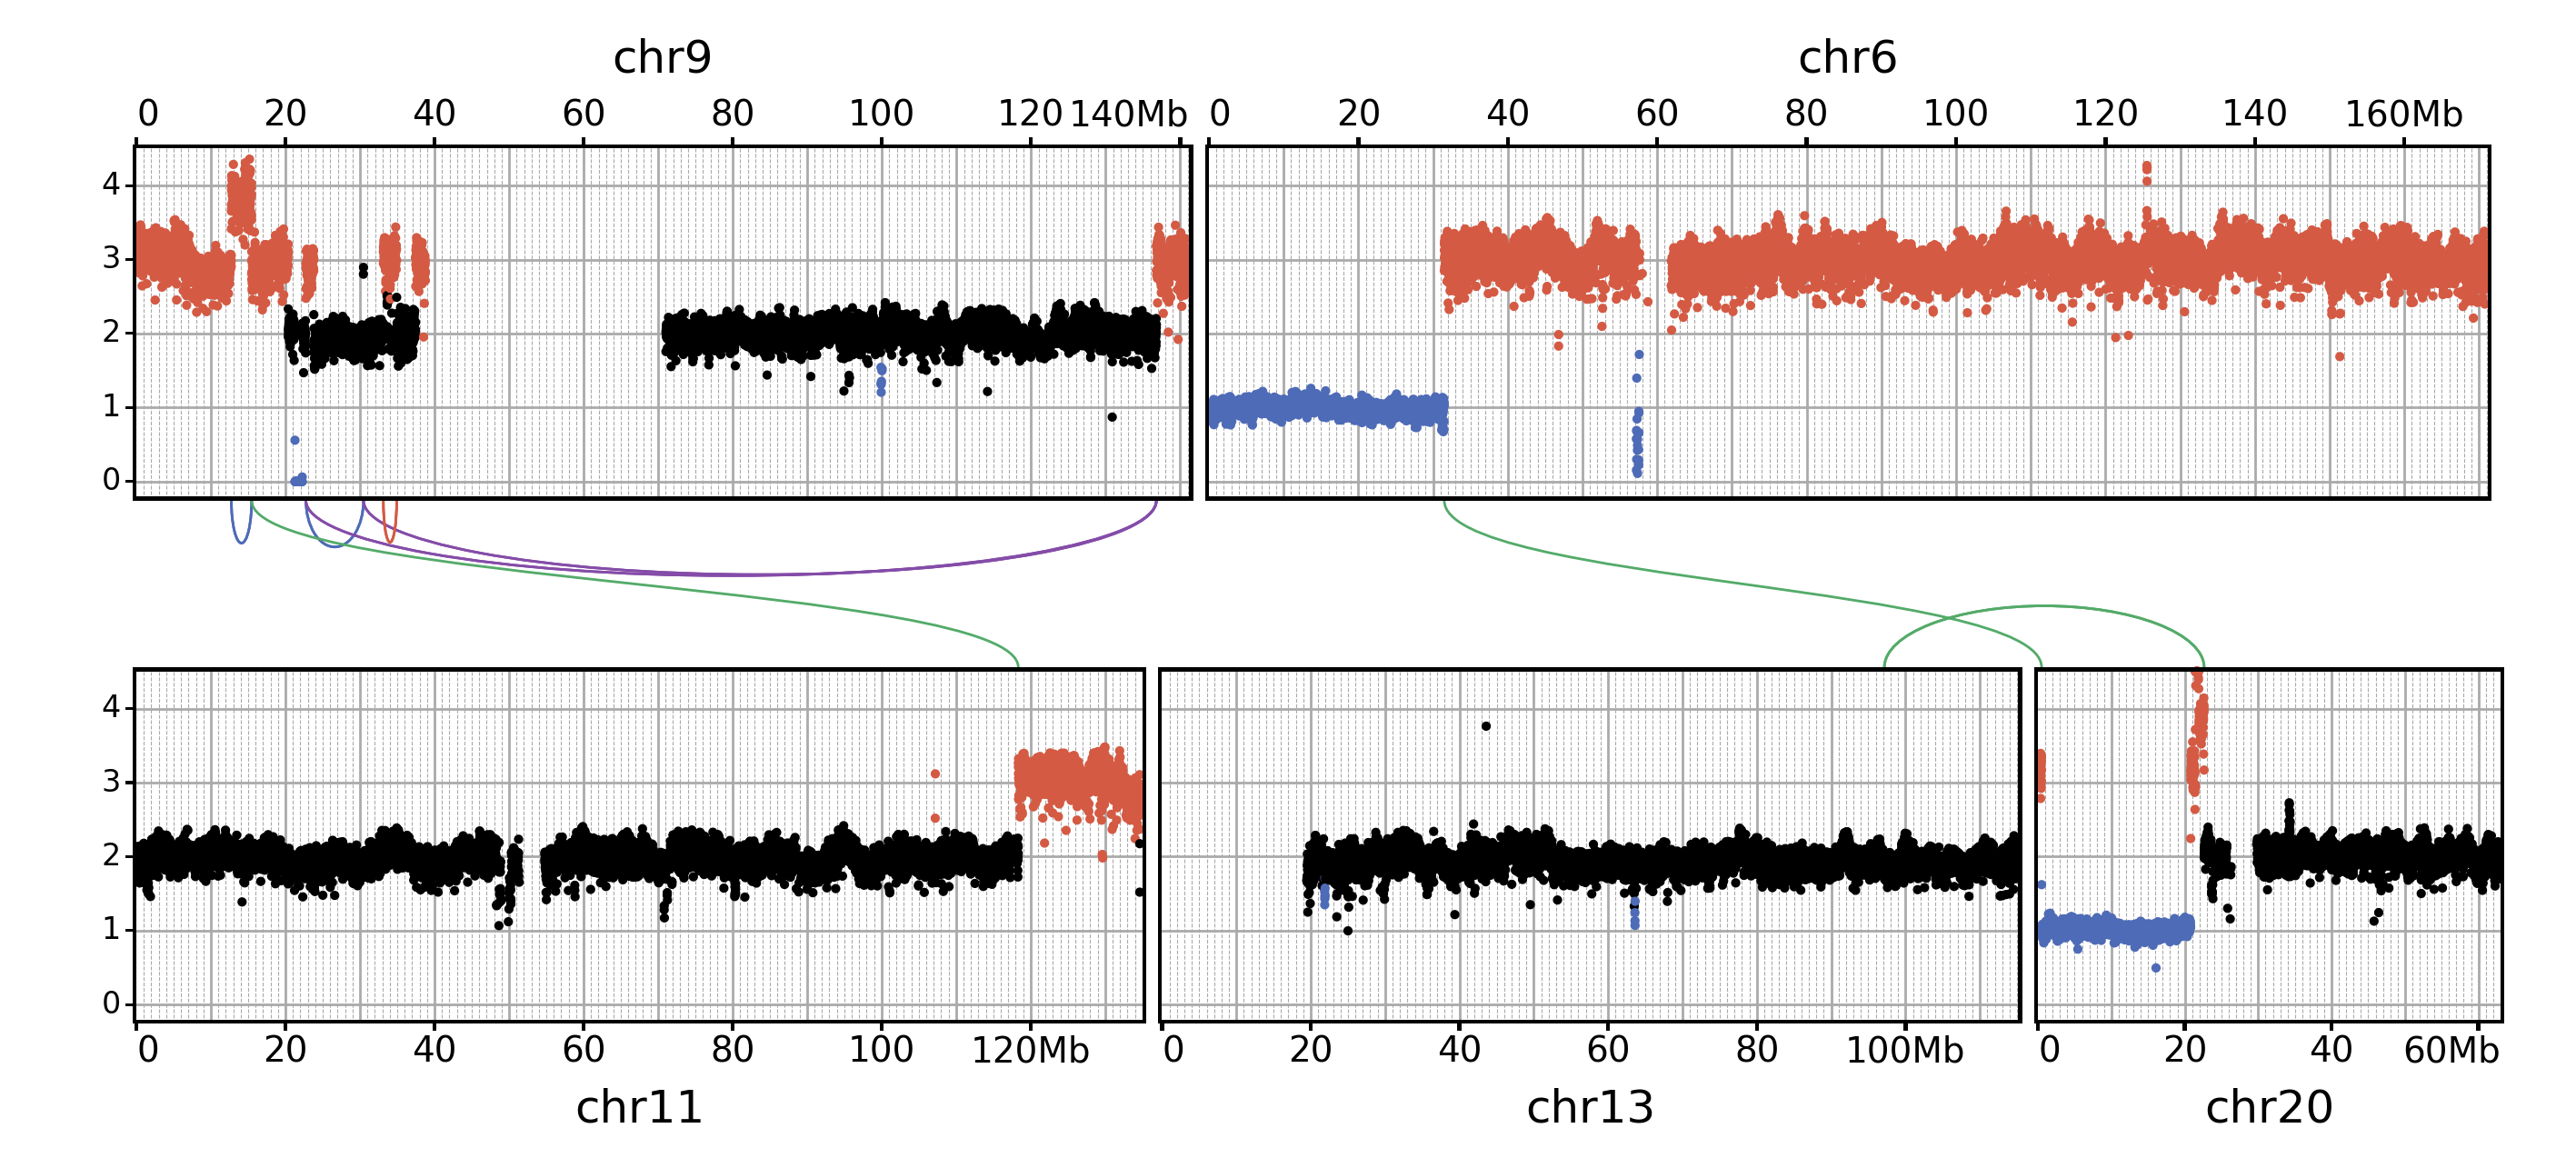
WGS中的CNV和SV可视化
asm
Symmetrical layout for WGS
show the copy-number data on two rows, with the SVs in between
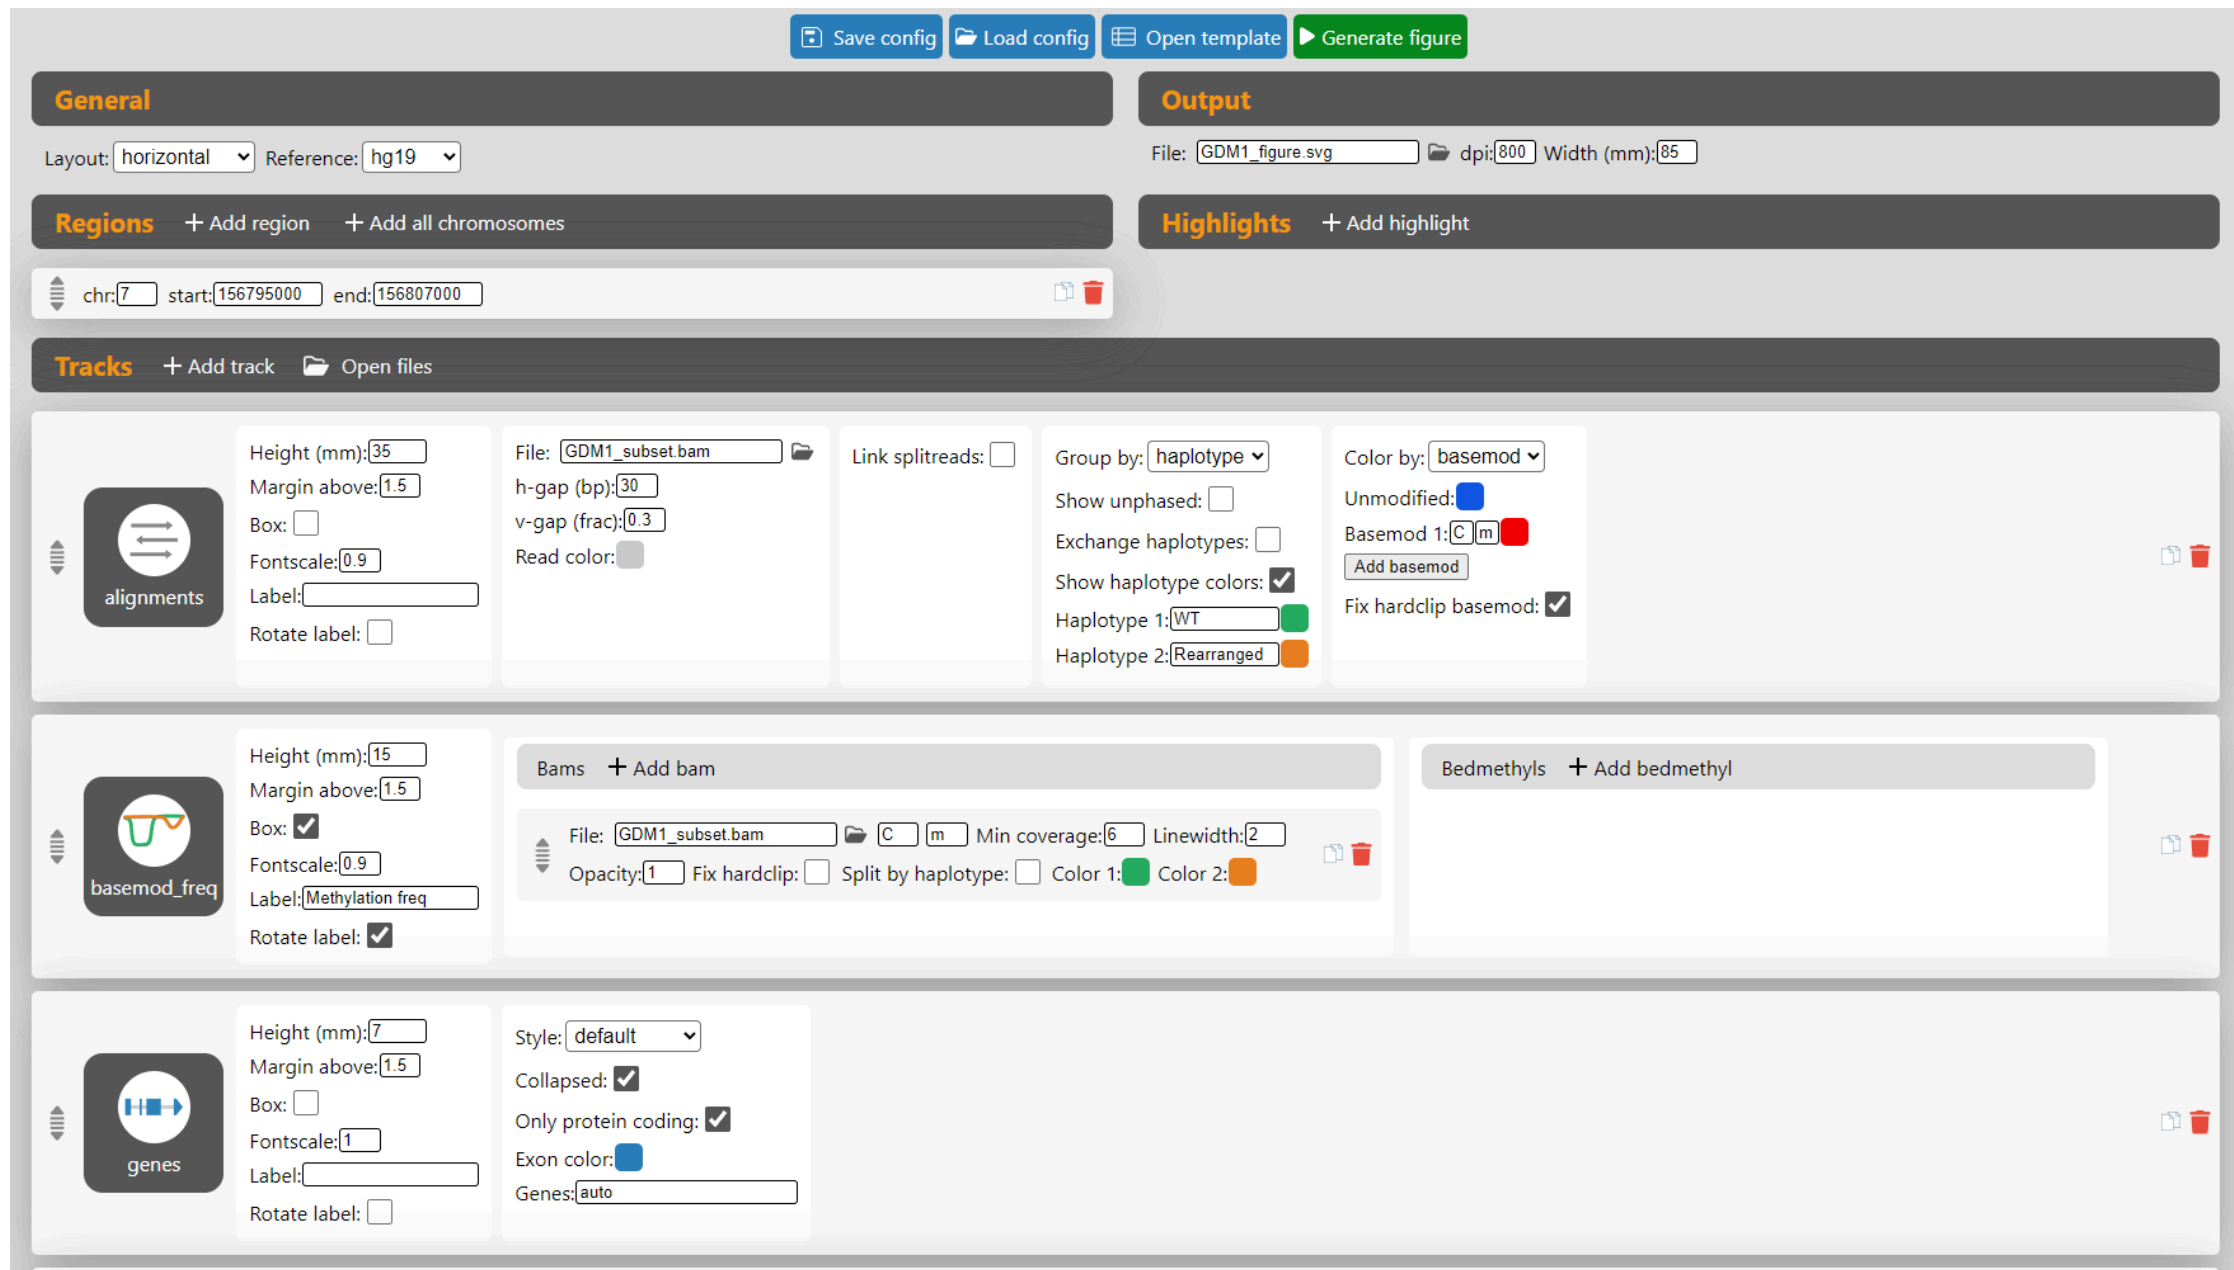
支持GUI界面
支持Python编程API
from figeno import figeno_make

config={"general":{"reference":"hg19","layout":"horizontal"}}
config["output"] = {"file":"figure.svg","dpi":200,"width":180}
config["regions"] = [{"chr":"17","start":7534342,"end":7628246}]
config["tracks"] = [
    {"type":"bigwig","file":"/path/to/H3K27ac.bigWig","color":"#e74c3c","label":"H3K27ac"},
    {"type":"bed","file":"/path/to/CGI.bed","color":"#34495e","label":"CpG islands"},
    {"type":"genes"},
    {"type":"chr_axis"}
  ]
figeno_make(config)