MatLab 二维图像绘制基础
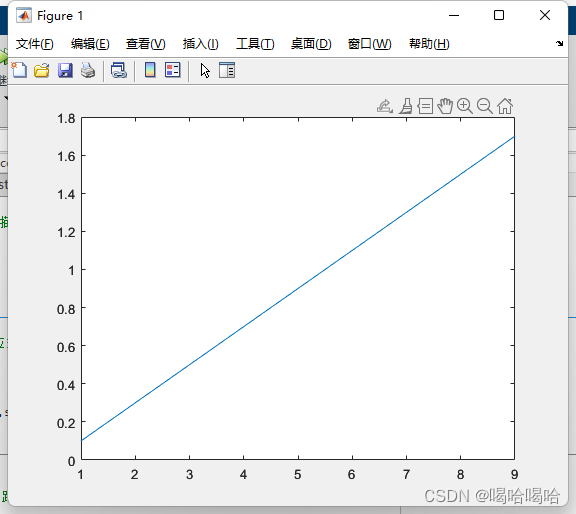
plot 描点绘图
%%
% 二维绘图 ,plot进行描点,步长越小,越平滑
x = [1:9];
y = [0.1:0.2:1.7];
X = x + y*i; % 复数
plot(X)
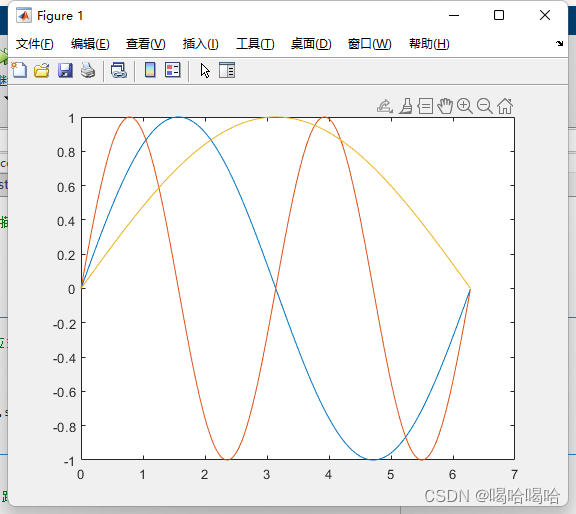
plot绘制矩阵
%%
% 当X Y 为矩阵时,对应矩阵中的元素依次绘制
t = 0:0.01:2*pi;
t = t.';%转置 为列
x = [t,t,t]; %n行3列
y = [sin(t),sin(2*t),sin(0.5*t)]; % n行3列
plot(x,y) % 三条曲线 ,有多少列,就多少条曲线
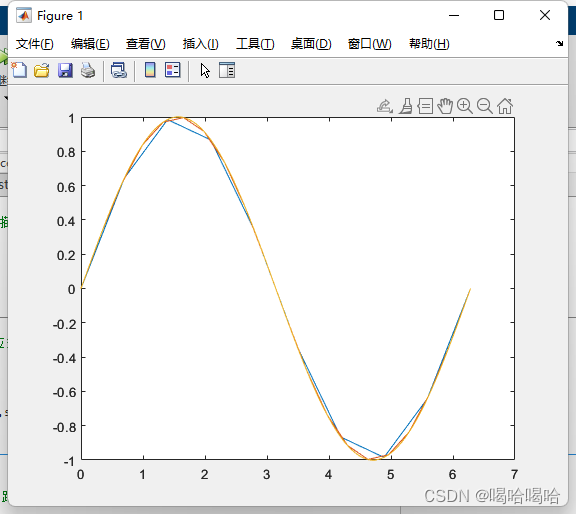
linspace 生成线性间距向量
%%
% 绘制多条曲线
% linspace 生成线性间距向量
clear;
clc;
x1 = linspace(0,2*pi,10); %  0    0.6981    1.3963    2.0944    2.7925    3.4907    4.1888    4.8869    5.5851    6.2832
x2 = linspace(0,2*pi,20);
x3 = linspace(0,2*pi,200);%  步长不一样,直观的看到曲线的平滑度

y1 = sin(x1);
y2 = sin(x2);
y3 = sin(x3);

plot(x1,y1,x2,y2,x3,y3);
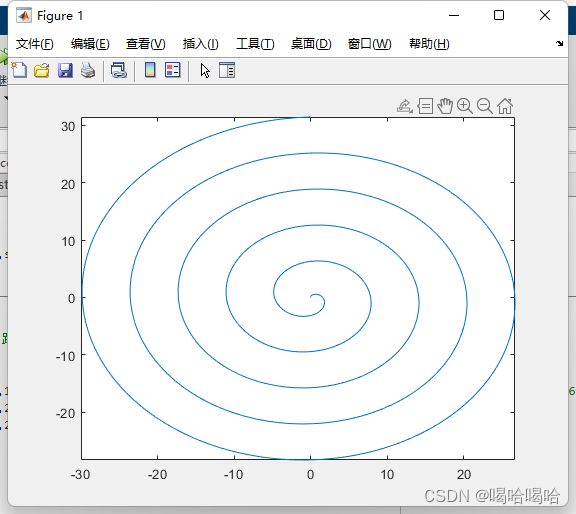
fplot 绘制表达式
%%
% fplot 绘制表达式 图像
fplot(@(x)sin(1./x),[0,0.2]);
%hold on;
fplot(@(t)t*sin(t),@(t)t*cos(t),[0,10*pi]);
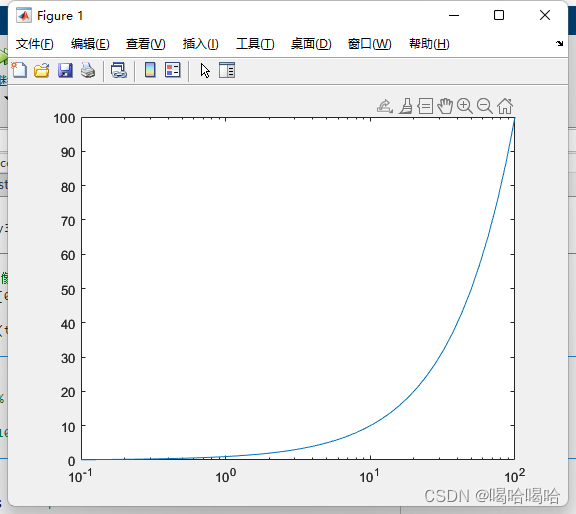
semilogx 对数坐标图
%%
% semilogx 对数坐标图
x = logspace(-1,2); % 0.1-100
y = x;
semilogx(x,y); % log10为底
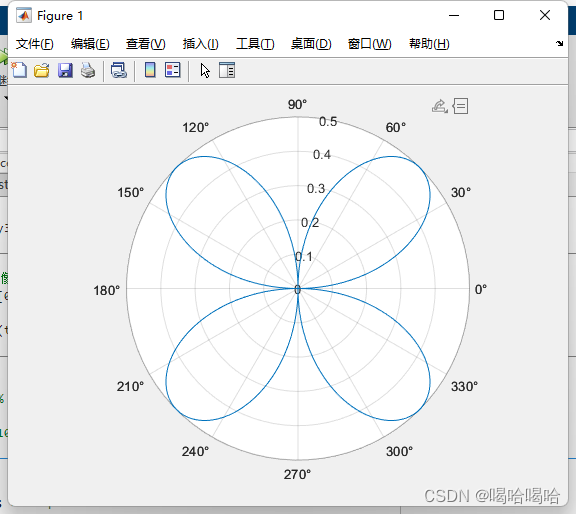
polarplot 极坐标
%%
% 极坐标
 theta = 0:0.01:2*pi; % 0-2pi
 rho = sin(theta) .* cos(theta);
 polarplot(theta,rho);
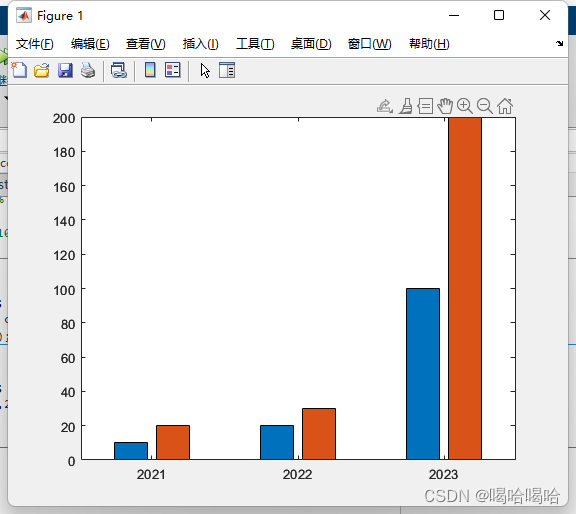
bar 条形图
%%
% 条形图
x = [2021,2022,2023];
y = [10,20;20,30;100,200];
bar(x,y);
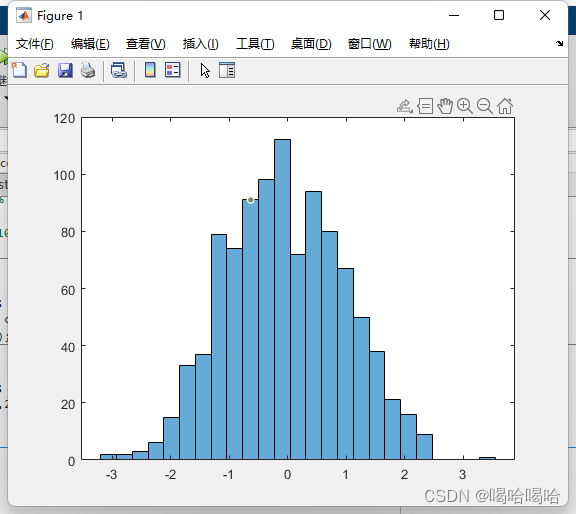
histogram 直方图
%%
% 直方图
x = randn(1000,1);
nbins = 25;
h = histogram(x,nbins);
counts = h.Values;
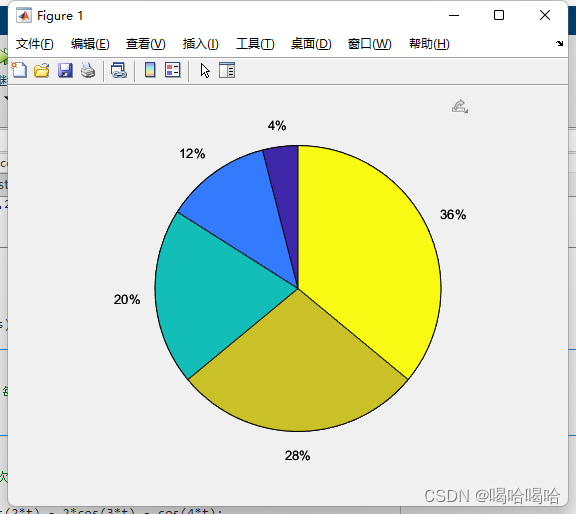
pie 饼图
%%
%饼图
x = [1:2:9];% 从1开始每次+2,  1     3     5     7     9
pie(x);
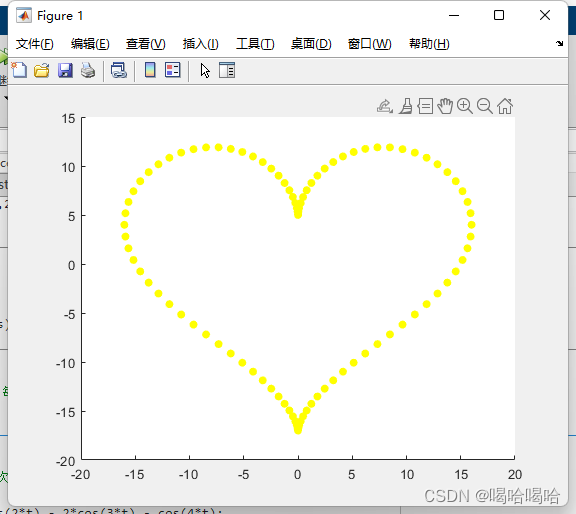
scatter 散点图
%%
%散点图
t = 0:pi/50:2*pi %每次+0.0628
x = 16*sin(t).^3;
y = 13*cos(t) - 5*cos(2*t) - 2*cos(3*t) - cos(4*t);
scatter(x,y,'yellow','filled');
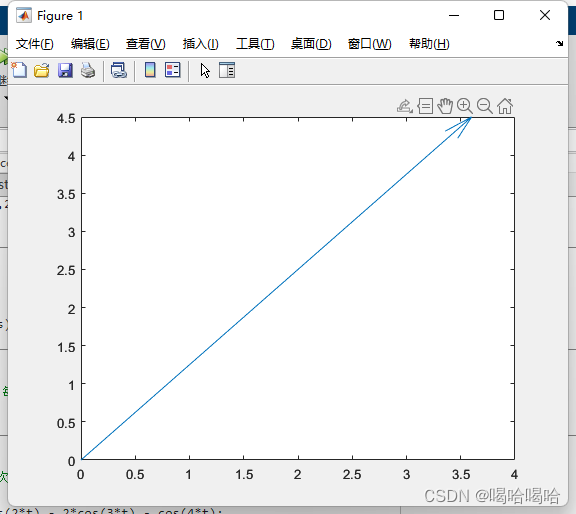
quiver 矢量类图形
%%
%矢量类图形
A = [4,5];
quiver(0,0,A(1),A(2));
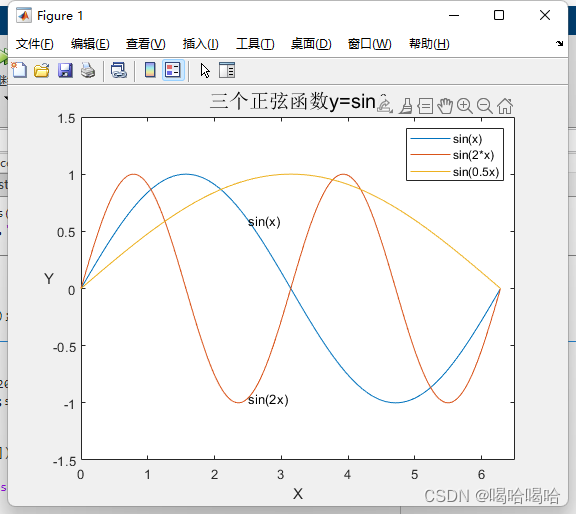
属性设置
%%
% 属性设置
x = linspace(0,2*pi,200);
y = [sin(x);sin(2*x);sin(0.5*x)];
plot(x,y)
%横纵坐标限制
axis([0,6.5,-1.5,1.5]);
%标题
title("三个正弦函数y=sin{\theta}","FontSize",15);
xlabel("X");
ylabel("Y","Rotation",0);
% 文字说明
text(2.5,sin(2.5),'sin(x)');
text(2.5,sin(2*2.5),'sin(2x)');
%图例
legend('sin(x)','sin(2*x)','sin(0.5x)');
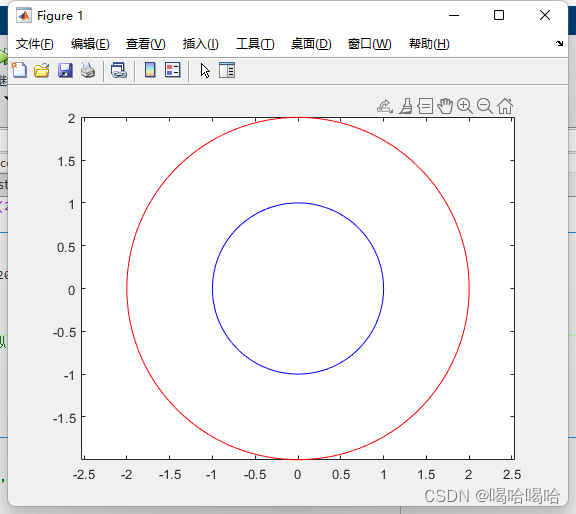
图形保持
%%
% 图形保持
t = linspace(0,2*pi,200);
x = sin(t);
y = cos(t);
plot(x,y,'b');
axis equal;%横坐标与纵坐标相等
hold on;
x1 = 2*sin(t);
y1 = 2*cos(t);
plot(x1,y1,'r');
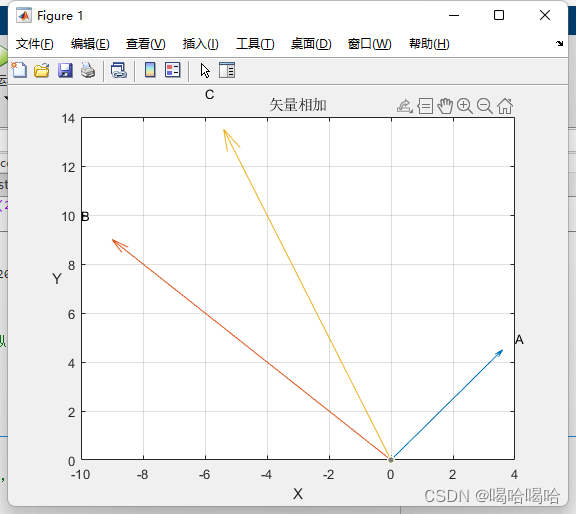
添加图形标注
%%
%课后小练
% 已知向量A、B,求A+B,用矢量图表示并用所学知识添加图形标注
% A = [4,5];
% B = [-10,10];
A = [4,5];
B = [-10,10];
C = A + B;
quiver(0,0,A(1),A(2));
hold on;
quiver(0,0,B(1),B(2));
quiver(0,0,C(1),C(2));
hold off;
title("矢量相加");
xlabel("X");
ylabel("Y","Rotation",0);
text(A(1),A(2),'A');
text(B(1),B(2),'B');
text(C(1),C(2),'C');
grid on; %显示网格线