一、Dash Layout
Dash apps are composed of two parts. The first part is the 'layout', which describes what the app looks like. The second part describes the interactivity of the app.
To get started, create a file namedapp.py , copy the code below into it, and then run it with python app.py
python
from dash import Dash, html, dcc
import plotly.express as px
import pandas as pd
app = Dash()
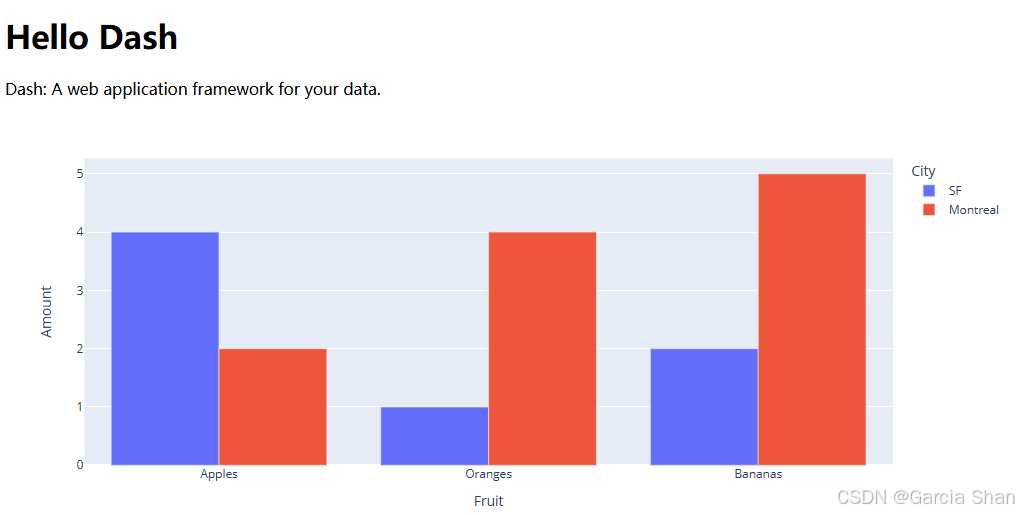
df = pd.DataFrame({
'Fruit': ['Apples', 'Oranges', 'Bananas', 'Apples', 'Oranges', 'Bananas'],
'Amout': [4, 1, 2, 2, 4, 5],
'City': ['SF', 'SF', 'SF', 'Montreal', 'Montreal', 'Montreal']
})
fig = px.bar(df, x='Fruit', y='Amout', color='City', barmode='group')
app.layout = html.Div(
children=[
html.H1(children='Hello Dash'),
html.Div(children='''
Dash: A web application framework for your data.
'''),
dcc.Graph(
id='example-graph',
figure=fig
)
])
if __name__ == '__main__':
app.run(debug=True)二、解读
pythonfrom dash import Dash, html, dcc import plotly.express as px import pandas as pd
- 导入 Dash 库中的Dash 类(用于 Dash应用)、html模块(提供HTML元素)和 dcc 模块(提供Dash核心组件)
- 导入 plotly.express 库,简称 px,用于创建图表
- 导入 pandas 库,简称pd,用于数据处理
pythondf = pd.DataFrame({ 'Fruit': ['Apples', 'Oranges', 'Bananas', 'Apples', 'Oranges', 'Bananas'], 'Amount': [4, 1, 2, 2, 4, 5], 'City': ['SF', 'SF', 'SF', 'Montreal', 'Montreal', 'Montreal'] })
- 创建一个包含水果名称、数量、城市的数据
pythonfig = px.bar(df, x='Fruit', y='Amount', color='City', barmode='group')
- 使用 plotly.express 的 bar 函数创建一个分组条形图,其中 x 轴是水果、y轴是数量、颜色表示不同的城市,'barmode'参数设置为'group',表示将相同水果的条形分组显示。
pythonapp.layout = html.Div( children=[ html.H1(children='Hello Dash'), html.Div(children=''' Dash: A web application framework for your data. '''), dcc.Graph( id='example-graph', figure=fig ) ])
- 设置Dash应用的布局,使用html.Div作为容器。
- 'children'参数用于定义Div容器中的子元素。
- 创建一个H1标题元素,显示文本'Hello Dash'。
- 创建一个Div元素,并在其中放置文本,这段文本是对Dash的简单介绍。
- 创建一个dcc.Graph组件,用于在Dash应用中嵌入图表。
- 为图表组件设置一个唯一的ID,这个ID用于在回调函数中引用这个图表。
- 将之前创建的条形图fig赋值给图表组件的figure属性,这样图表就会在应用中显示。