2024国赛数学建模ABC题思路模型代码:文末获取,9.5开赛后第一时间更新
许久未更新时间序列分析系列内容。现先推出一期灰色预测 GM(1,1)模型的内容。需明确的是,灰色预测并非典型的时间序列分析方法,然而,它可以应用于时间序列数据的分析。鉴于此,将该模型纳入时间序列分析系列内容中进行介绍。后续,会持续更新 ARCH 系列以及其他未介绍的时间序列分析方。
一、方法概念与原理
(一)概念
灰色预测法是一种对含有不确定因素的系统进行预测的方法。它通过对原始数据进行处理,建立灰色模型,从而对系统的未来发展趋势进行预测。灰色预测法具有所需数据量少、计算简单、精度较高等优点,在经济、工程、环境等领域得到了广泛的应用。
(二)灰色系统
灰色系统是指部分信息已知、部分信息未知的系统。在实际问题中,很多系统都属于灰色系统,因为只能获得系统的部分信息。例如,在经济领域,可以获得某些经济指标的历史数据,但对于未来的经济走势却很难准确预测。灰色预测法就是针对这种灰色系统而提出的一种预测方法。
(三)方法原理
灰色预测法的基本原理是通过对原始数据进行累加生成,使原本无规律的数据序列变成有规律的数据序列,然后建立灰色模型,对累加生成的数据序列进行预测,最后再通过累减还原得到原始数据序列的预测值。下面详细阐述GM(1,1)模型的建立步骤:
GM (1,1) 的含义:"GM" 代表灰色模型(Grey Model)。"1" 和 "1" 分别有特定含义:第一个 "1" 表示模型的微分方程阶数;第二个 "1" 表示模型只涉及一个变量。GM (1,1) 模型是最常用的灰色预测模型,它是一个一阶单变量的灰色模型,适用于对具有一定增长趋势的时间序列数据进行预测。同理,GM (n,m) 表示n阶微分方程,m个变量的灰色预测模型。
1.级比检验
灰色预测模型 GM (1,1) 在建立之前需要对原始数据进行级比检验,以确保数据适合建立 GM (1,1) 模型。
对于原始序列
,其级比定义为:
,其中。
为了保证建立的 GM (1,1) 模型有较高的精度,原始数据序列的级比需要满足一定的条件,一般要求级比落在可容覆盖区间内。
注:当原始数据存在负值或零值时,需要对原始数据做平移变换。可以通过比较不同平移常数下模型的性能,选择使得模型性能最佳的平移常数。
2.累加生成
设原始数据序列为:
,对其进行一次累加生成,得到新的数据序列:
,其中。
累加生成的目的是使原始数据序列中的随机波动减弱,呈现出一定的规律性。通过累加生成,可以将原本无规律的数据序列变成近似指数增长的有规律的数据序列,从而便于建立灰色模型进行预测。
3.建立灰色模型
(1)设的紧邻均值生成序列为:
,其中
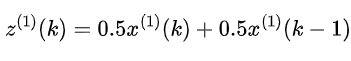
。
(2)建立GM(1,1)模型
GM (1,1) 模型的微分方程形式为,其中和为待确定的参数。将微分方程离散化,得到差分方程形式为。
(3)求解未知参数
利用最小二乘法求解参数和。GM (1,1) 模型的时间响应函数为:
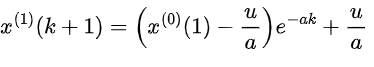
,其中。
4.预测和检验
(1)预测
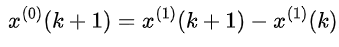
对时间响应函数进行累减还原,得到原始数据序列的预测值为:
(2)后残差检验(模型检验)
a.计算原始数据序列的标准差S1,计算残差序列的标准差S2;
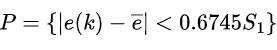
b.计算后验差比值C=S2/S1,计算小误差概率P;
c.根据后验差比值和小误差概率的值,对照后验差检验表,判断模型的精度等级。一般来说,C小于0.35和P大于0.95时,说明模型精度较高。
注:对于GM (n,m) 模型,其建立过程较为复杂,这里不再详细介绍。
(四)优点与缺点
1.优点:对数据要求较低,所需数据量少,不要求数据具有典型的分布规律;适用于短期预测,在短期趋势分析中往往能给出较为准确的预测值,对于一些具有一定趋势但波动不大的时间序列数据预测效果较好。
2.缺点:对于具有剧烈波动或突变的数据预测效果不佳;缺乏严格的理论基础支撑,与一些基于成熟理论的预测方法相比,其可靠性在某些情况下可能受到质疑。
二、GM(1,1)代码
import pandas as pdimport numpy as npimport matplotlib.pyplot as plt
# 读取 Excel 数据data = pd.read_excel('GM.xlsx')
# 提取时间序列数据(替换成自己的数据)data = data.iloc[:, 1].values
# 平移变换translation_value = 80 # 可以根据实际情况调整平移值translated_data = data + translation_value
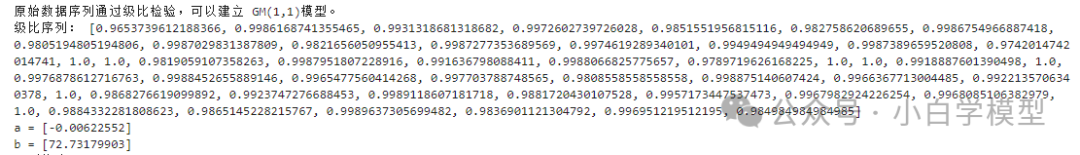
# 级比检验def check_ratio(X): n = len(X) ratios = [] for k in range(2, n + 1): ratio = X[k - 2] / X[k - 1] ratios.append(ratio) lower_bound = np.exp(-2 / (n + 1)) upper_bound = np.exp(2 / (n + 1)) valid = all(lower_bound < ratio < upper_bound for ratio in ratios) if valid: print("原始数据序列通过级比检验,可以建立 GM(1,1)模型。") else: print("原始数据序列未通过级比检验,不适合建立 GM(1,1)模型。") return ratios
ratios = check_ratio(translated_data)print("级比序列:", ratios)
# 构建灰色模型 GM(1,1)lens = len(translated_data)data_add = translated_data.cumsum()# 计算原始数据的累加和,得到累加数据ds = translated_data[1:]# 去除原始数据的第一个元素,得到紧邻均值序列zs = -1 / 2 * (data_add[:-1] + data_add[1:])# 根据累加数据计算紧邻均值序列B = np.vstack((zs, np.ones(lens - 1))).T# 构建设计矩阵 B,其中包括紧邻均值序列和全为 1 的列向量Y = ds.reshape(-1, 1)# 将紧邻均值序列重新塑形为列向量,作为因变量 Ya, b = np.dot(np.dot(np.linalg.inv(np.dot(B.T, B)), B.T), Y)print('a =', a)print('b =', b)
# 预测def forecast(k): c = b / a return (translated_data[0] - c) * (np.e ** (-a * k)) + c
data_1_for = []# 累加预测值data_0_for = []# 原始预测值data_1_for.append(forecast(0))data_0_for.append(data_1_for[0])for i in range(1, lens + 7): # 多预测 K 次,自己想预测多少就改成多少 data_1_for.append(forecast(i)) data_0_for.append(data_1_for[i] - data_1_for[i - 1])
# 反平移预测值anti_translated_data_0_for = [val - translation_value for val in data_0_for]
print('预测值为:')for i in anti_translated_data_0_for: print(i)
# 模型检验data_h = np.array(anti_translated_data_0_for[:lens])residuals = [data[i]-data_h[i] for i in range(lens)]
data_mean = np.mean(data)squared_diff_data = [(data[i]-data_mean)**2 for i in range(lens)]S1 = np.sqrt(sum(squared_diff_data)/lens)
residual_mean = np.mean(residuals)squared_diff_residuals = [(residuals[i]-residual_mean)**2 for i in range(lens)]S2 = np.sqrt(sum(squared_diff_residuals)/lens)
C = S2 / S1
# 计算小误差概率 Psmall_error_threshold = 0.6745 * S1small_error_count = sum(1 for res in residuals if abs(res) < small_error_threshold)P = small_error_count / lens
# 计算小误差概率 Psmall_error_threshold = 0.6745 * S1small_error_count = np.sum(np.abs(residuals[:lens]) < small_error_threshold)P = small_error_count / lens
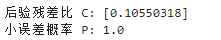
print(f"后验残差比 C: {C}")
print(f"小误差概率 P: {P}")
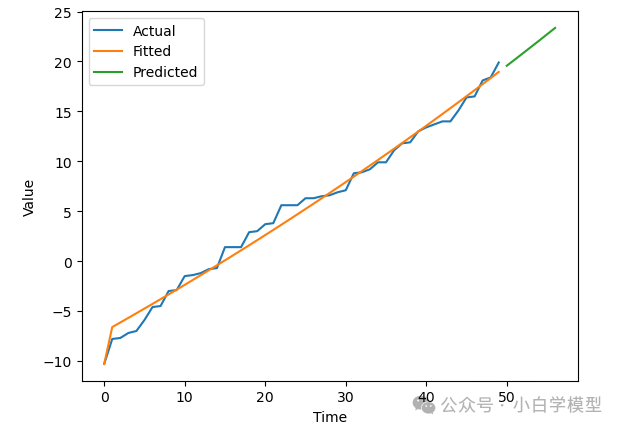
# 绘制拟合值、预测值与实际值对比图plt.plot(range(len(data)), data, label='Actual')plt.plot(range(len(data)), data_h, label='Fitted')plt.plot(range(len(data), len(data)+len(anti_translated_data_0_for)-lens), anti_translated_data_0_for[lens:], label='Predicted')plt.xlabel('Time')plt.ylabel('Value')plt.legend()plt.show()
# 将原始数据、拟合值、外推预测值一起导出到 Exceloutput_data = pd.DataFrame({ 'Predicted Value': np.array(anti_translated_data_0_for[:lens] + anti_translated_data_0_for[lens:]).flatten()})output_data.to_excel('output.xlsx', index=False)
#求MAE平均绝对误差mae=np.mean(np.abs(data-data_h))三、例子
使用Excel随机生成的时间序列数据,如下:
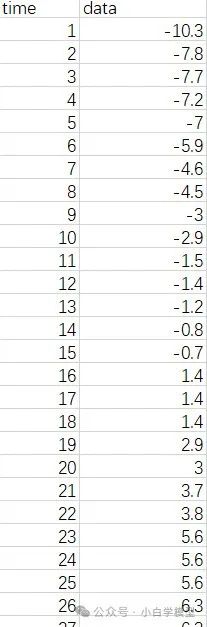
使用上述代码建立灰色预测 GM(1,1)模型,结合了级比检验以确保数据适合建立该模型。同时,还引入了模型的均方误差(MSE)进行评估,最终确定平移变换值为 80。建模结果如下:
1.通过级比检验,可以建立模型。
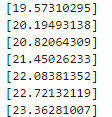
2.七期外推预测值如下:
3.后残差检验通过,说明模型精度较高。
4.时间趋势图展示