Prometheus监控系统
文章目录
- Prometheus监控系统
资源列表
| 操作系统 | 配置 | 主机名 | IP |
|---|---|---|---|
| CentOS 7.9 | 2C4G | prometheus-server | 192.168.93.101 |
| CentOS 7.9 | 2C4G | node-exporter | 192.168.93.102 |
| CentOS 7.9 | 2C4G | grafana | 192.168.93.103 |
基础环境
- 关闭防火墙
bash
systemctl stop firewalld
systemctl disable firewalld- 关闭内核安全机制
bash
setenforce 0
sed -i "s/^SELINUX=.*/SELINUX=disabled/g" /etc/selinux/config- 修改主机名
bash
hostnamectl set-hostname prometheus-server
hostnamectl set-hostname node-exporter
hostnamectl set-hostname grafana
一、部署Prometheus服务
- 作用:收集数据和展示数据
1.1、解压
bash
[root@prometheus-server ~]# tar -zxvf prometheus-2.37.8.linux-amd64.tar.gz- 移动至指定目录
bash
[root@prometheus-server ~]# mv prometheus-2.37.8.linux-amd64 /usr/local/prometheus1.2、配置systemctl启动
bash
[root@prometheus-server ~]# cat >> /etc/systemd/system/prometheus.service << EOF
[Unit]
Description=xinjizhiwa Prometheus Server
Documentation=https://prometheus.io/docs/introduction/overview/
After=network.target
[Service]
Restart=on-failure
ExecStart=/usr/local/prometheus/prometheus \
--config.file=/usr/local/prometheus/prometheus.yml \
--web.enable-lifecycle
ExecReload=/bin/kill -HUP \$MAINPID
LimitNOFILE=65535

[Install]
WantedBy=multi-user.target
EOF- 加载并启动服务
bash
[root@prometheus-server ~]# systemctl daemon-reload
[root@prometheus-server ~]# systemctl enable prometheus.service --now
1.3、监听端口
- Prometheus默认监听
9090端口
bash
[root@prometheus-server ~]# netstat -anpt | grep 9090
tcp6       0      0 :::9090                 :::*                    LISTEN      8659/prometheus
tcp6       0      0 ::1:9090                ::1:56220               ESTABLISHED 8659/prometheus
tcp6       0      0 ::1:56220               ::1:9090                ESTABLISHED 8659/prometheus
1.4、访问Prometheus仪表盘

二、部署Node-Exporter
- 作用:用来收集节点上的数据
2.1、解压
bash
[root@node-exporter ~]# tar -zxvf node_exporter-1.6.1.linux-amd64.tar.gz- 移动至指定目录
bash
[root@node-exporter ~]# mv node_exporter-1.6.1.linux-amd64 /usr/local/node_exporter2.2、配置systemctl启动
bash
[root@node-exporter ~]# cat > /etc/systemd/system/node-exporter.service << EOF
[Unit]
Description=xinjizhiwa node-exporter
Documentation=https://prometheus.io/docs/introduction/overview/
After=network.target

[Service]
Restart=on-failure
ExecStart=/usr/local/node_exporter/node_exporter
ExecReload=/bin/kill -HUP \$MAINPID
LimitNOFILE=65535

[Install]
WantedBy=multi-user.target
EOF- 加载并启动服务
bash
[root@node-exporter ~]# systemctl daemon-reload
[root@node-exporter ~]# systemctl enable node-exporter.service --now
2.3、监听端口
- node-exporter默认监听
9100端口
bash
[root@node-exporter ~]# netstat -napt | grep 9100
tcp6       0      0 :::9100                 :::*                    LISTEN      8378/node_exporter
2.4、访问node-exporter仪表盘

三、配置Prometheus收集Exporter采集的数据
- node-exporter会把数据统一收集,等待Prometheus进行收集数据展示
3.1、编辑Prometheus配置文件
bash
[root@prometheus-server ~]# vim /usr/local/prometheus/prometheus.yml
# my global config
global:  scrape_interval: 3s # 抓取监控的间隔时间,多长时间获取一次数据(生产环境下,建议15-30s)
		 evaluation_interval: 15s # 多久读一次规则
  # scrape_timeout is set to the global default (10s).

# Alertmanager configuration
alerting:
  alertmanagers:
    - static_configs:
        - targets:
          # - alertmanager:9093

# Load rules once and periodically evaluate them according to the global 'evaluation_interval'.
rule_files:
  # - "first_rules.yml"
  # - "second_rules.yml"

# A scrape configuration containing exactly one endpoint to scrape:
# Here it's Prometheus itself.
# 被监控的配置
scrape_configs:
  # The job name is added as a label `job=<job_name>` to any timeseries scraped from this config.
  - job_name: "prometheus"

    # metrics_path defaults to '/metrics'
    # scheme defaults to 'http'.

    static_configs:
      - targets: ["localhost:9090"]
  # 另起一个Job名称,被监控的主体自定义名称
  - job_name: "node-exporter"
    static_configs:
      # 被监控的数据抓取地址
      - targets: ["192.168.93.102:9100"]
3.2、重新加载Prometheus服务
- 此次的加载方式不是用
systemctl进行加载的
bash
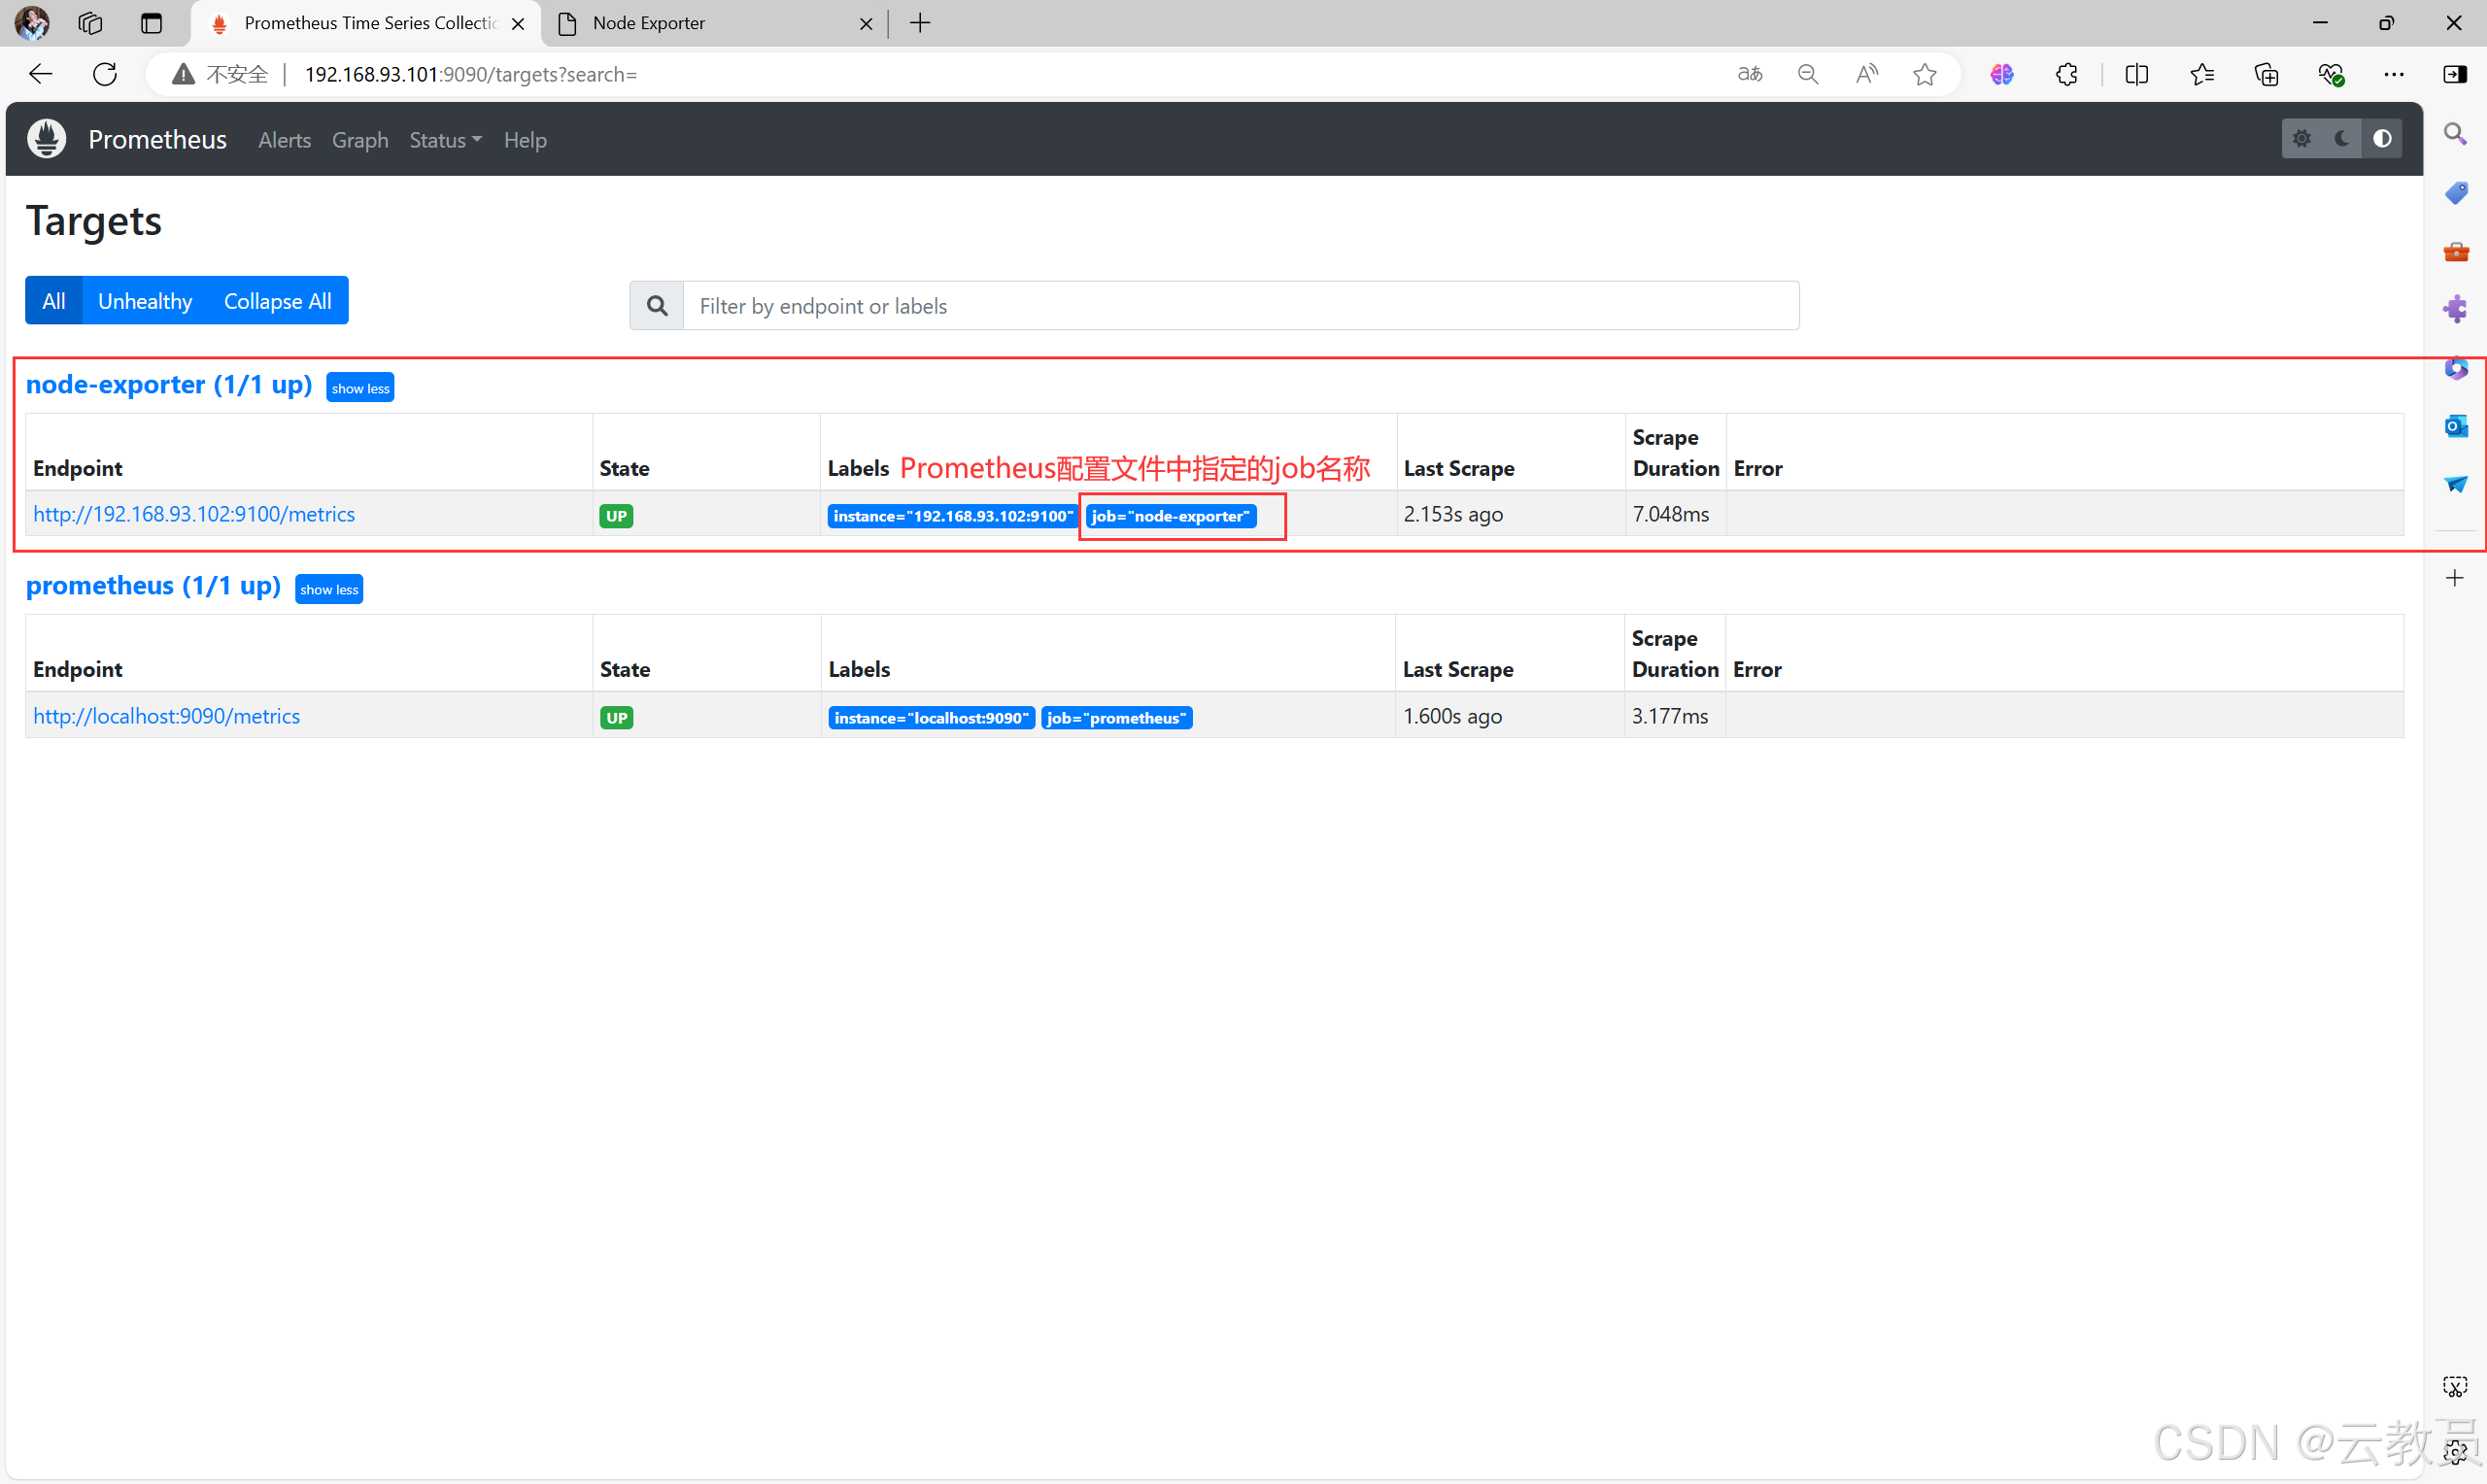
[root@prometheus-server ~]# curl -X POST http://192.168.93.101:9090/-/reload3.3、刷新Prometheus页面
-
点击
Status>>Targets -
此时,就会看到,新配置的被监控项主体的指标列表

四、执行PromeSQL
- Prometheus自己的SQL查询语言
4.1、查看存活的节点
- 使用
UP

4.2、查看CPU指标
- 使用
node_cpu_seconds_total

五、Grafana展示数据
- Grafana是一个开源的数据可视化和监控工具
5.1、安装并启动Grafana
bash
[root@grafana ~]# yum -y localinstall grafana-enterprise-10.0.3-1.x86_64.rpm

[root@grafana ~]# systemctl enable grafana-server.service --now
5.2、监听端口
Grafana默认监听3000端口
bash
[root@grafana ~]# netstat -anpt | grep 3000
tcp6       0      0 :::3000                 :::*                    LISTEN      8421/grafana
5.3、访问Grafana页面
-
默认账户:admin
-
默认密码:admin

-
需重新设置密码即可登录

-
以下就是登录页面

5.4、配置数据源
- 依次点击
home左边的三个横杠>Adminstration>Data sources>Add data-sources>Prometheus


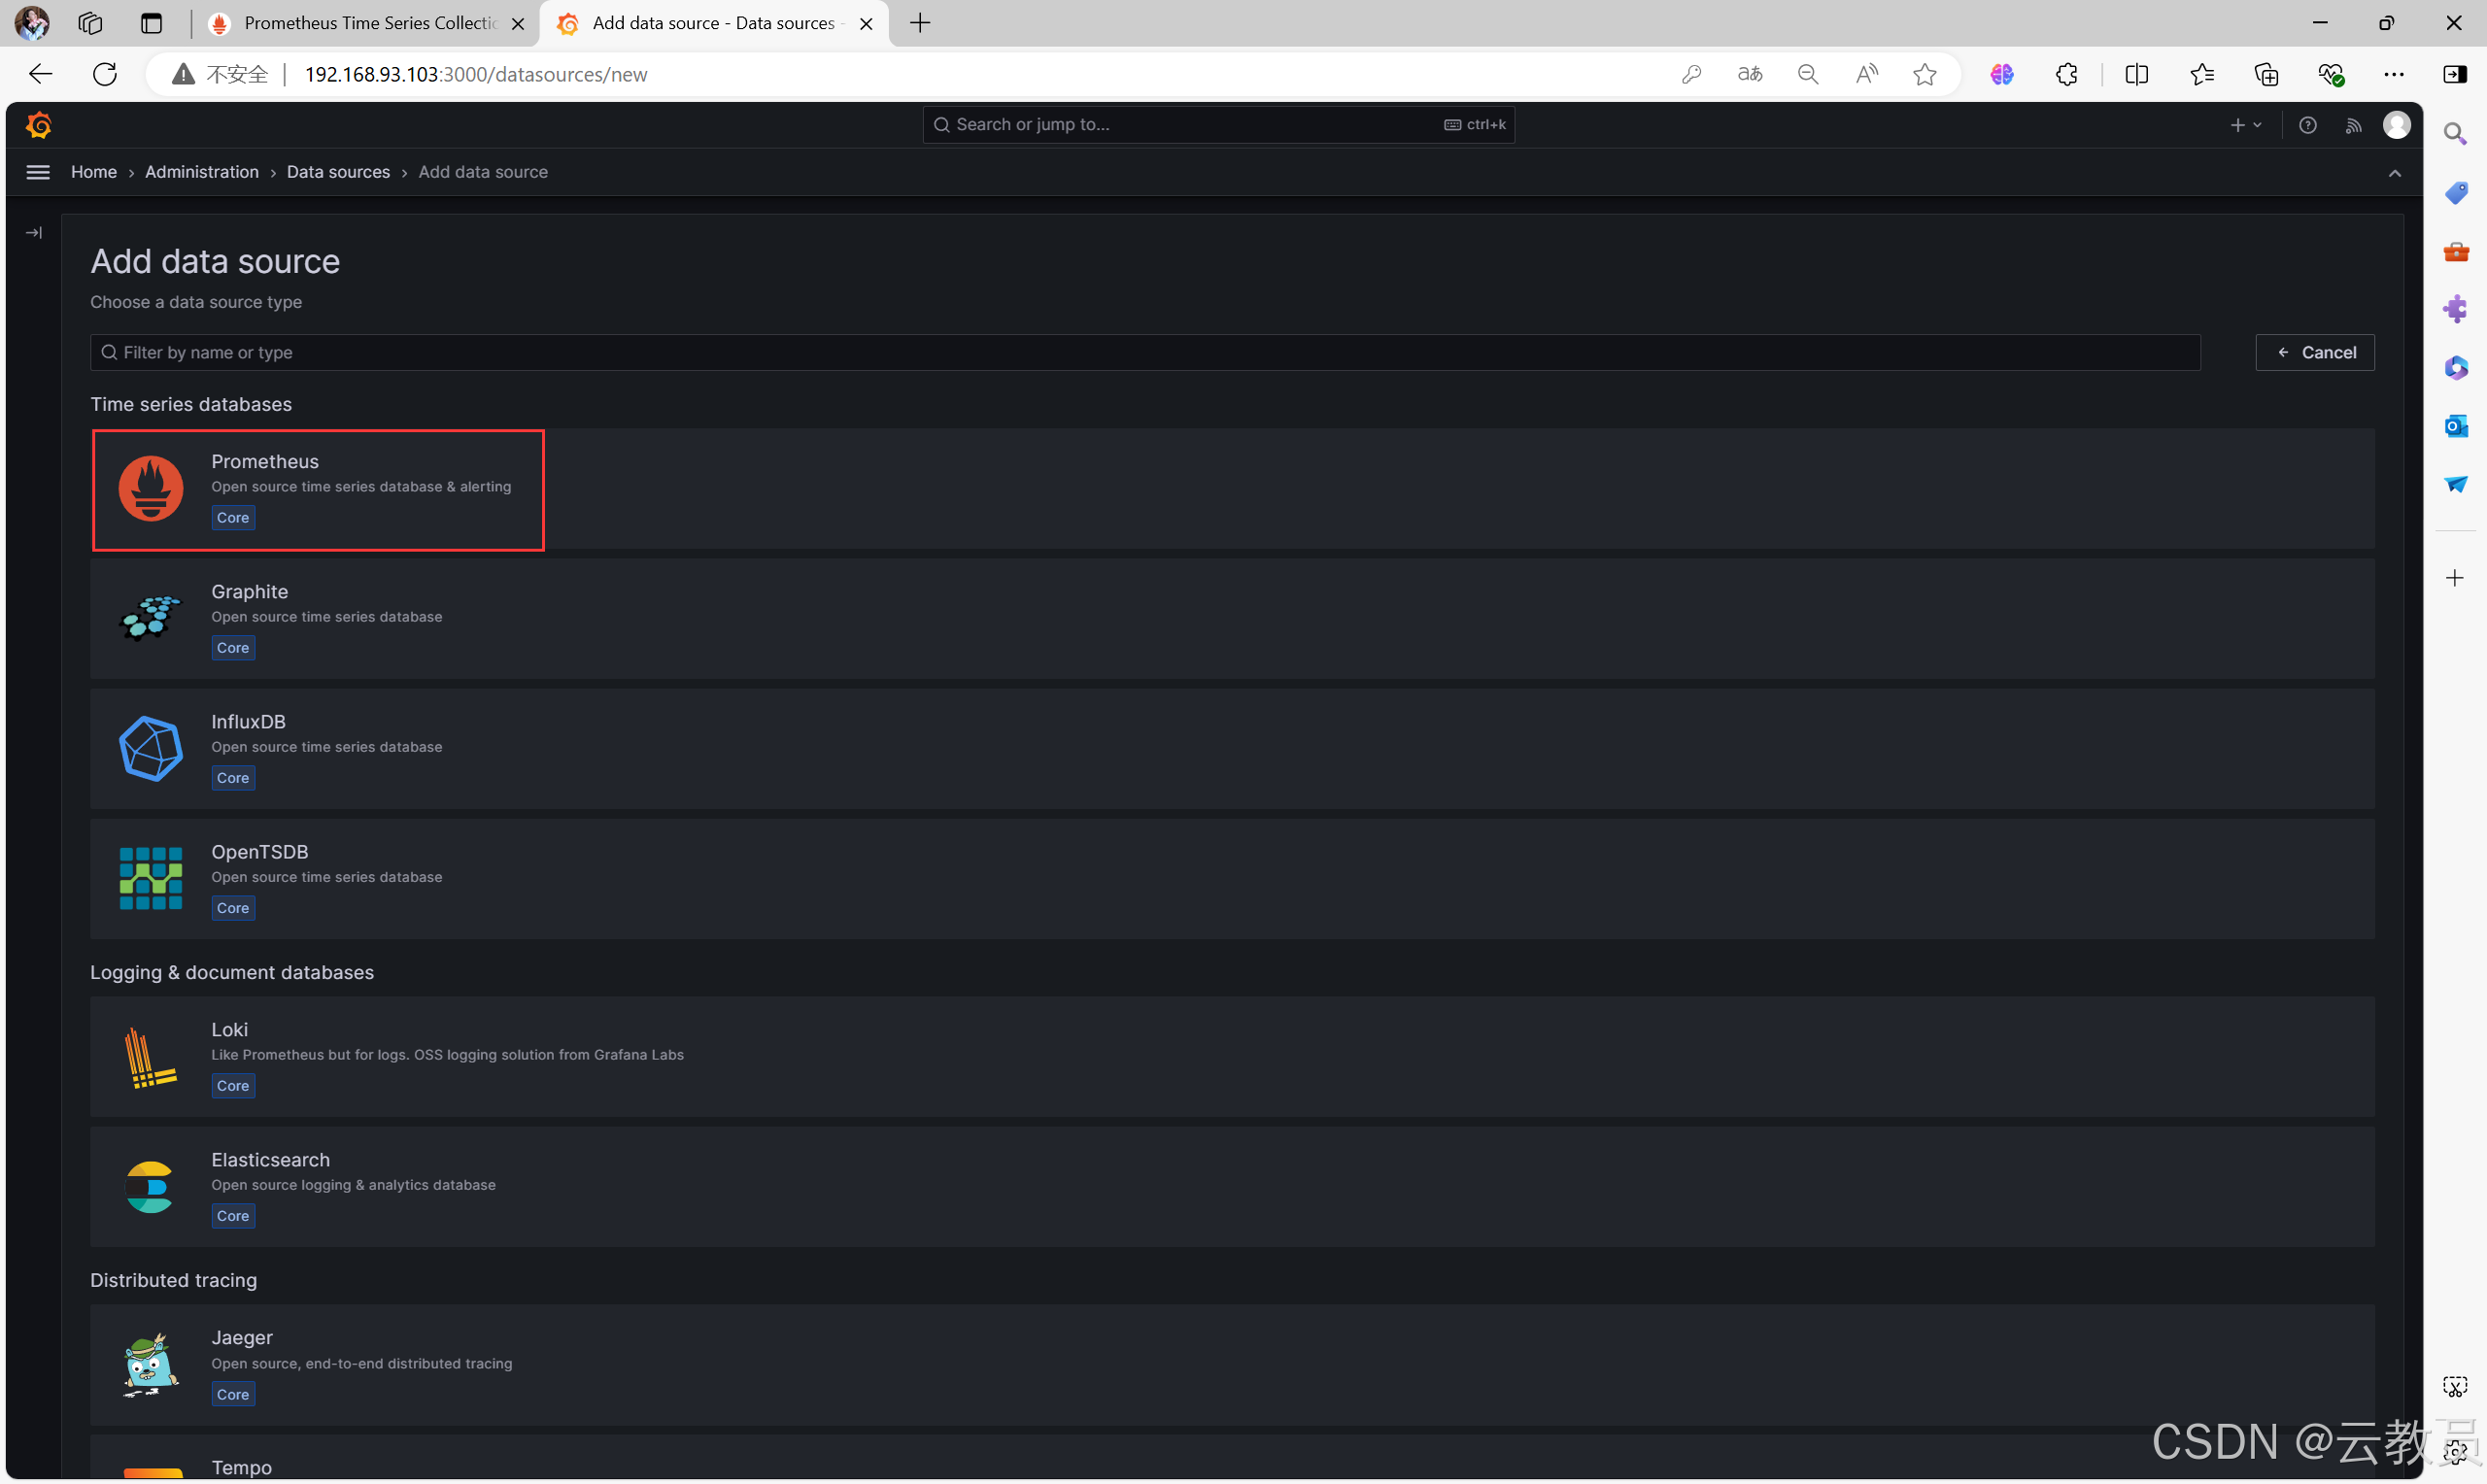
-
填写数据源配置信息
Name:Prometheus-01 # 数据库名称,可随意填写,建议取名有见名知意
Prometheus server URL:http://192.168.93.101:9090 # Prometheus服务端的IP和默认端口
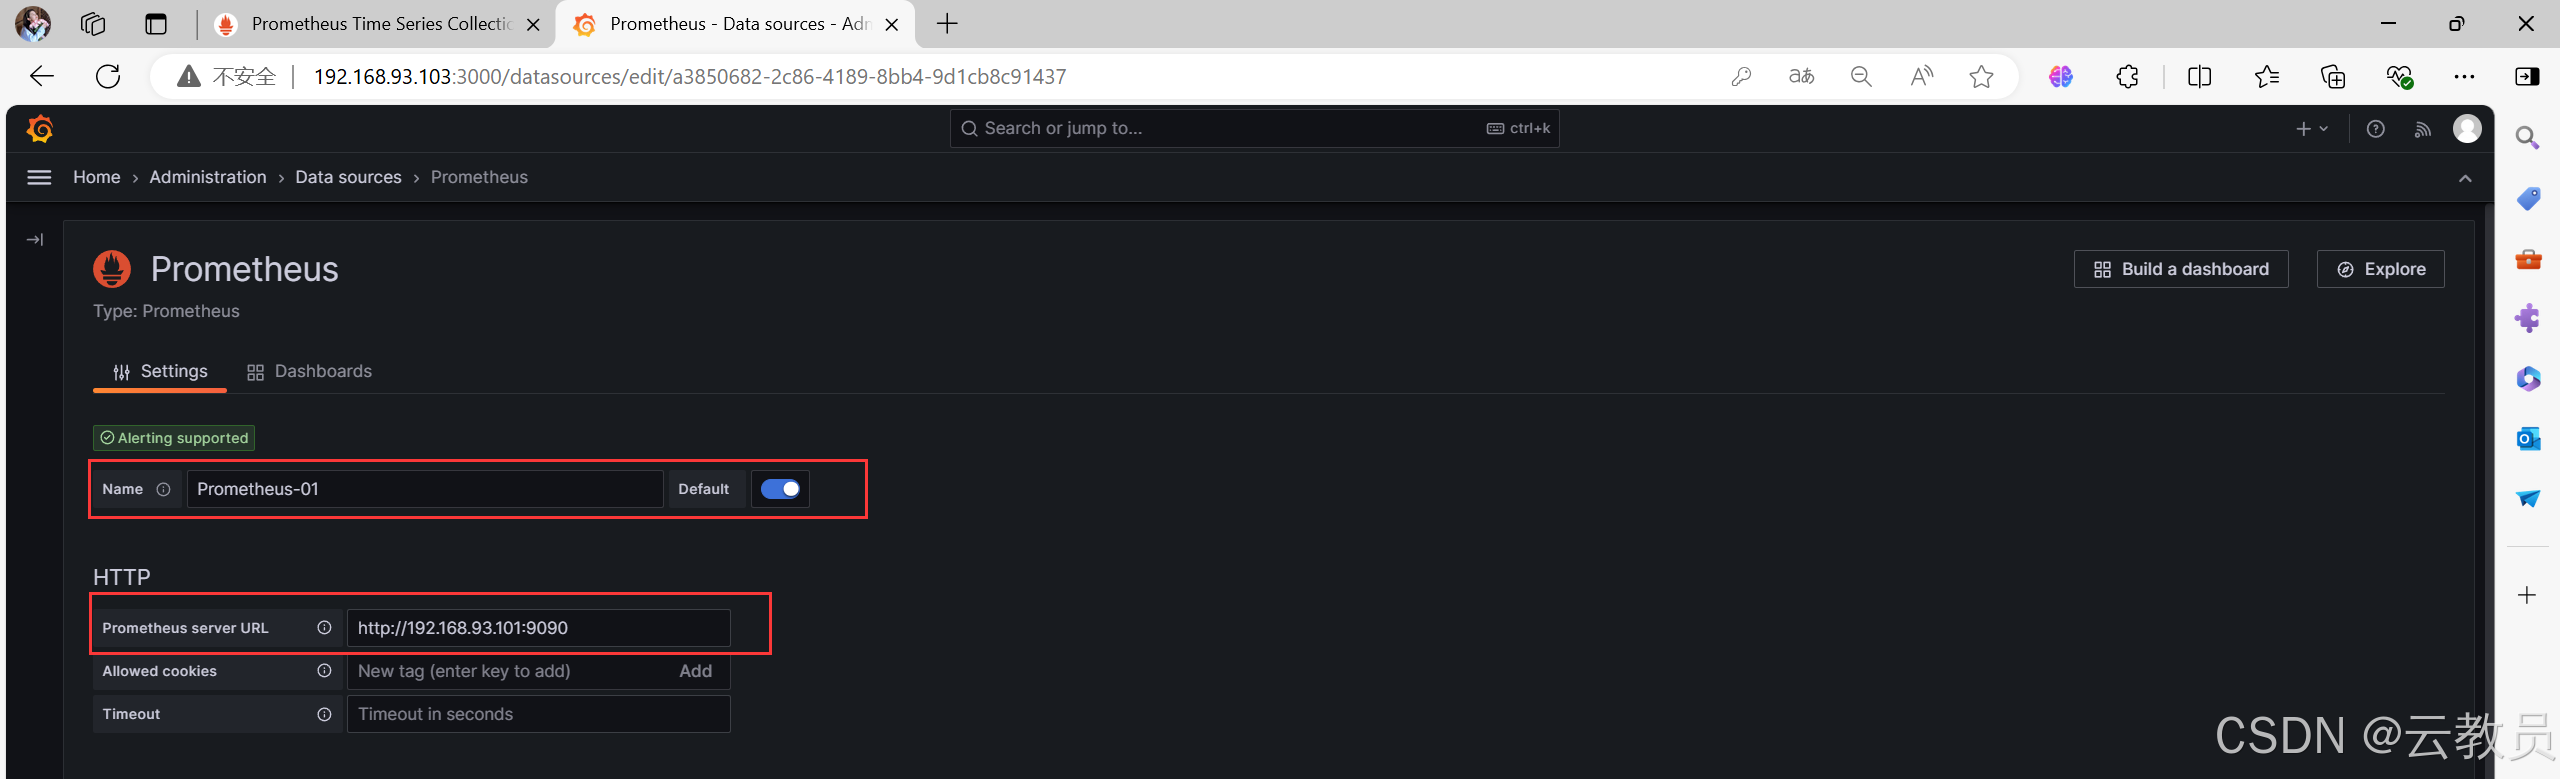
- 往下拉点击
save&test

5.5、新建仪表盘
- 依次点击
home坐标的三个横杠>Dashboards>Now>New Dashboards>Add visualization

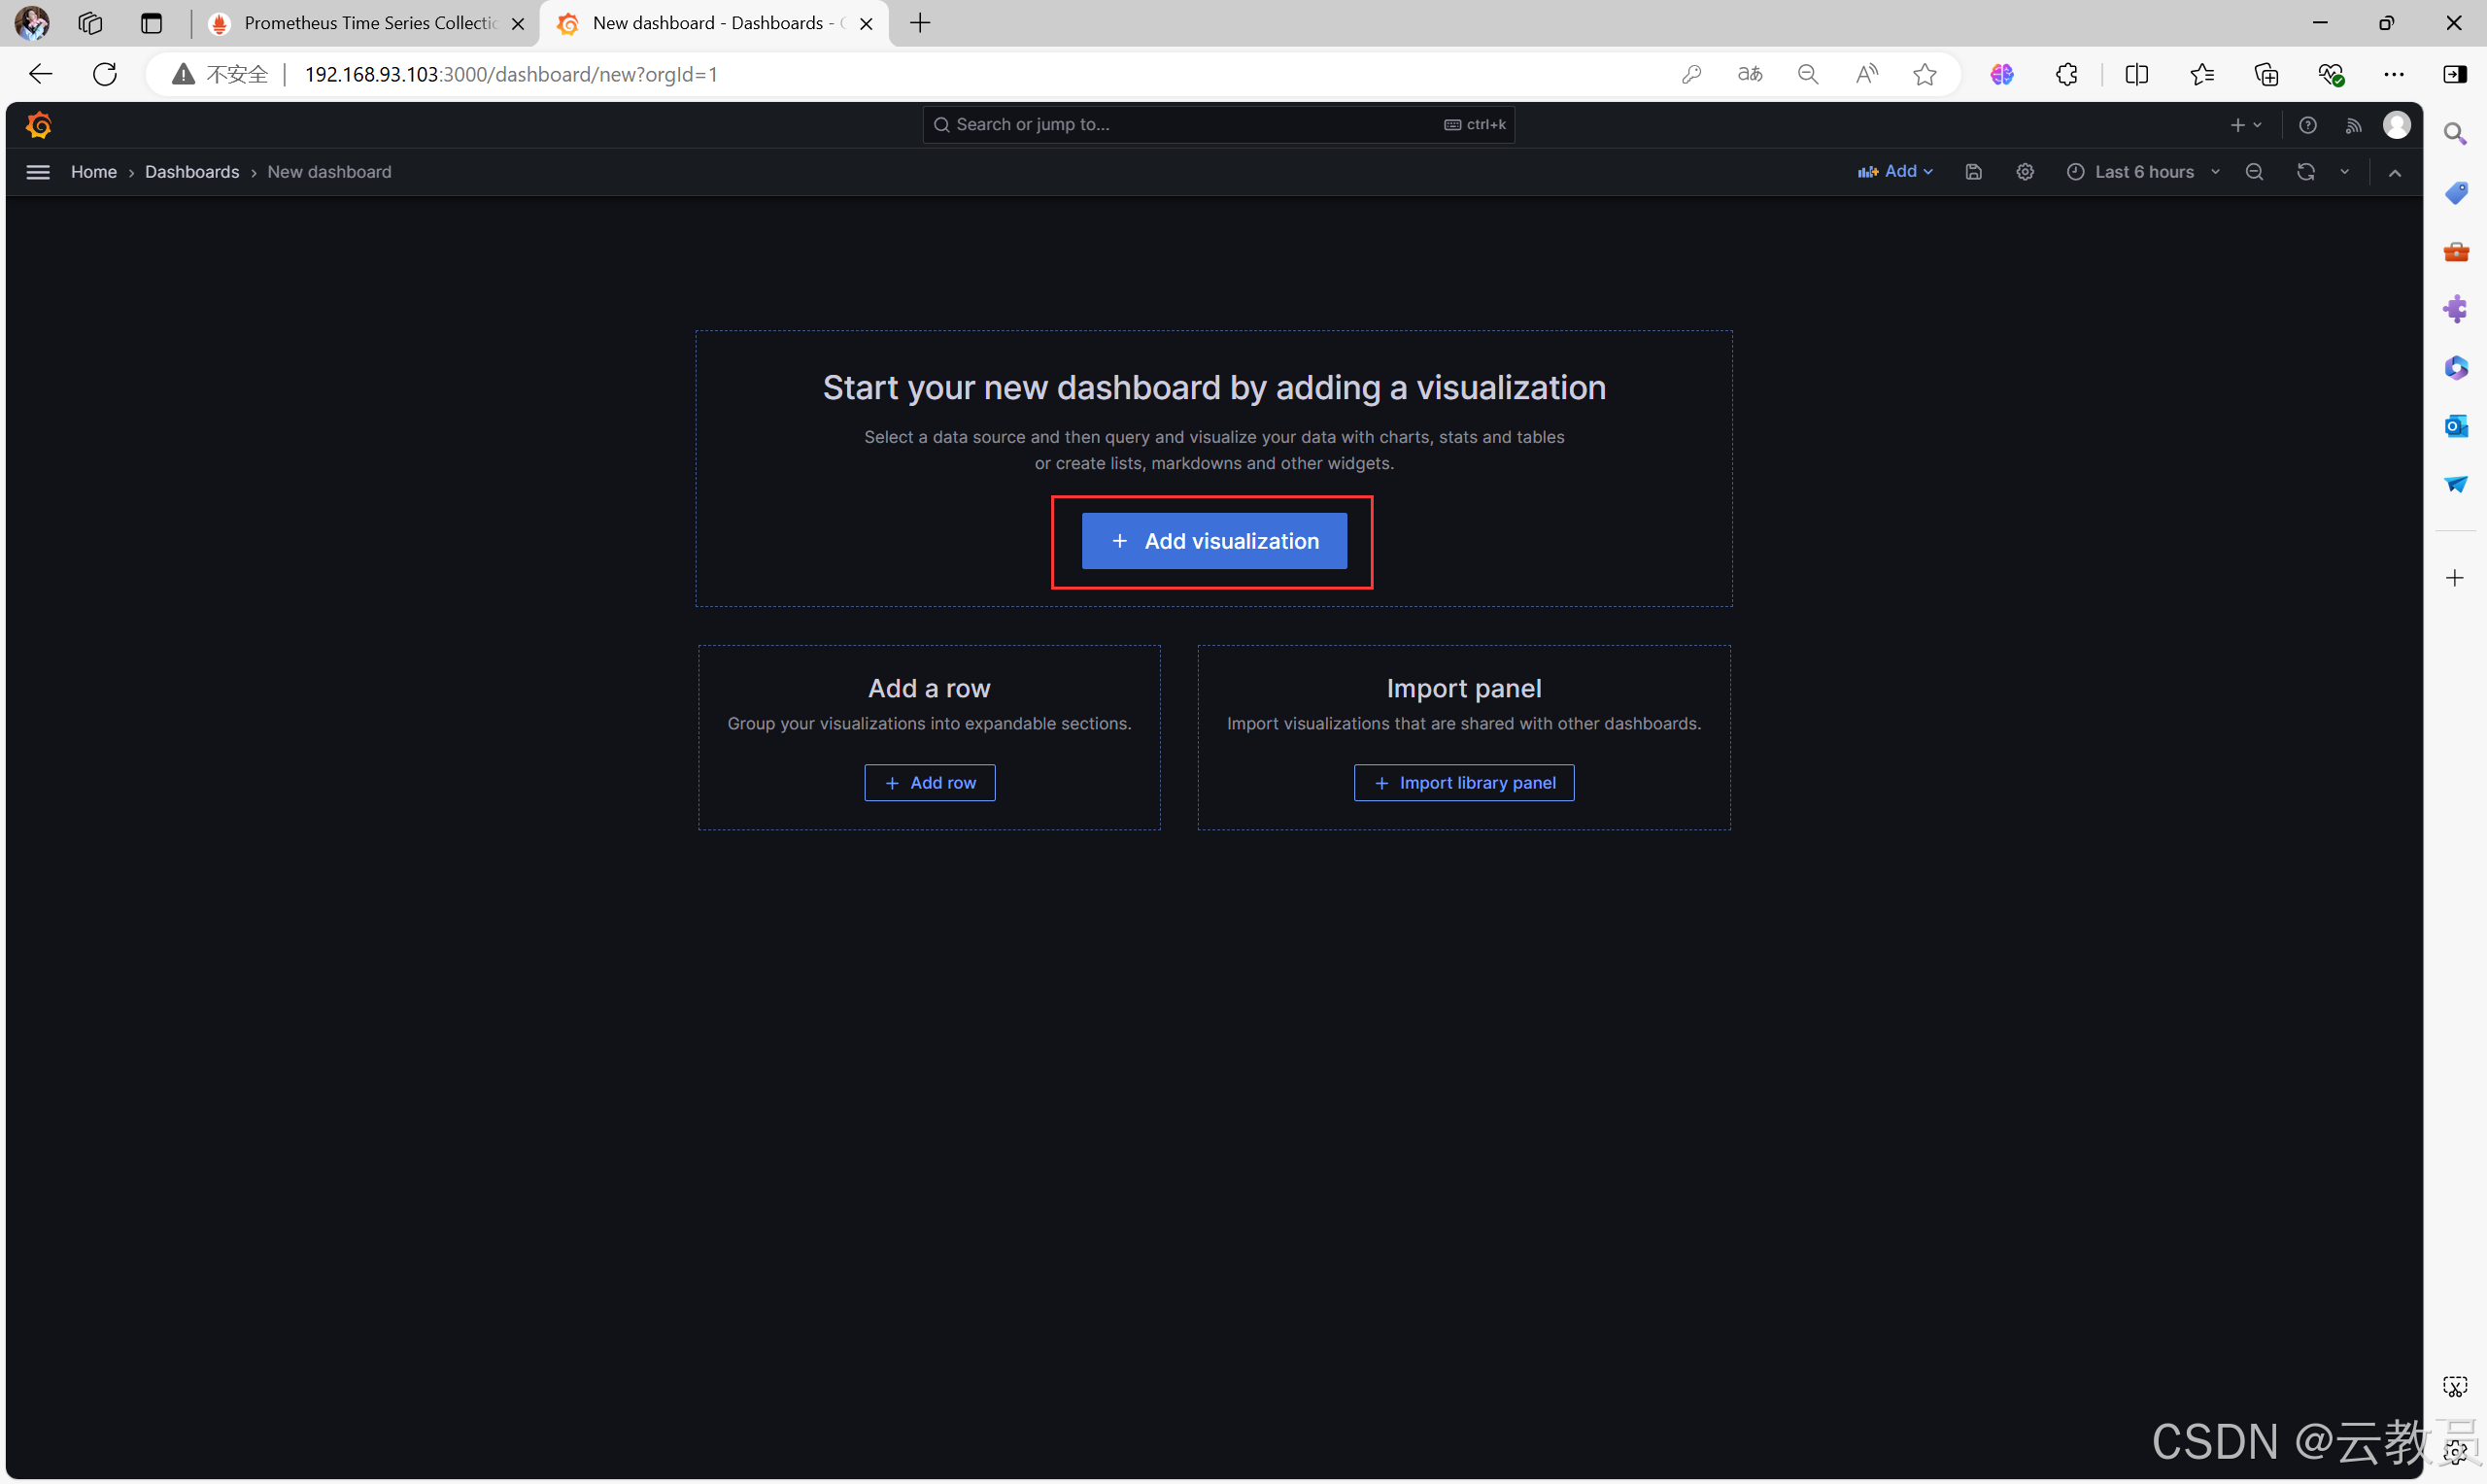
- 选择刚刚配置的数据源

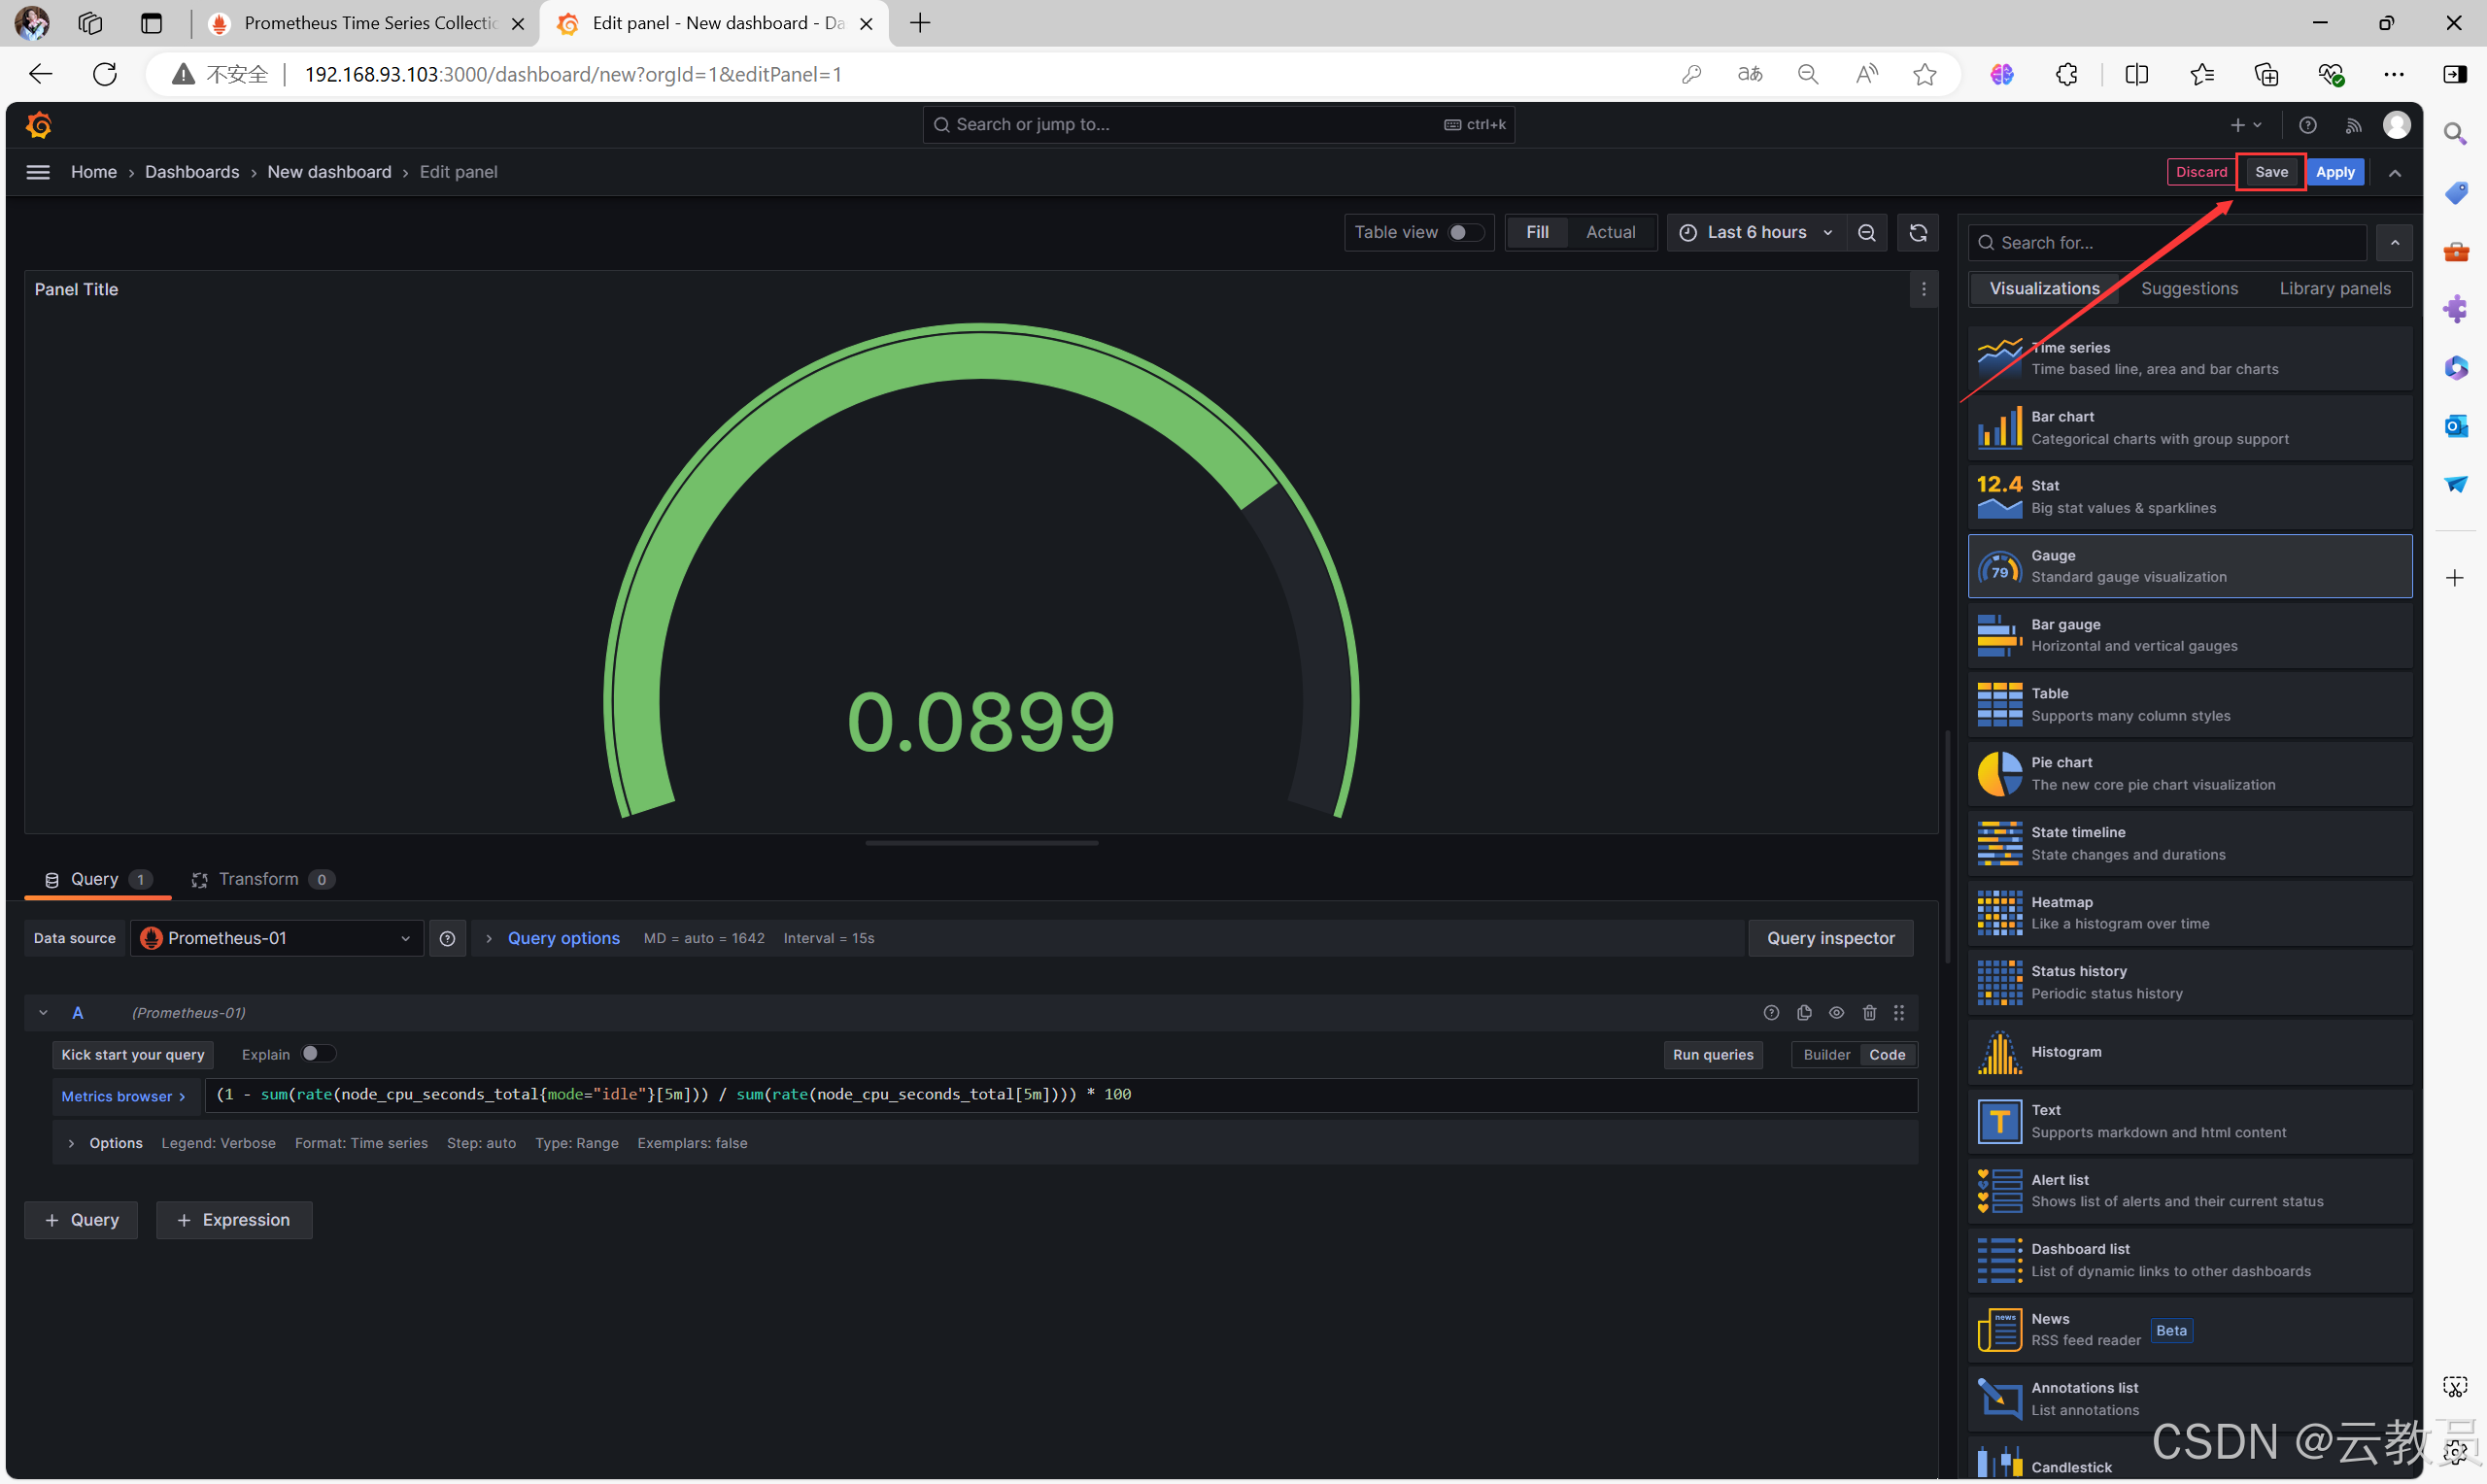
六、创建一个数据展示图
- 使用PromeSQL语言进行测试
6.1、测试代码
- 第一步,测试代码,就是计算一个
cpu使用率的PromeSQL代码,测试没有问题之后,就复制展示这个SQL代码内容
bash
(1 - sum(rate(node_cpu_seconds_total{mode="idle"}[5m])) / sum(rate(node_cpu_seconds_total[5m]))) * 100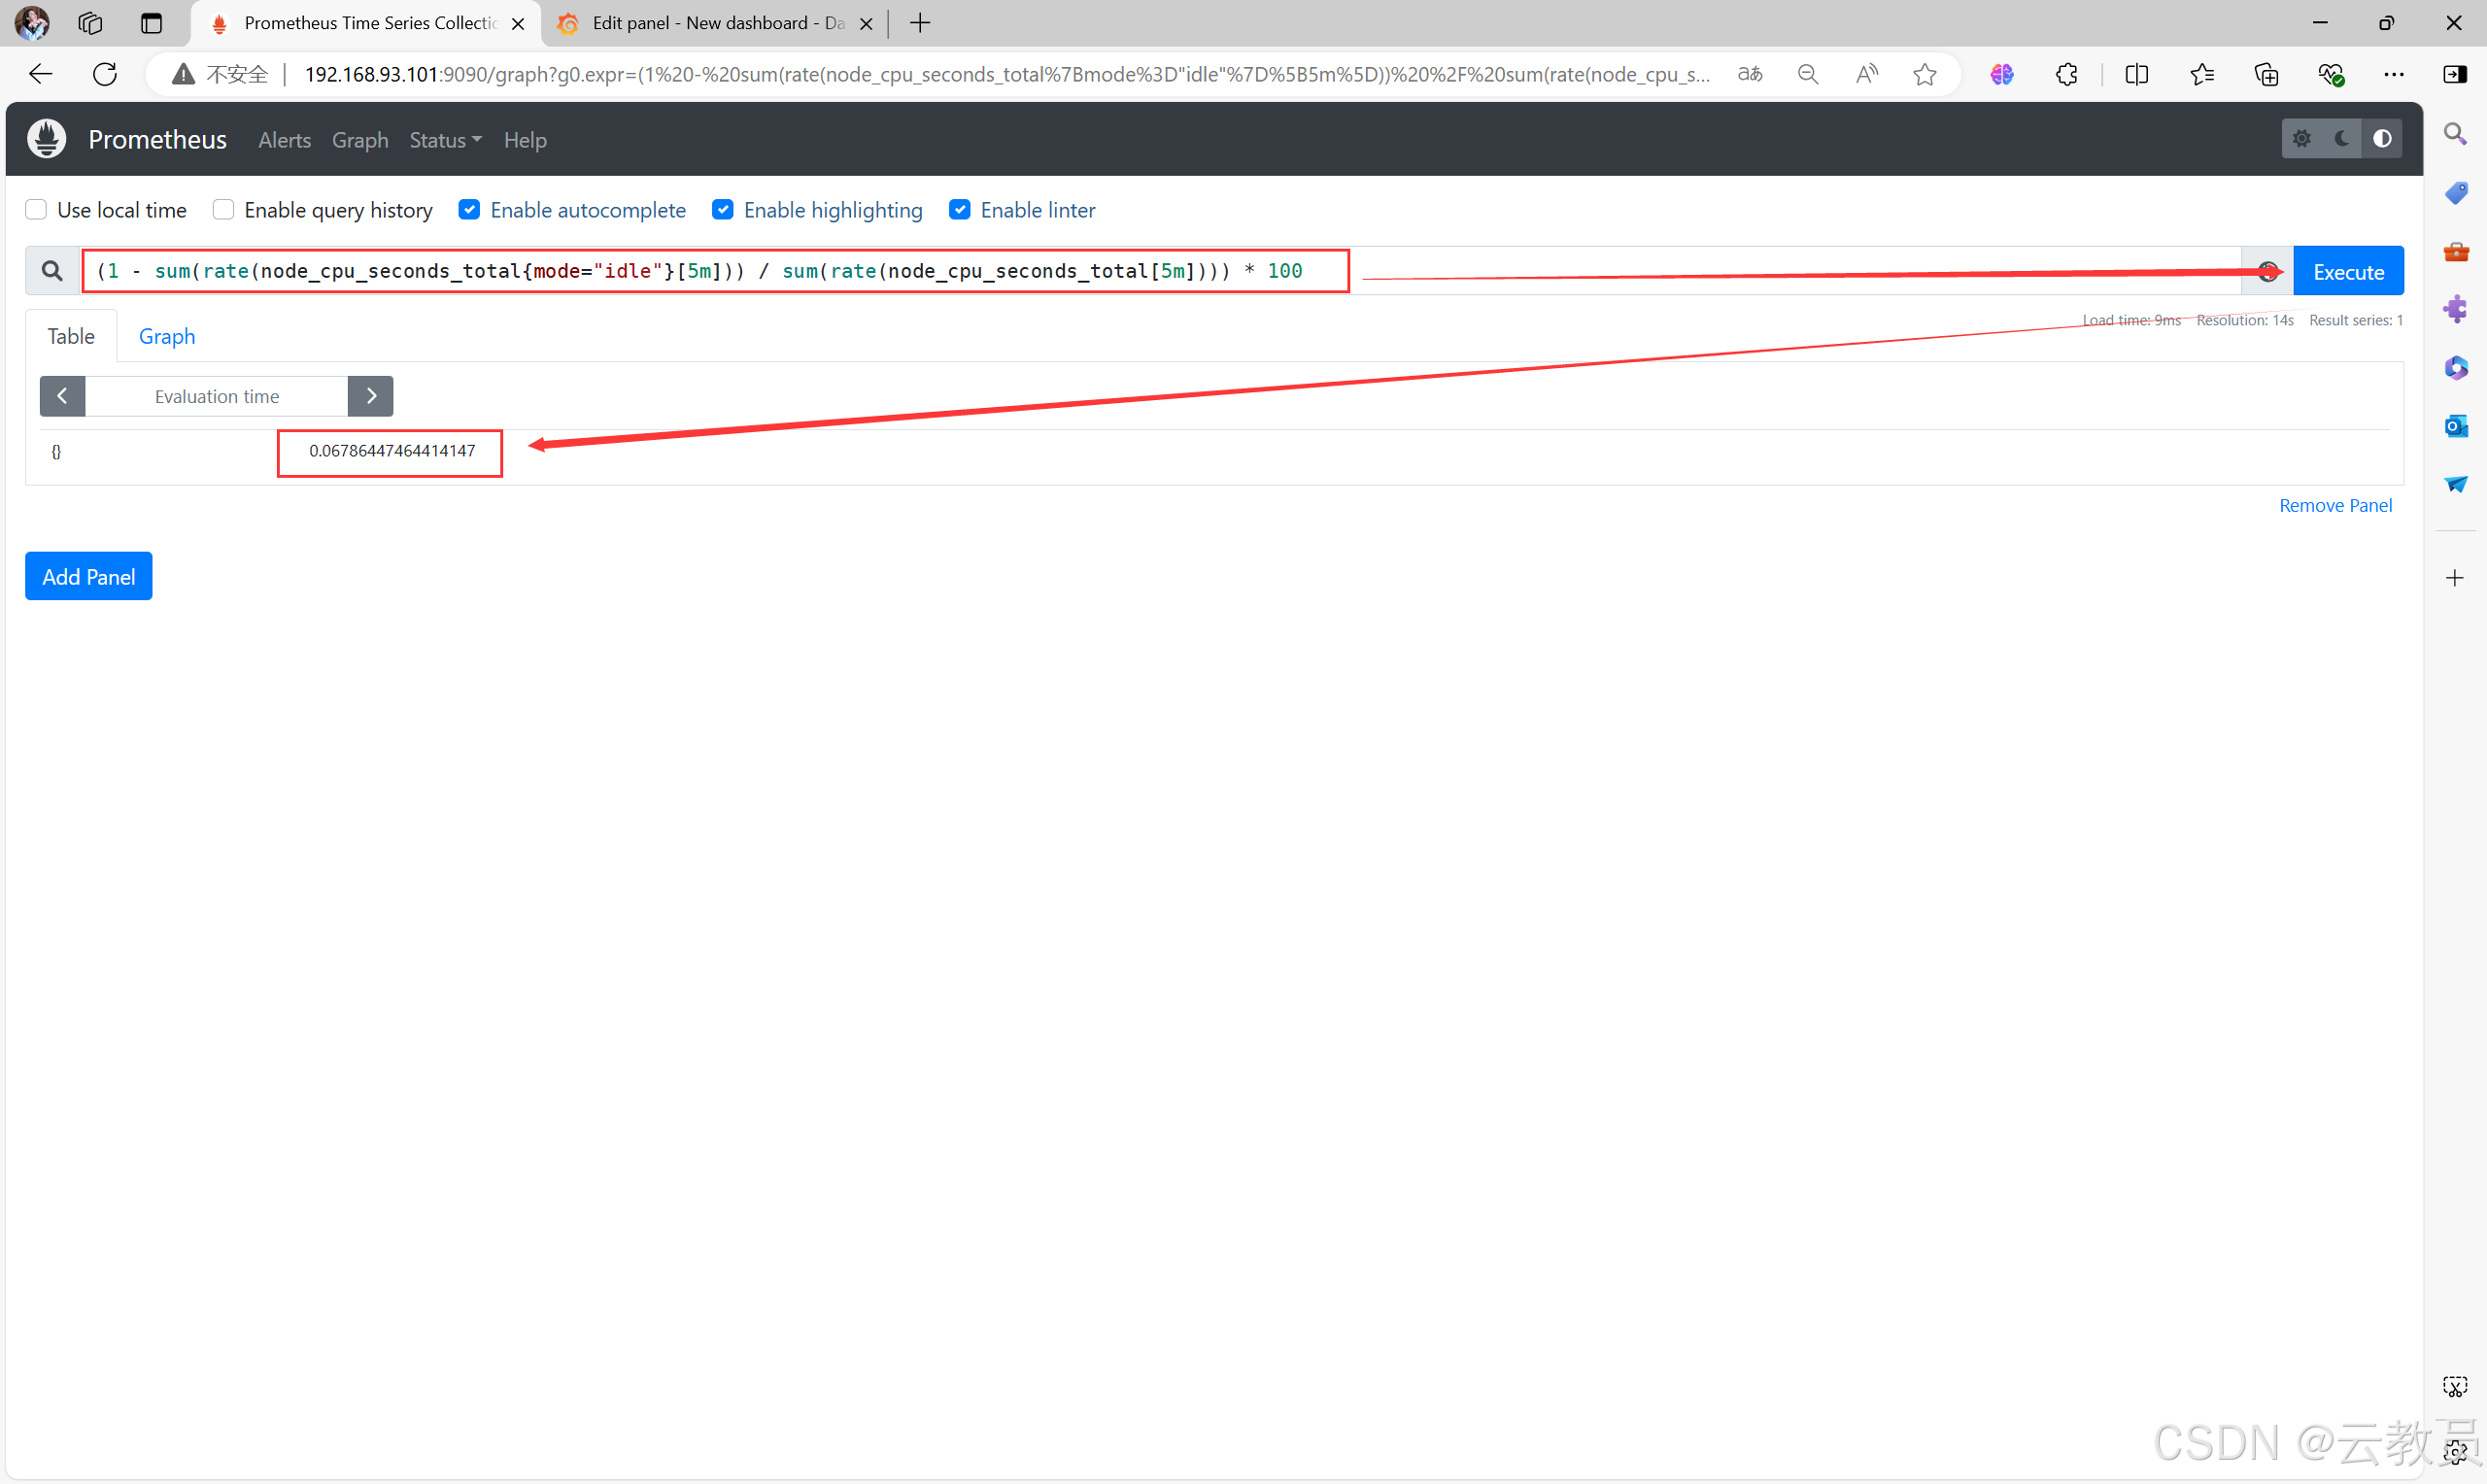
6.2、写入Grafana图形
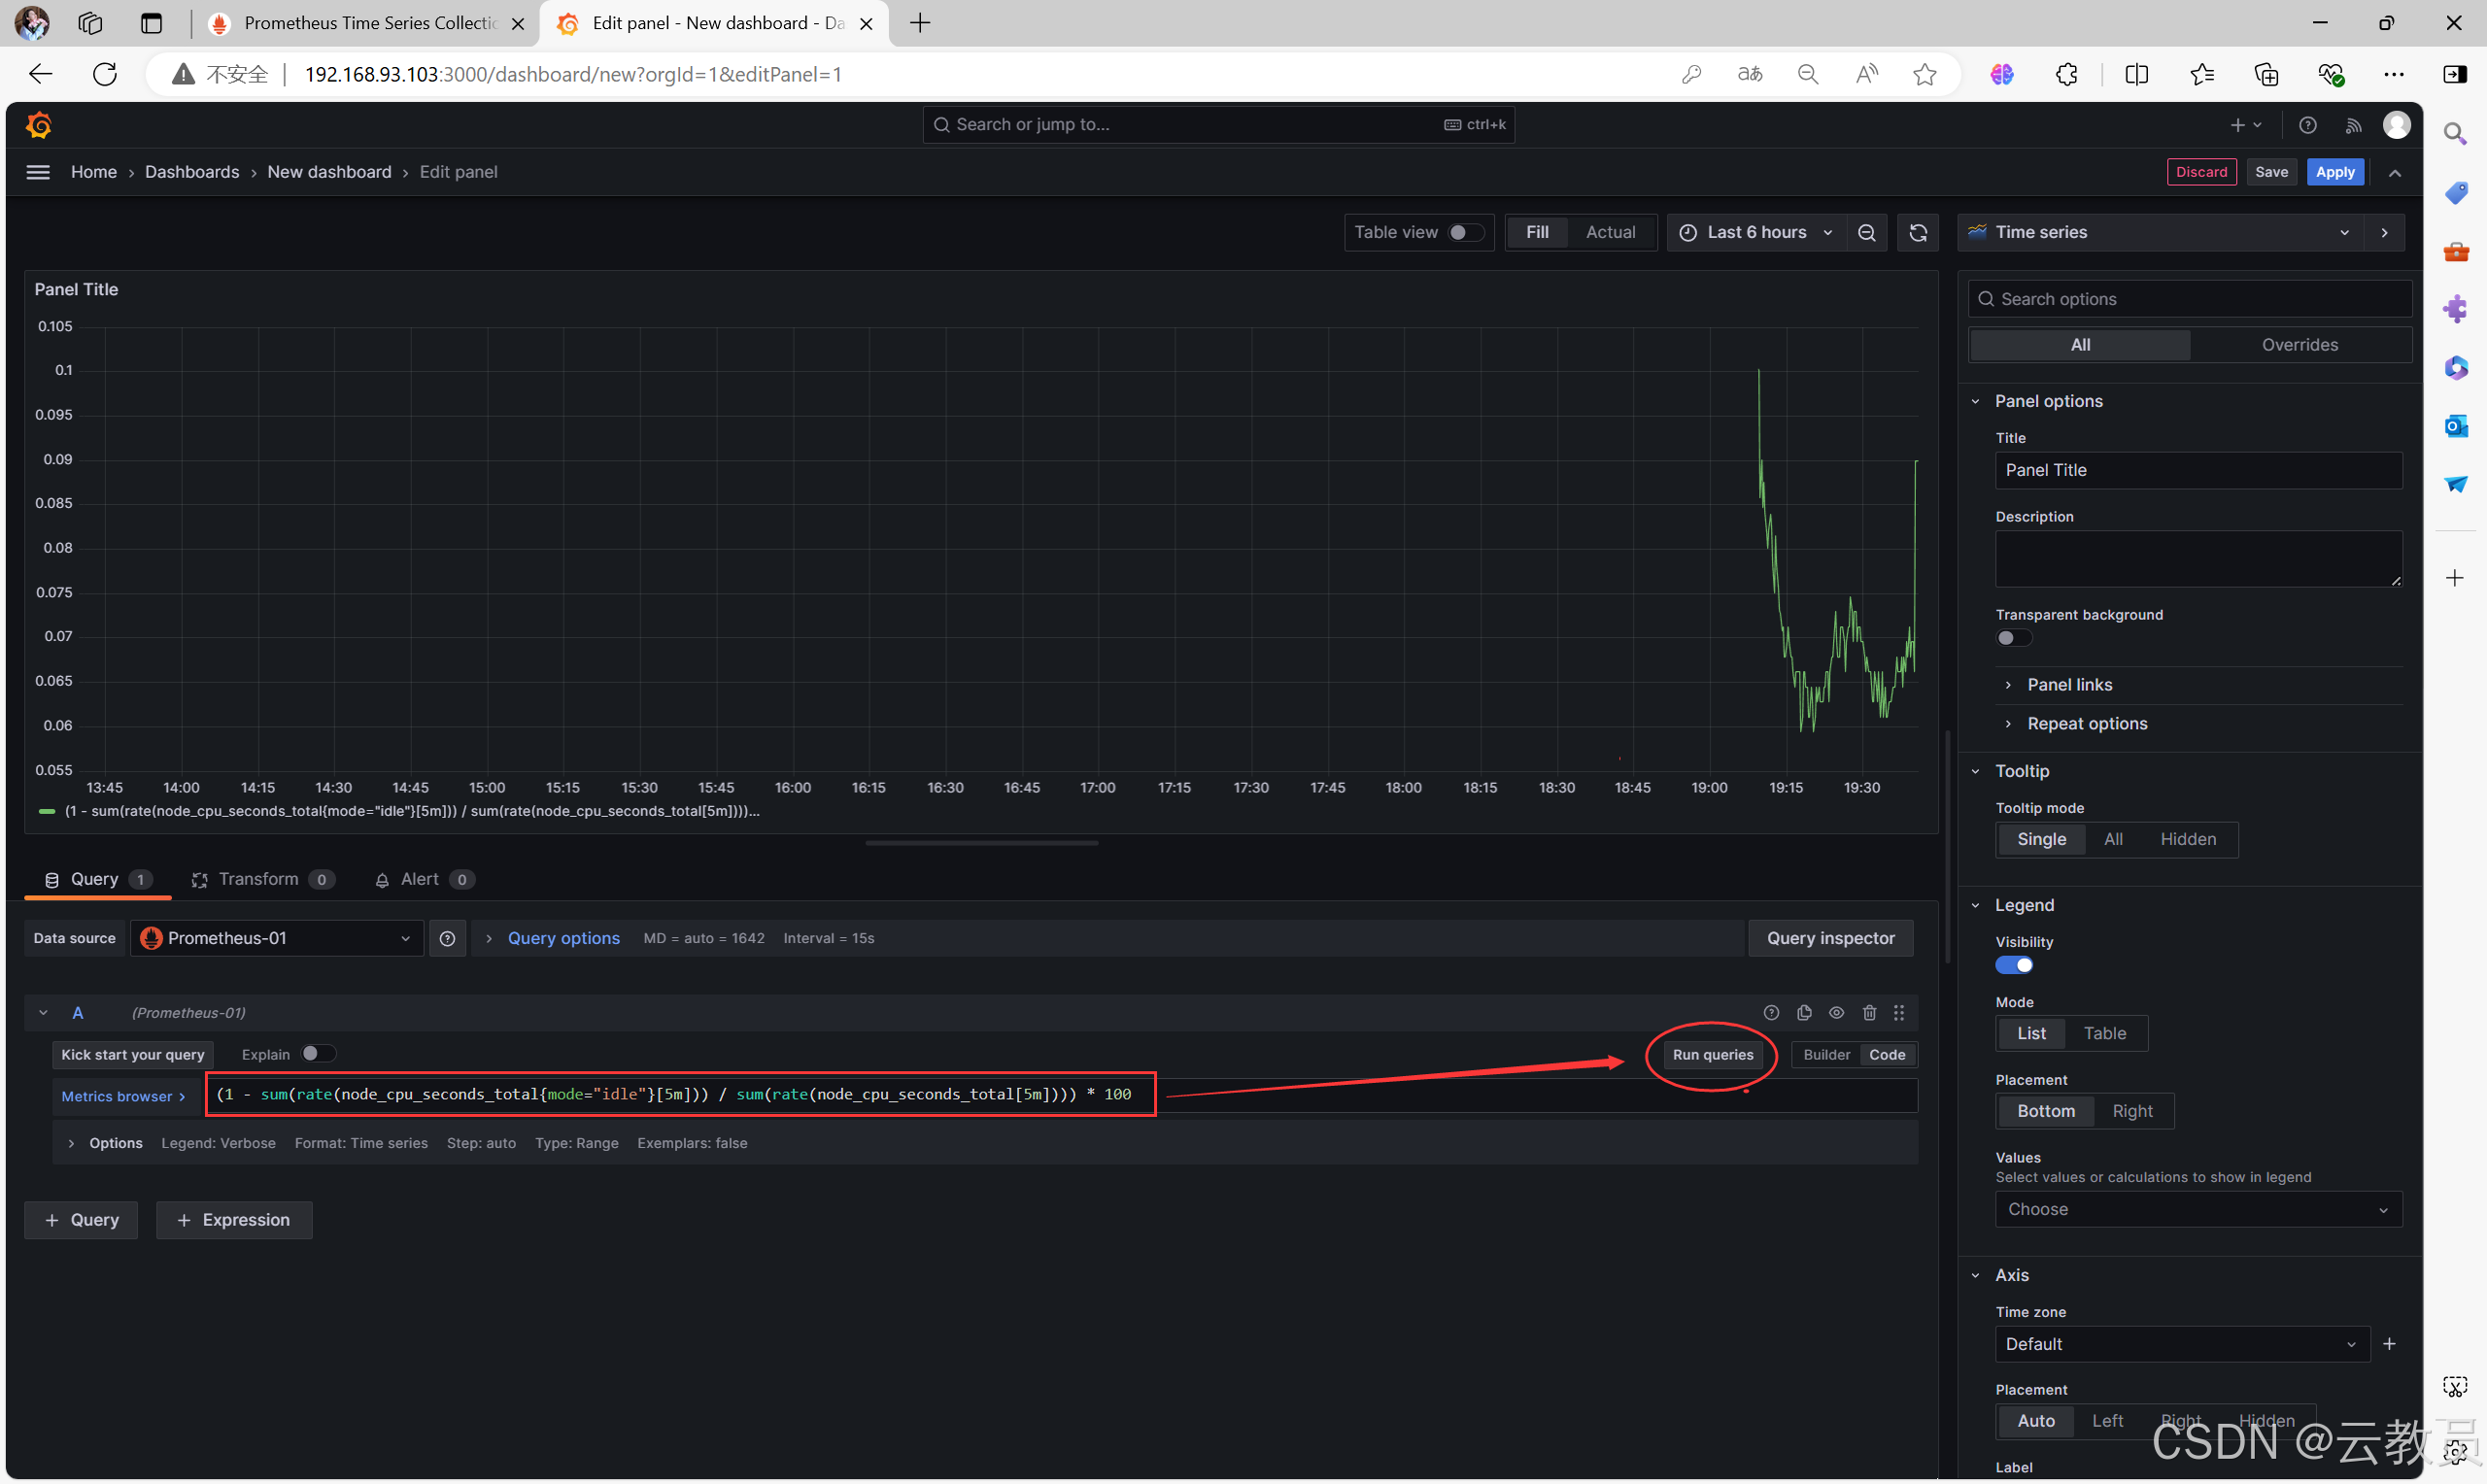
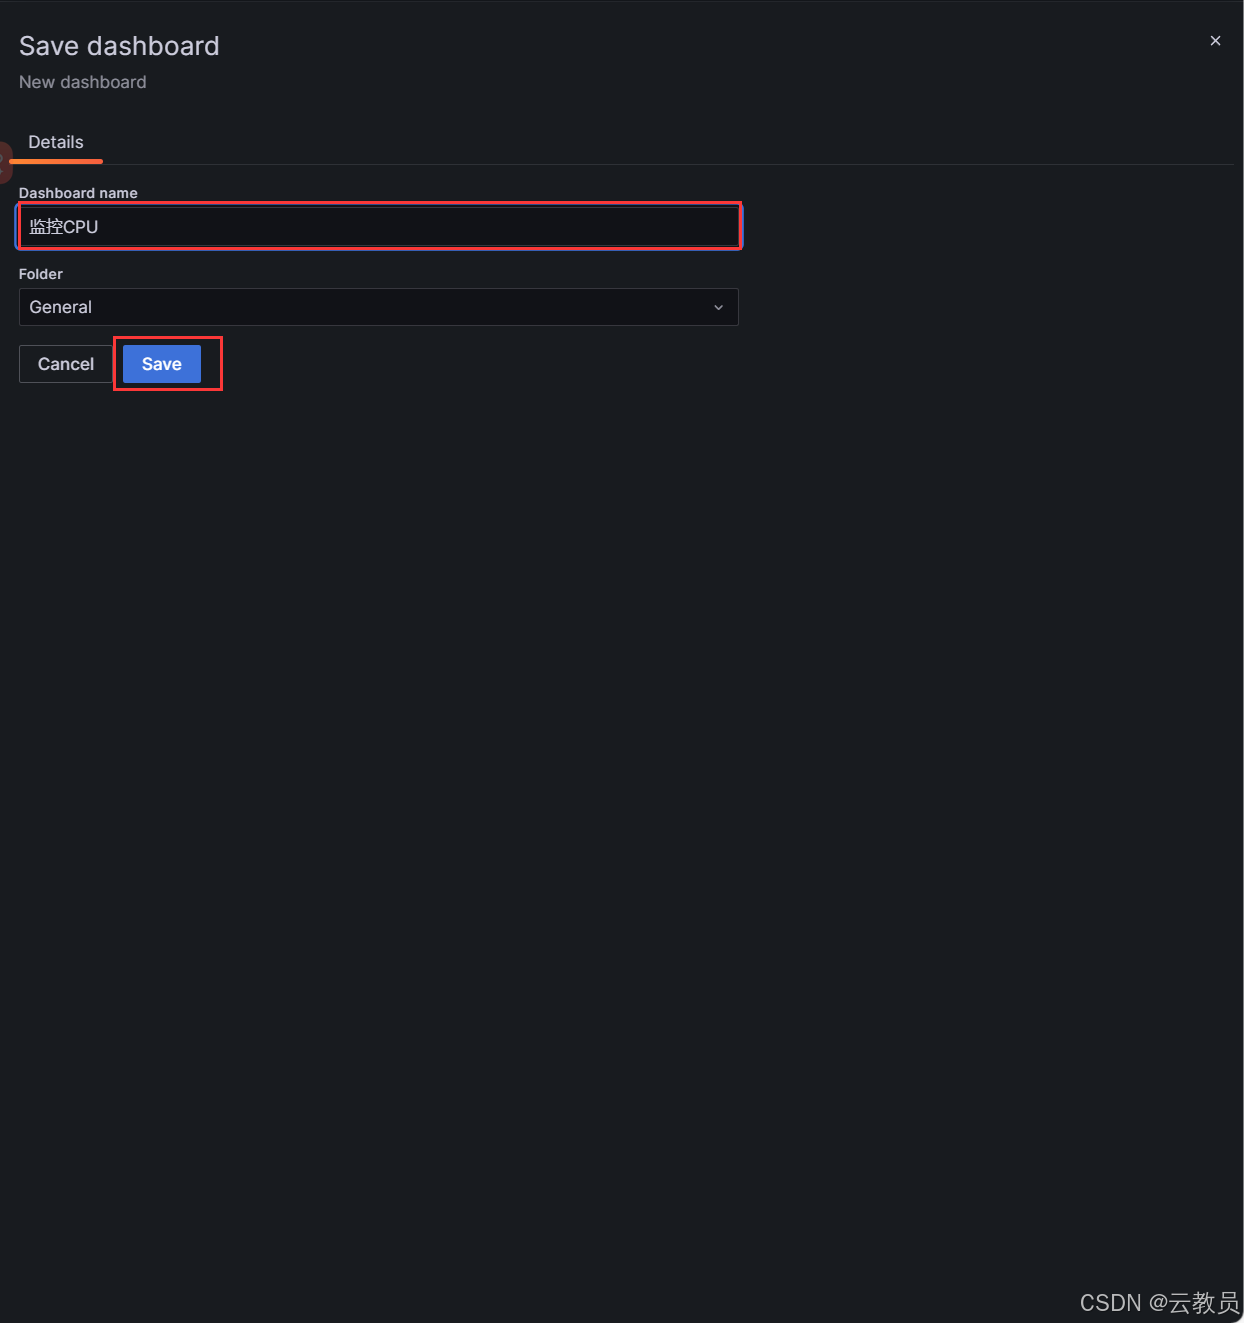
6.3、更改可视化监控页面


6.4、保存仪表盘