文章目录
-
- 任务一:蛋白质消费结构分析
- [任务二 车辆驾驶行为](#任务二 车辆驾驶行为)
项目五:聚类分析
实践目的
- 熟悉模型性能评估的方法;
- 熟悉并掌握 k-means 算法进行聚类分析的方法;
- 理解聚类分析算法并能使用 k-means 算法分析数据集。
实践平台
- 操作系统:Windows 7 及以上
- Python 版本:3.8.x 及以上
- 开发环境:PyCharm 或 Anaconda 集成环境
实践内容
任务一:蛋白质消费结构分析
数据集文件名为"protein.txt",主要记录了25个国家的9个属性:
- ID:国家的 ID;
- Country(国家类别):该数据集涉及25个欧洲国家肉类和其他食品之间的关系;
- 关于肉类和其他食品的9个数据包括:
- RedMeat(红肉)
- WhiteMeat(白肉)
- Eggs(蛋类)
- Milk(牛奶)
- Fish(鱼类)
- Cereals(谷类)
- Starch(淀粉类)
- Nuts(坚果类)
- Fr&Veg(水果和蔬菜)
本项目实践所涉及的业务为不同国家蛋白质消费结构分析,主要从数据集中选取不同国家蛋白质食品的消费数据,在此基础上通过k-means算法模型对其进行迭代求解的聚类分析,最后评价聚类效果的优度。
步骤
-
数据读入
- 导入本案例所需的Python包;
- 使用pandas包中的read_table()方法将数据读入并存为DataFrame格式,查看前5行数据。
-
数据理解
- 通过describe()、info()方法和shape属性对读入的数据对象进行探索性分析;
- 查看数据集中是否存在缺失值、重复值和异常值;
-
数据准备
- 去除数据集中无关列"Country",提取有用数据;
- 为了排除数值的量纲对结果的影响,对数据集进行以均值为中心的标准化处理(Z-Score标准化);
-
模型建立及优化
-
使用k-means算法实现
- 使用KMeans()建立模型,设置KMeans()的聚集次数n_clusters参数为5;
- 使用模型对数据集进行聚类,并输出聚类结果;
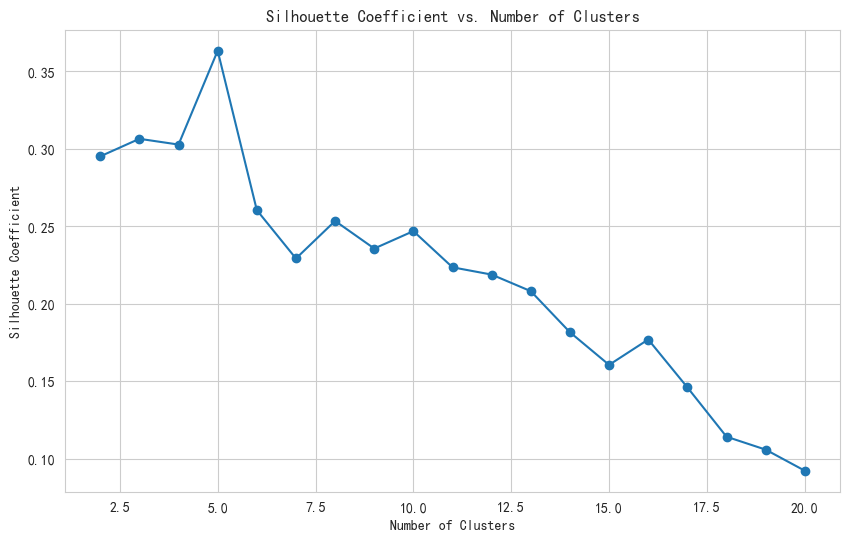
- 使用轮廓系数对模型进行评价,设置聚集次数在2-20之间,其他参数自行设置或保持默认,输出聚集次数在2-20之间的每次的轮廓系数,并以聚集次数为横坐标,轮廓系数为纵坐标,使用pyplot()绘制可视化图形;
- 轮廓系数越大,聚类效果越好。找出范围内最优的聚集次数,重新建立模型;
- 使用优化后的模型对数据集进行聚类,输出聚类结果。
-
使用高斯混合聚类算法实现
- 使用GaussianMixture()建立模型,设置混合高斯模型的个数n_components;
- 使用模型对数据集进行聚类,并输出聚类结果;
-
使用DBSCAN密度聚类算法实现
- 使用DBSCAN()建立模型,设置半径eps和最小样本数min_samples;
- 使用模型对数据集进行聚类,并输出聚类结果;
-
使用单链接层次聚类算法实现
- 使用AgglomerativeClustering()建立模型,设置聚类簇数n_clusters;
- 使用模型对数据集进行聚类,并输出聚类结果;
-
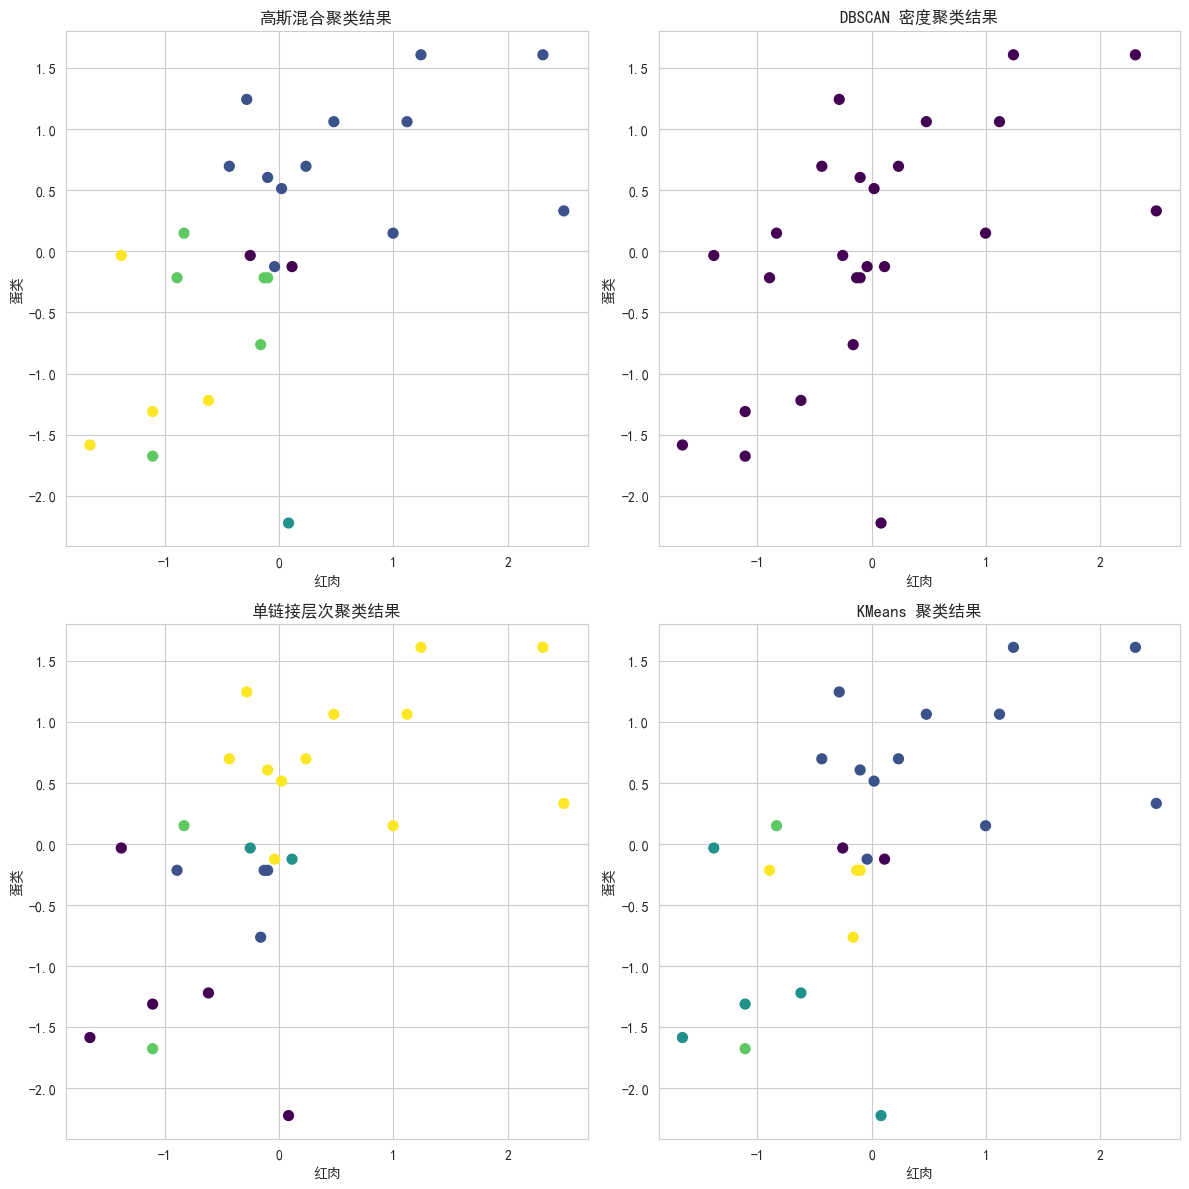
分别绘制以上四种聚类方法对应的聚类结果散点图,并进行对比。
-
任务一:蛋白质消费结构分析
数据预处理
python
# 1. 导入本案例所需的 Python 包
import pandas as pd
import numpy as np
from sklearn.preprocessing import StandardScaler
from sklearn.cluster import KMeans
from sklearn.metrics import silhouette_score
import matplotlib.pyplot as plt
from sklearn.mixture import GaussianMixture
from sklearn.cluster import DBSCAN
from sklearn.cluster import AgglomerativeClustering
# 设置显示中文字体
plt.rcParams['font.sans-serif'] = ['SimHei'] # 指定默认字体
# 设置正常显示符号
plt.rcParams['axes.unicode_minus'] = False
import seaborn as sns

# 2. 使用 pandas 包中的 read_table()方法将数据读入并存为 DataFrame 格式,查看前 5 行数据
file_path = "input/protein.txt"

# 读取数据
data = pd.read_table(file_path, encoding='utf-8')

# 查看前 5 行数据
print(data.head(5))
python
# 1. 探索性分析
# 使用 describe() 方法获取数据的统计信息
print("数据统计信息:",data.describe())

# 使用 info() 方法获取数据的基本信息
print("\n数据基本信息:",data.info())

# 使用 shape 属性获取数据的行数和列数
print("\n数据形状 (行数, 列数):",data.shape)

# 2. 检查缺失值、重复值和异常值
# 检查缺失值
print()
print("\n缺失值检查:",data.isnull().sum())

# 检查重复值
print("重复行数:", data.duplicated().sum())

# # 检查异常值
print("\n异常值检查:")
# 计算每个数值列的上下限
numeric_columns = data.select_dtypes(include=[np.number]).columns
Q1 = data[numeric_columns].quantile(0.25)
Q3 = data[numeric_columns].quantile(0.75)
IQR = Q3 - Q1

# 计算异常值范围
lower_bound = Q1 - 1.5 * IQR
upper_bound = Q3 + 1.5 * IQR

# 检查是否有超出范围的值
outliers = ((data[numeric_columns] < lower_bound) | (data[numeric_columns] > upper_bound)).sum()
print(outliers)
python
# (三)数据准备
# 去除无关列 "Country"
data = data.drop(columns=['Country'])
# 2.为了排除数值的量纲对结果的影响,对数据集进行以均值为中心的标准化处理(Z-Score 标准化);
scaler = StandardScaler()
data[numeric_columns] = scaler.fit_transform(data[numeric_columns])

# 查看标准化后的数据前5行
print("\n标准化后数据前5行:")
print(data.head())
(四)模型建立及优化
KMeans
python
# 使用 k-means 算法实现
# (1) 使用 KMeans()建立模型,设置 n_clusters 期望的簇的数量 参数为 5
kmeans_model = KMeans(n_clusters=5, random_state=42)
kmeans_model.fit(data)

# (2) 使用模型对数据集进行聚类,并输出聚类结果
cluster_labels = kmeans_model.labels_
data['Cluster'] = cluster_labels
print("\n聚类结果:",data.head())

# (3) 使用轮廓系数对模型进行评价
silhouette_scores = []
for n_clusters in range(2, 21):
    kmeans = KMeans(n_clusters=n_clusters, random_state=42)
    cluster_labels = kmeans.fit_predict(data)
    score = silhouette_score(data, cluster_labels)
    silhouette_scores.append(score)

# 绘制轮廓系数图
plt.figure(figsize=(10, 6))
plt.plot(range(2, 21), silhouette_scores, marker='o')
plt.title('Silhouette Coefficient vs. Number of Clusters')
plt.xlabel('Number of Clusters')
plt.ylabel('Silhouette Coefficient')
plt.grid(True)
plt.show()

# (4) 找出最优的聚集次数
optimal_n_clusters = silhouette_scores.index(max(silhouette_scores)) + 2
print(f"\n最优的聚集次数为:{optimal_n_clusters}")

"""这一行代码中加上 2 是因为轮廓系数是在 range(2, 21) 的范围内计算的。
具体来说:
轮廓系数计算范围:
我们计算了从 2 到 20 的聚类数(即 range(2, 21))的轮廓系数。
索引位置:
silhouette_scores 列表中的索引是从 0 开始的,对应于聚类数从 2 开始。"""

# (5) 使用优化后的模型对数据集进行聚类
optimal_kmeans_model = KMeans(n_clusters=optimal_n_clusters, random_state=42)
optimal_kmeans_model.fit(data)

optimal_cluster_labels = optimal_kmeans_model.labels_
data['Optimal_Cluster'] = optimal_cluster_labels

# 输出优化后的聚类结果
print("\n优化后的聚类结果:",data.head())
最优的聚集次数为:5
python
# 使用高斯混合聚类算法实现
# (1) 使用 GaussianMixture() 建立模型,设置 n_components 期望的高斯分布(簇)的数量
gm_model = GaussianMixture(n_components=5, random_state=42)
gm_model.fit(data)

# (2) 使用模型对数据集进行聚类
gm_cluster_labels = gm_model.predict(data)
data['GM_Cluster'] = gm_cluster_labels
print("\n高斯混合聚类结果:",data.head())
python
# 使用 DBSCAN 密度聚类算法实现:
# (1) 使用 DBSCAN() 建立模型,设置 eps  和 min_samples
dbscan_model = DBSCAN(eps=0.5, min_samples=5)
dbscan_model.fit(data)
# (2) 使用模型对数据集进行聚类 输出密度聚类结果
dbscan_cluster_labels = dbscan_model.labels_
data['DBSCAN_Cluster'] = dbscan_cluster_labels
print("\nDBSCAN 密度聚类结果:",data.head())
python
# 使用单链接层次聚类:
# (1) 使用 AgglomerativeClustering() 建立模型,设置 n_clusters 期望的最终簇的数量。
agg_model = AgglomerativeClustering(n_clusters=5, linkage='single')

# (2) 使用模型对数据集进行聚类 输出聚类结
agg_cluster_labels = agg_model.fit_predict(data)
data['Agg_Cluster'] = agg_cluster_labels
print("\n单链接层次聚类结果:",data.head())
python
# 4. 绘制四种聚类方法对应的聚类结果散点图
# 选红肉和蛋类
X = data[['RedMeat', 'Eggs']]

# 绘制四种聚类方法对应的聚类结果散点图
plt.figure(figsize=(12, 12))

# 绘制高斯混合聚类结果
plt.subplot(2, 2, 1)
plt.scatter(X['RedMeat'], X['Eggs'], c=data['GM_Cluster'], cmap='viridis', s=50)
plt.title('高斯混合聚类结果')
plt.xlabel('红肉')
plt.ylabel('蛋类')

# 绘制 DBSCAN 密度聚类结果
plt.subplot(2, 2, 2)
plt.scatter(X['RedMeat'], X['Eggs'], c=data['DBSCAN_Cluster'], cmap='viridis', s=50)
plt.title('DBSCAN 密度聚类结果')
plt.xlabel('红肉')
plt.ylabel('蛋类')

# 绘制单链接层次聚类结果
plt.subplot(2, 2, 3)
plt.scatter(X['RedMeat'], X['Eggs'], c=data['Agg_Cluster'], cmap='viridis', s=50)
plt.title('单链接层次聚类结果')
plt.xlabel('红肉')
plt.ylabel('蛋类')

# 绘制 KMeans 聚类结果
plt.subplot(2, 2, 4)
plt.scatter(X['RedMeat'], X['Eggs'], c=data['Cluster'], cmap='viridis', s=50)
plt.title('KMeans 聚类结果')
plt.xlabel('红肉')
plt.ylabel('蛋类')

plt.tight_layout()
plt.show()
任务二 车辆驾驶行为
python
# (一)数据读入
import pandas as pd
import numpy as np
from sklearn.preprocessing import StandardScaler
from sklearn.cluster import KMeans
from sklearn.mixture import GaussianMixture
from sklearn.cluster import DBSCAN
from sklearn.cluster import AgglomerativeClustering
from sklearn.metrics import silhouette_score
import matplotlib.pyplot as plt
# 设置显示中文字体
plt.rcParams['font.sans-serif'] = ['SimHei'] # 指定默认字体
# 设置正常显示符号
plt.rcParams['axes.unicode_minus'] = False


df = pd.read_csv("input/车辆驾驶行为指标数据.csv",encoding='gbk')
print(df.head())  # 查看前五行数据
python
# 使用 describe() 方法查看数据的统计信息
print("\n数据统计信息:")
print(df.describe())

# 使用 info() 方法查看数据的基本信息,包括每列的数据类型和非空值数量
print("\n数据基本信息:")
print(df.info())

# 使用 shape 属性查看数据的形状(行数和列数)
print("\n数据形状:")
print(df.shape)

# 检查缺失值
print("\n缺失值检查:")
print(df.isnull().sum())

# 检查重复值
print("\n重复值检查:")
print(df.duplicated().sum())

# 处理缺失值 填充缺失值
df.fillna(0, inplace=True)
print("\n处理后数据缺失值情况:")
print(df.isnull().sum())

# 检查异常值(例如通过标准差)
numeric_columns = df.select_dtypes(include=[np.number]).columns
print("\n异常值检查:")
for column in numeric_columns:
    mean = df[column].mean()
    std = df[column].std()
    print(f"{column} 的异常值数量: {df[(df[column] < mean - 3 * std) | (df[column] > mean + 3 * std)].shape[0]}")
# 异常值挺少的,影响不大
python
异常值检查:
行驶里程(km) 的异常值数量: 5
平均速度(km/h) 的异常值数量: 1
速度标准差 的异常值数量: 0
速度差值标准差 的异常值数量: 2
急加速(次) 的异常值数量: 1
急减速(次) 的异常值数量: 1
疲劳驾驶(次) 的异常值数量: 8
熄火滑行(次) 的异常值数量: 4
超长怠速(次) 的异常值数量: 8
急加速频率 的异常值数量: 1
急减速频率 的异常值数量: 1
疲劳驾驶频率 的异常值数量: 1
熄火滑行频率 的异常值数量: 3
超长怠速频率 的异常值数量: 2
python
# 1 去除无关列
df = df.drop(columns=['车辆编码'])
# 2 对数据集进行 Z-Score 标准化
scaler = StandardScaler()
df[numeric_columns] = scaler.fit_transform(df[numeric_columns])
print("\nZ-Score 标准化后数据前五行:")
print(df.head())
(四)模型建立及优化
python
# KMEANS
# 1. 使用 KMeans() 建立模型,设置 n_clusters 参数为 5
kmeans = KMeans(n_clusters=5, random_state=42)
kmeans.fit(df)

# 2. 使用模型对数据集进行聚类,并输出聚类结果
df['cluster'] = kmeans.labels_
print("\n聚类结果:")
print(df)

# 3. 使用轮廓系数对模型进行评价
silhouette_scores = []

for k in range(2, 21):
    kmeans = KMeans(n_clusters=k, random_state=42)
    kmeans.fit(df)
    silhouette_avg = silhouette_score(df, kmeans.labels_)
    silhouette_scores.append(silhouette_avg)
    print(f"n_clusters={k}, 轮廓系数: {silhouette_avg}")

# 4. 绘制轮廓系数可视化图形
plt.figure(figsize=(10, 6))
plt.plot(range(2, 21), silhouette_scores, marker='o')
plt.title('轮廓系数随聚类数变化')
plt.xlabel('聚类数 (n_clusters)')
plt.ylabel('轮廓系数')
plt.grid(True)
plt.show()

# 5. 找出最优的聚集次数
optimal_k = silhouette_scores.index(max(silhouette_scores)) + 2
print(f"\n最优的聚集次数: {optimal_k}")

# 6. 使用优化后的模型对数据集进行聚类
kmeans_optimized = KMeans(n_clusters=optimal_k, random_state=42)
kmeans_optimized.fit(df)
df['cluster_optimized'] = kmeans_optimized.labels_
print("\n优化后的聚类结果:")
print(df)
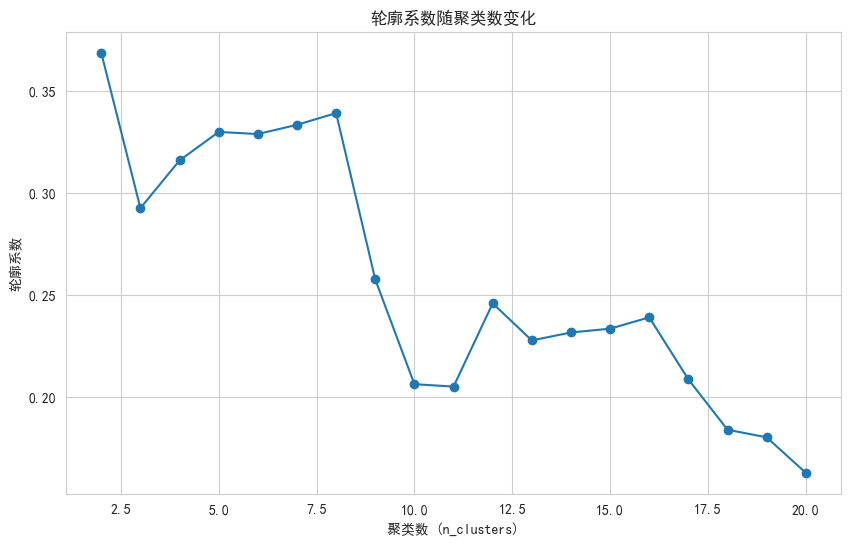
最优的聚集次数: 2
python
n_clusters=2, 轮廓系数: 0.3686521826946977
n_clusters=3, 轮廓系数: 0.29249412558847104
n_clusters=4, 轮廓系数: 0.3158726043508198
n_clusters=5, 轮廓系数: 0.3298708959680498
n_clusters=6, 轮廓系数: 0.3288163277603568
n_clusters=7, 轮廓系数: 0.3333544617727268
n_clusters=8, 轮廓系数: 0.33909908149141516
n_clusters=9, 轮廓系数: 0.25749046642163553
n_clusters=10, 轮廓系数: 0.20612469887334656
n_clusters=11, 轮廓系数: 0.20493918999636898
n_clusters=12, 轮廓系数: 0.24577590024841856
n_clusters=13, 轮廓系数: 0.22758531567545867
n_clusters=14, 轮廓系数: 0.23148889572810827
n_clusters=15, 轮廓系数: 0.23334511463899904
n_clusters=16, 轮廓系数: 0.23891270646332238
n_clusters=17, 轮廓系数: 0.20845711655736793
n_clusters=18, 轮廓系数: 0.18378786922113324
n_clusters=19, 轮廓系数: 0.1800498161881021
n_clusters=20, 轮廓系数: 0.16263102579572203
python
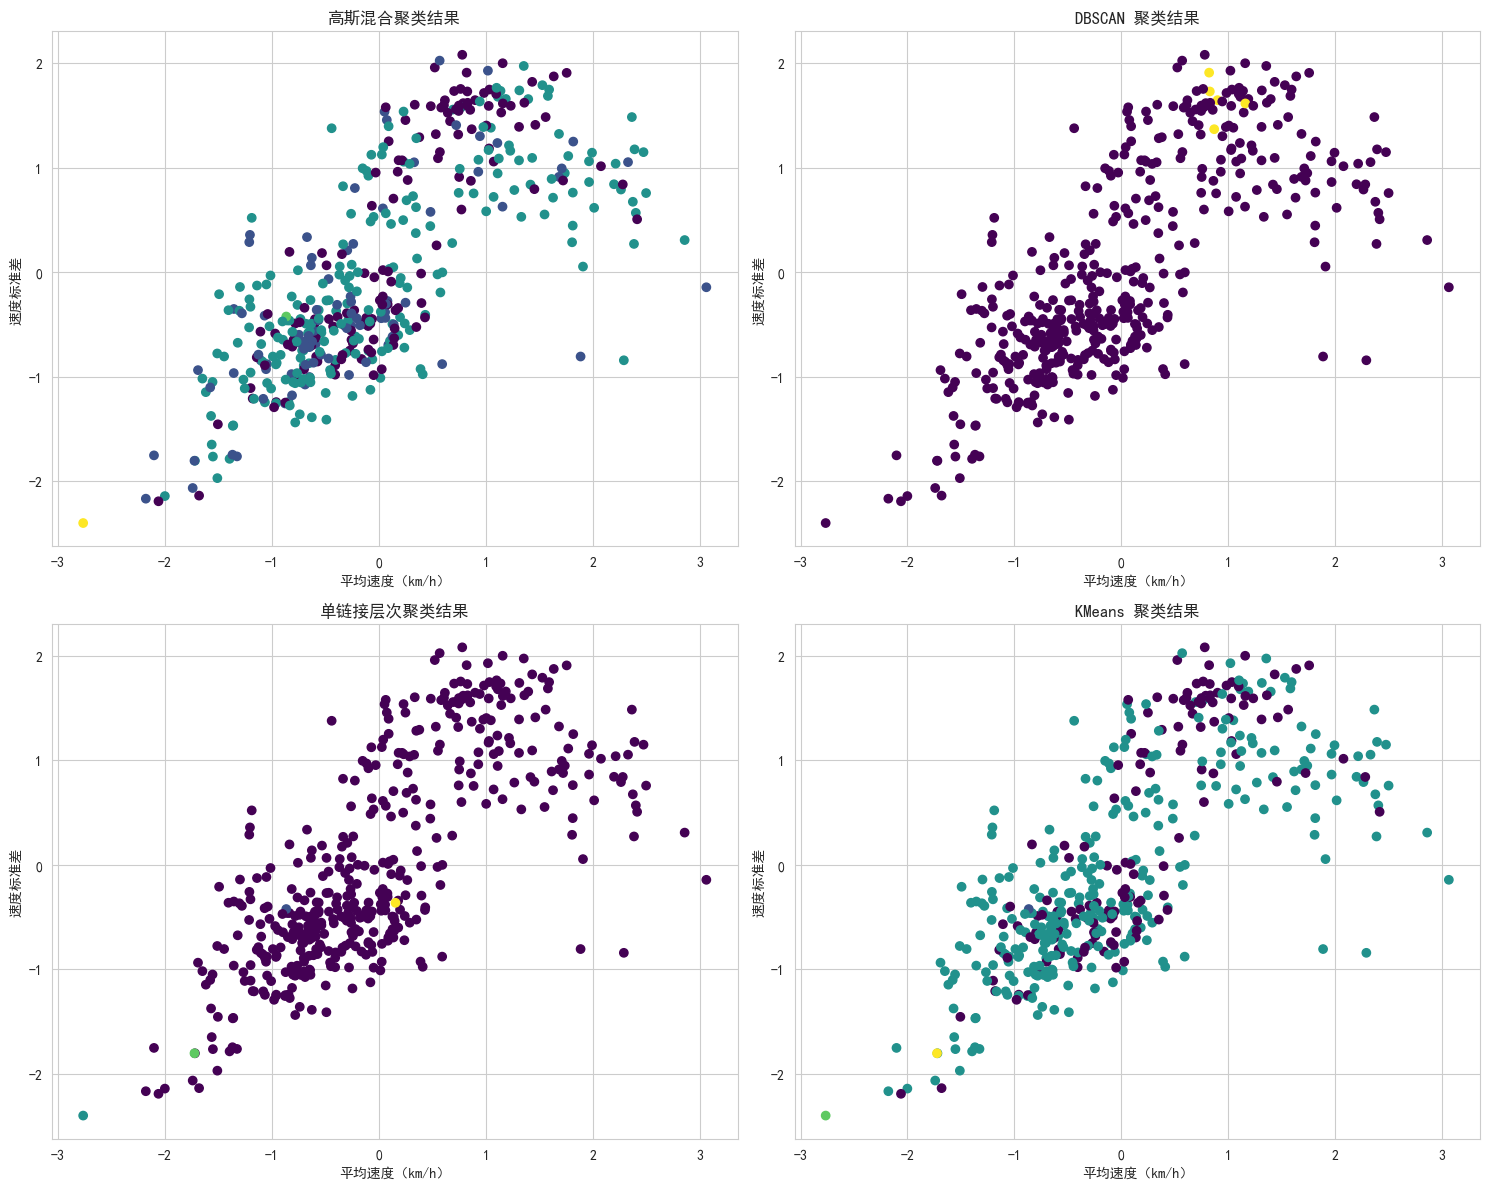
# 选择两个特征用于绘图
features = ['平均速度(km/h)', '速度标准差']
df_plot = df[features]

# 1. 使用高斯混合聚类算法实现
# (1) 使用 GaussianMixture() 建立模型,设置混合高斯模型的个数 n_components
gm = GaussianMixture(n_components=5, random_state=42)
gm.fit(df)

# (2) 使用模型对数据集进行聚类,并输出聚类结果
df['cluster_gm'] = gm.predict(df)

# 2. 使用 DBSCAN 密度聚类算法实现
# (1) 使用 DBSCAN() 建立模型,设置半径 eps 和最小样本数 min_samples
dbscan = DBSCAN(eps=0.5, min_samples=5)
dbscan.fit(df)

# (2) 使用模型对数据集进行聚类,并输出聚类结果
df['cluster_dbscan'] = dbscan.labels_

# 3. 使用单链接层次聚类算法实现
# (1) 使用 AgglomerativeClustering() 建立模型,设置聚类簇数 n_clusters
agg_clustering = AgglomerativeClustering(n_clusters=5, linkage='single')
agg_clustering.fit(df)

# (2) 使用模型对数据集进行聚类,并输出聚类结果
df['cluster_agg'] = agg_clustering.labels_

# 4. 绘制聚类结果散点图
plt.figure(figsize=(15, 12))

# (1) 高斯混合聚类结果
plt.subplot(2, 2, 1)
plt.scatter(df_plot.iloc[:, 0], df_plot.iloc[:, 1], c=df['cluster_gm'], cmap='viridis')
plt.title('高斯混合聚类结果')
plt.xlabel(features[0])
plt.ylabel(features[1])

# (2) DBSCAN 聚类结果
plt.subplot(2, 2, 2)
plt.scatter(df_plot.iloc[:, 0], df_plot.iloc[:, 1], c=df['cluster_dbscan'], cmap='viridis')
plt.title('DBSCAN 聚类结果')
plt.xlabel(features[0])
plt.ylabel(features[1])

# (3) 单链接层次聚类结果
plt.subplot(2, 2, 3)
plt.scatter(df_plot.iloc[:, 0], df_plot.iloc[:, 1], c=df['cluster_agg'], cmap='viridis')
plt.title('单链接层次聚类结果')
plt.xlabel(features[0])
plt.ylabel(features[1])

# (4) KMeans 聚类结果
plt.subplot(2, 2, 4)
plt.scatter(df_plot.iloc[:, 0], df_plot.iloc[:, 1], c=df['cluster'], cmap='viridis')
plt.title('KMeans 聚类结果')
plt.xlabel(features[0])
plt.ylabel(features[1])

plt.tight_layout()
plt.show()

# 输出聚类结果
print("\n高斯混合聚类结果:")
print(df[['cluster_gm']])
print("\nDBSCAN 聚类结果:")
print(df[['cluster_dbscan']])
print("\n单链接层次聚类结果:")
print(df[['cluster_agg']])
print("\nKMeans 聚类结果:")
print(df[['cluster']])