背景
之前都是做的表格数据分类回归,文本的分类,图片的分类,还没有做过音频文件的分类。本次案例是3年前帮同学写论文做的,这次拿出来分享一下。 由于是早年刚开始学深度学习写的代码,肯定有很多不成熟的地方,我也懒得修改了,就原汁原味的秀出来吧。
数据介绍
本次数据装到代码同目录的"./戏曲"文件夹里面,文件夹里面又有很多不同音乐的类别

每个文件夹里面都有100首MP3歌曲文件。我们就取:"京剧 越剧 黄梅戏 秦腔 豫剧 评剧 "6个文件夹里面的歌曲吧。
我们要做的就是对这个600首歌曲提取特征,然后进行神经网络的模型训练和分类评估。
这些歌曲都是我上淘宝买的....由于文件太大,某面包平台放不下,这里就不提供数据的获取了。
音频特征提取
先导入包。音频特征提取主要依靠librosa包,它会提取一堆音频界描述音频的特征,什么频谱滚降点,频谱中心,时变频谱图,过零率,Mel-Scaled频率.......我也不太懂了,反正就是特征,提取就完事了。
python
import numpy as np
import pandas as pd
import matplotlib.pyplot as plt
import seaborn as sns
import librosa
import os
然后循环遍历,提取每个文件的特征的代码:
python
genres = '京剧 越剧 黄梅戏 秦腔 豫剧 评剧 '.split()
data_set = []
label_set = []
label2id = {genre:i for i,genre in enumerate(genres)}
#id2label = {i:genre for i,genre in enumerate(genres)}

print(label2id)
for g in genres:
    print(g)
    for filename in os.listdir(f'./戏曲/{g}/'):
        songname = f'./戏曲/{g}/{filename}'
        y, sr = librosa.load(songname, mono=True, offset=15,duration=10)
        chroma_stft = librosa.feature.chroma_stft(y=y, sr=sr)#12
        chroma_cqt = librosa.feature.chroma_cqt(y=y, sr=sr)#12
        chroma_cens = librosa.feature.chroma_cens(y=y, sr=sr)#12
        melspectrogram=librosa.feature.melspectrogram(y=y,sr=sr)#128

        rmse = librosa.feature.rms(y=y)#1
        spec_cent = librosa.feature.spectral_centroid(y=y, sr=sr)#1
        spec_bw = librosa.feature.spectral_bandwidth(y=y, sr=sr)#1
        spec_cont=librosa.feature.spectral_contrast(y=y, sr=sr)#7
        spec_flat=librosa.feature.spectral_flatness(y=y)#1
        rolloff = librosa.feature.spectral_rolloff(y=y, sr=sr)#1

        poly=librosa.feature.poly_features(y=y,sr=sr)#2
        tonnetz=librosa.feature.tonnetz(y=y,sr=sr)#6
        zcr = librosa.feature.zero_crossing_rate(y)#1
        mfcc = librosa.feature.mfcc(y=y, sr=sr)#20
        x=np.concatenate((chroma_stft.T ,chroma_cqt.T,chroma_cens.T,melspectrogram.T,rmse.T,spec_cent.T,spec_bw.T,spec_cont.T,
                  spec_flat.T,rolloff.T,poly.T,tonnetz.T,zcr.T,mfcc.T),axis=1)
        data_set.append(x)
        label_set.append(label2id[g])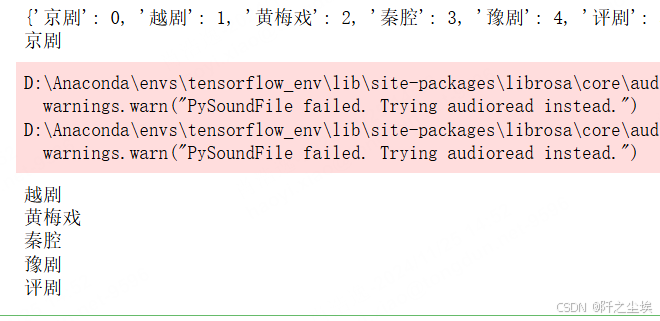
这个吃cpu,有点慢,
我们看看数据的量和每条数据的形状:
python
print(len(data_set))
data_set[0].shape
可以看到是600个数据,就是600首歌曲。然后每一个数据的形状是(431,205),431是时间步长,205是提取的特征维度,总共有205个特征。
可以检查一下,有没有歌曲的形状不是这样的:
python
for i in range(len(data_set)):
    if data_set[i].shape!=(431,205):
        print(i,data_set[i].shape)
没有打印的话就表示没有。数据很规整。
如果有的话就用前一个数据填充一下吧:
python
#data_set[204][428:,:].shape
#data_set[432]=np.r_[data_set[432],data_set[431][428:,:]]
然后转为数据矩阵,查看形状
python
X = np.array(data_set,dtype='float')
y = np.array(label_set)
X.shape,y.shape
进行储存
python
#df1=pd.DataFrame(X)
df2=pd.DataFrame(y)
np.save(file='特征10.npy',arr=X)
df2.to_csv('标签2.csv',index=False)
标签是1维的,可以存为csv,但是X是3维的,表格是二维的解构存不了,就存为np数组好了。
神经网络分类
导入包
python
import numpy as np
import os
import random as rn
import pandas as pd
import matplotlib.pyplot as plt
import seaborn as sns

from sklearn.model_selection import train_test_split
from sklearn.preprocessing import MinMaxScaler
from sklearn.metrics import confusion_matrix
from sklearn.preprocessing import StandardScaler

from keras.models import Model, Sequential
from keras.layers import GRU, Dense,Conv1D, MaxPooling1D,GlobalMaxPooling1D,Embedding,Dropout,Flatten,Conv2D, MaxPooling2D
from keras.callbacks import EarlyStopping
from tensorflow.keras import regularizers
from keras.utils.np_utils import to_categorical
from tensorflow.keras  import optimizers

import tensorflow as tf
import keras
#from keras.datasets import mnist, reuters, boston_housing
# from keras.models import Sequential
# from keras.layers import Dense, Dropout, Flatten
#from keras.layers import Conv1D, MaxPooling2D
设定随机数种子
python
def set_my_seed():
    os.environ['PYTHONHASHSEED'] = '0'
    np.random.seed(1)
    rn.seed(12345)
    tf.random.set_seed(123)
读取数据
python
label_set=pd.read_csv('标签.csv')
feature= np.load(file='特征10.npy')
y=np.array(label_set)

feature.shape,y.shape
X进行标准化
python
def check(X):
    two=X.reshape((X.shape[0]*X.shape[1],X.shape[2]))
    scaler=StandardScaler()
    scaler.fit(two)
    two_s=scaler.transform(two)
    three=two_s.reshape((X.shape[0],X.shape[1],X.shape[2]))
    return three
X=check(feature)
我们构建二维卷积神经网络,所以要把数据转为4维结构
python
#二维卷积才运行
X=X.reshape(X.shape[0],X.shape[1],X.shape[2],1)
划分训练集和测试集
python
X_trainval, X_test, y_trainval, y_test = train_test_split(X, y, stratify=y,test_size=0.15, random_state=0)
X_train, X_val, y_train, y_val = train_test_split(X_trainval, y_trainval,stratify= y_trainval,test_size=0.2, random_state=321)
X_trainval.shape, X_train.shape, X_val.shape, X_test.shape
y进行独热编码
python
y_trainval = to_categorical(y_trainval)
y_train = to_categorical(y_train)
y_val = to_categorical(y_val)

y_test_original = y_test
y_test = to_categorical(y_test)

y_train.shape, y_val.shape, y_test.shape
数据形状都没问题,开始构建模训练。
我这里写了很多模型,主要就是用二维卷积就行了,
python
set_my_seed()
model = Sequential()

#多层感知机
# model.add(Dense(512, activation='relu', kernel_regularizer=regularizers.l2(0.0001),input_shape=(X_train.shape[1], )))
# model.add(Dropout(0.25))
# model.add(Dense(256, activation='relu',kernel_regularizer=regularizers.l2(0.0001)))
# model.add(Dropout(0.25)) # 加入Dropout层抗过拟合

#循环网络
#model.add(GRU(128,input_shape=(X_train.shape[-2],X_train.shape[-1])))
#model.add(GRU(16,return_sequences=True, ))
#一维卷积
# model.add(Conv1D(128,9,activation='relu',input_shape=(X_train.shape[-2],X_train.shape[-1])))
# model.add(Conv1D(64,7,activation='relu'))
# model.add(MaxPooling1D(5))
# model.add(Conv1D(32,7,activation='relu'))
# model.add(GlobalMaxPooling1D())

#二维卷积
model.add(Conv2D(32,(3,3),activation='relu',input_shape=(X_train.shape[1],X_train.shape[2],1)))
model.add(Conv2D(16,(3,3),activation='relu'))
model.add(MaxPooling2D(2,2))
model.add(Flatten())
model.add(Dense(32,activation='relu'))

model.add(Dense(6,activation='softmax'))
model.compile(optimizer='Adam', loss='binary_crossentropy',metrics=['accuracy'],run_eagerly=True)
查看模型信息
python
model.summary()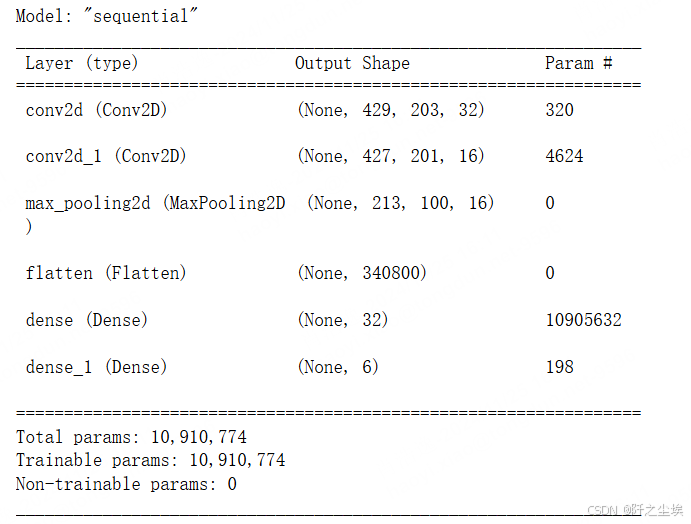
设定早停机制
python
earlystop = EarlyStopping(monitor='val_loss', min_delta=0, patience=5)训练模型
python
hist=model.fit(X_train, y_train,batch_size=32,epochs=100,
          validation_data=(X_val, y_val),shuffle=False,
               callbacks=[earlystop],
               verbose=1)
查看训练第几轮的时候验证集损失最小
python
val_loss = hist.history['val_loss']
index_min = np.argmin(val_loss)
index_min
画出来
python
plt.plot(hist.history['loss'], 'k', label='Training Loss')
plt.plot(val_loss, 'b', label='Validation Loss')
plt.axvline(index_min, linestyle='--', color='k')
plt.title('Training and Validation Loss')
plt.xlabel('Epochs')
plt.ylabel('Loss')
plt.legend()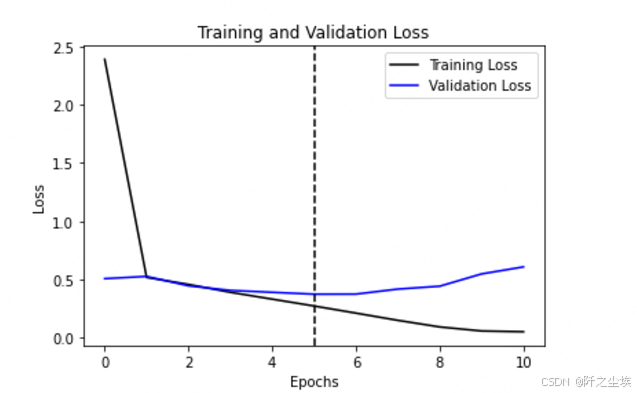
查看最大的准确率是多少
python
val_accuracy = hist.history['val_accuracy']
np.max(val_accuracy)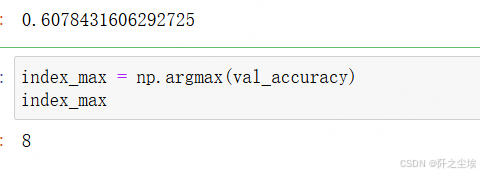
python
index_max = np.argmax(val_accuracy)
index_max
最大的准确率是在第8轮。
可视化
python
plt.plot(hist.history['accuracy'], 'k', label='Training Accuracy')
plt.plot(val_accuracy, 'b', label='Validation Accuracy')
plt.axvline(index_max, linestyle='--', color='k')
plt.title('Training and Validation Accuracy')
plt.xlabel('Epochs')
plt.ylabel('Accuracy')
plt.legend()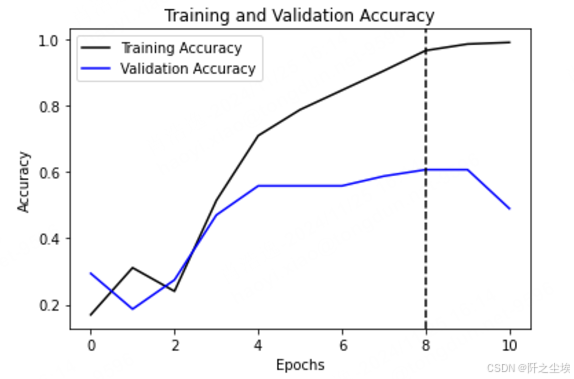
得到预测概率,并且进行最大索引化转为类别
python
prob = model.predict(X_test)
prob[1]

#pred = model.predict_classes(X_test)
pred=np.argmax(prob,axis=-1)
pred[:5]
模型保存
python
#from keras.models import load_model
model.save('音频特征卷积.h5')
画混淆矩阵
python
y_test_original=y_test_original.reshape(-1,)
table = pd.crosstab(y_test_original, pred, rownames=['Actual'], colnames=['Predicted'])
table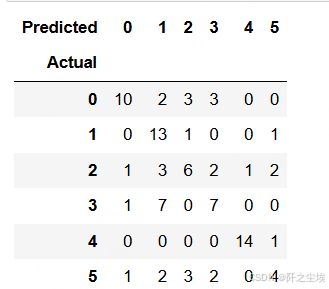
可视化
python
sns.heatmap(table, cmap='Blues', annot=True, fmt='d')
plt.tight_layout()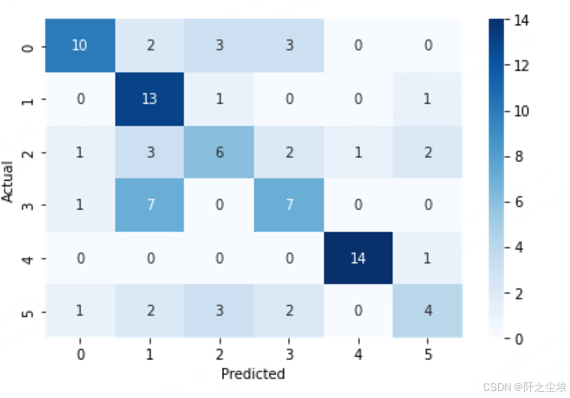
分类就做完了。整体的准确率只有60%多,一般般的效果。
特征分析
音频特征是可以进行可视化的。我这里在6只种戏曲里面都任取1首,放入'./样本'文件夹里面,然后对他们的特征进行可视化对比。
导入包
python
import numpy as np
import pandas as pd
import matplotlib.pyplot as plt
import seaborn as sns

import librosa
import librosa.display
import os
%matplotlib inline

plt.rcParams['font.sans-serif'] = ['KaiTi']
plt.rcParams['font.serif'] = ['KaiTi']
plt.rcParams['axes.unicode_minus'] = False # 解决保存图像是负号'-'显示为方块的问题,或者转换负号为字符串
sns.set_style("darkgrid",{"font.sans-serif":['KaiTi', 'Arial']})
振幅图
python
plt.figure(figsize=(18, 12))
for i,songname in enumerate(os.listdir(f'./样本')):
    filename = f'./样本/{songname}'
    y, sr = librosa.load(filename , mono=True, duration=30)
    plt.subplot(3,2,i+1)

    librosa.display.waveplot(y, sr=sr)
    plt.title(songname.strip('.mp3'),fontsize=24)
    plt.tight_layout()
plt.savefig('时间-振幅图.png',dpi=300)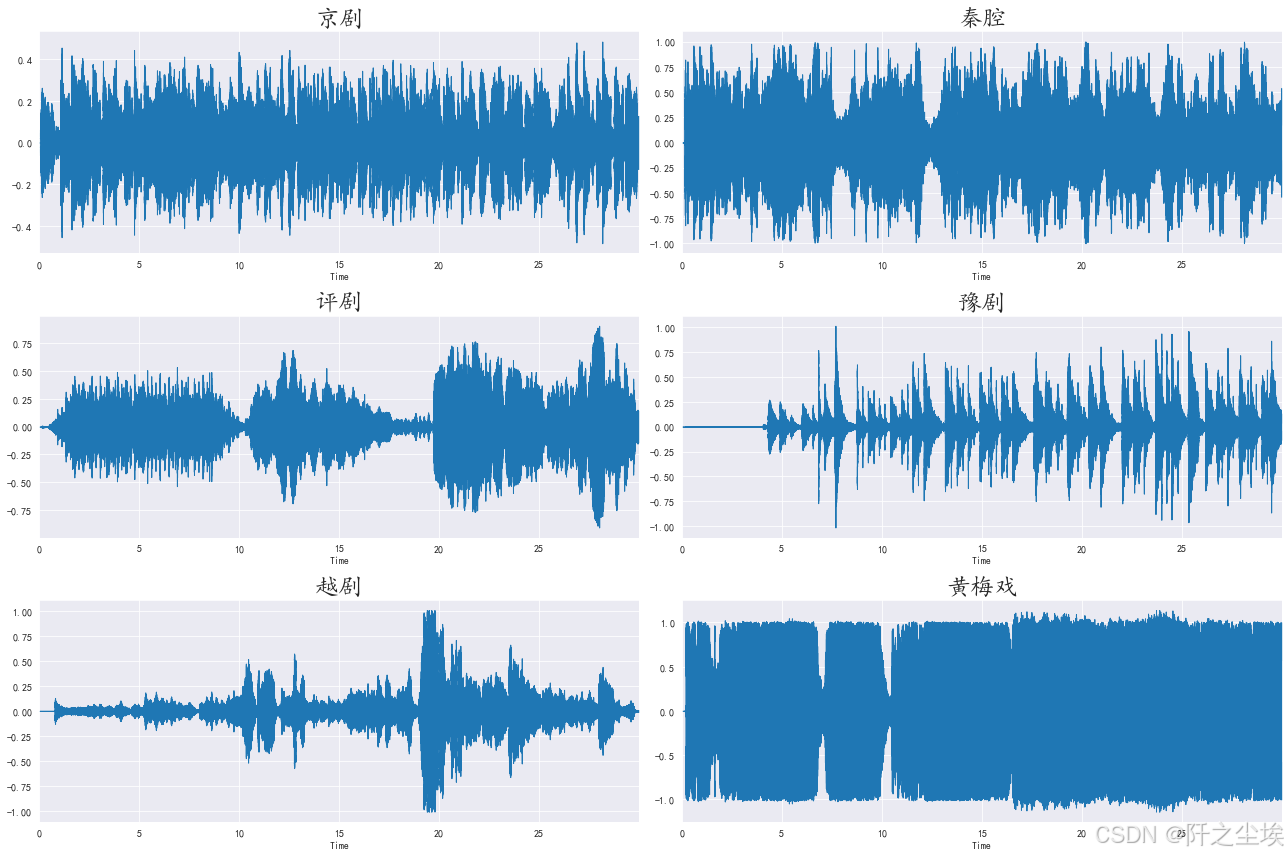
时变频谱图
python
plt.figure(figsize=(18, 12))
for i,songname in enumerate(os.listdir(f'./样本')):
    filename = f'./样本/{songname}'
    y, sr = librosa.load(filename , mono=True, duration=30)
    X = librosa.stft(y)
    Xdb = librosa.amplitude_to_db(abs(X))

    plt.subplot(3,2,i+1)
    librosa.display.specshow(Xdb, sr=sr, x_axis='time', y_axis='hz')
    plt.colorbar()
    plt.title(songname.strip('.mp3'),fontsize=24)
    plt.tight_layout()
plt.savefig('信号的时变频谱图.png',dpi=500)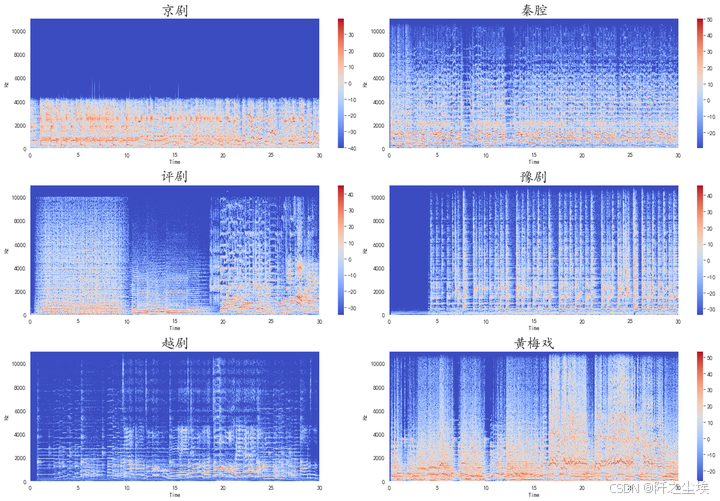
过零点
python
#plt.figure(figsize=(18, 12))
s=[]
n=[]
for i,songname in enumerate(os.listdir(f'./样本')):
    filename = f'./样本/{songname}'
    n.append(songname.strip('.mp3'))
    y, sr = librosa.load(filename , mono=True, duration=30)

    zero_crossings = librosa.zero_crossings(y, pad=False)
    sumzero=sum(zero_crossings)
    s.append(sumzero)

df=pd.DataFrame({'戏曲':s},index=n)
df.plot.bar()
plt.xticks(fontsize=20,rotation=0)
plt.tight_layout()
plt.savefig('过零点.png',dpi=200)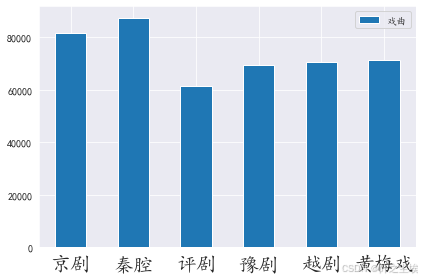
频谱中心图
python
#频谱中心代表声音的"质心",又称为频谱一阶距。频谱中心的值越小,表明越多的频谱能量集中在低频范围内
from sklearn.preprocessing import minmax_scale

def normalize(y, axis=0):
    #scaler=MinMaxScaler()
    return minmax_scale(y, axis=axis)


plt.figure(figsize=(18, 12))
for i,songname in enumerate(os.listdir(f'./样本')):
    filename = f'./样本/{songname}'
    y, sr = librosa.load(filename , mono=True, duration=30)
    spectral_centroids = librosa.feature.spectral_centroid(y, sr=sr)[0]

    frames = range(len(spectral_centroids))
    t = librosa.frames_to_time(frames, sr=sr)


    plt.subplot(3,2,i+1)
    librosa.display.waveplot(y, sr=sr, alpha=0.4)
    plt.plot(t, normalize(spectral_centroids), color='r')

    plt.title(songname.strip('.mp3'),fontsize=24)
    plt.tight_layout()
plt.savefig('频谱中心图.png',dpi=500)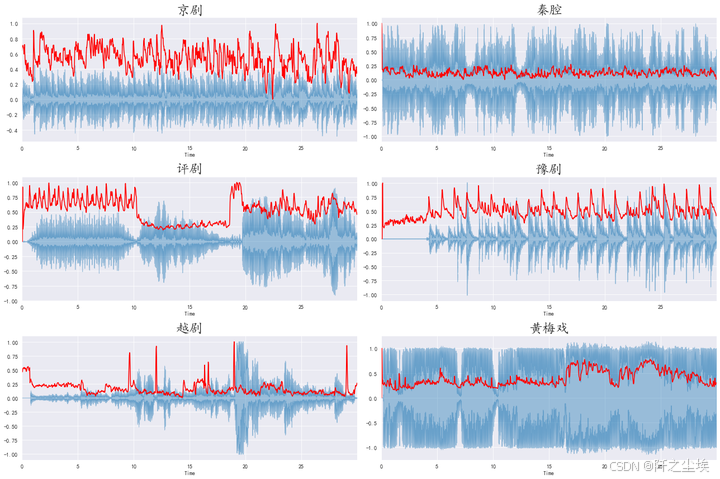
频谱滚降点
python
plt.figure(figsize=(18, 12))
for i,songname in enumerate(os.listdir(f'./样本')):
    filename = f'./样本/{songname}'
    y, sr = librosa.load(filename , mono=True, duration=30)
    spectral_rolloff = librosa.feature.spectral_rolloff(y, sr=sr)[0]

    plt.subplot(3,2,i+1)
    librosa.display.waveplot(y, sr=sr, alpha=0.4)
    plt.plot(t, normalize(spectral_rolloff), color='r')

    plt.title(songname.strip('.mp3'),fontsize=24)
    plt.tight_layout()
plt.savefig('频谱滚降点.png',dpi=500)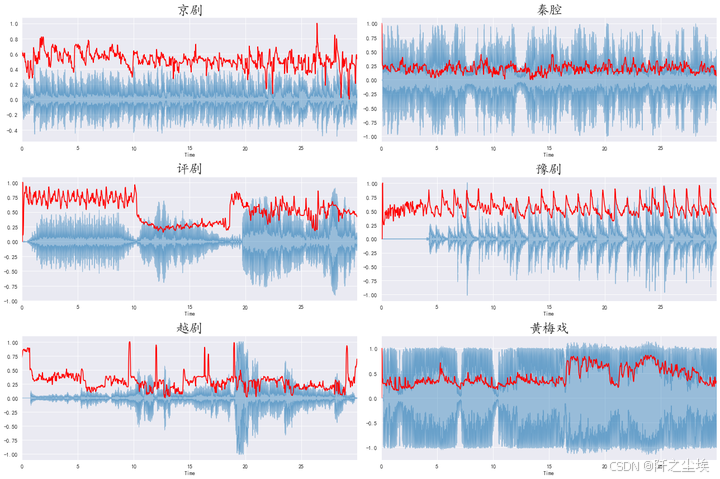
梅尔频率倒谱系数
python
plt.figure(figsize=(18, 12))
for i,songname in enumerate(os.listdir(f'./样本')):
    filename = f'./样本/{songname}'
    y, sr = librosa.load(filename , mono=True, duration=30)
    mfccs = librosa.feature.mfcc(y, sr=sr)

    plt.subplot(3,2,i+1)
    librosa.display.specshow(mfccs, sr=sr, x_axis='time')

    plt.title(songname.strip('.mp3'),fontsize=24)
    plt.tight_layout()
plt.savefig('梅尔频率倒谱系数.png',dpi=500)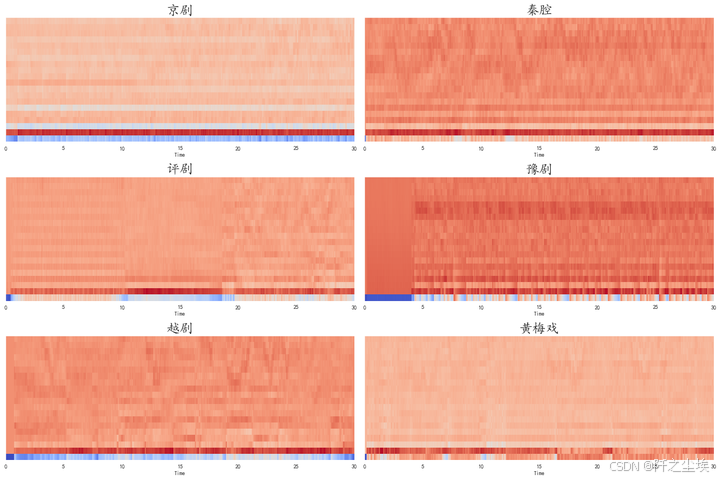
色度频率图
python
plt.figure(figsize=(18, 12))
for i,songname in enumerate(os.listdir(f'./样本')):
    filename = f'./样本/{songname}'
    y, sr = librosa.load(filename , mono=True, duration=30)
    mfccs = librosa.feature.mfcc(y, sr=sr)

    plt.subplot(3,2,i+1)
    hop_length = 512
    chromagram = librosa.feature.chroma_stft(y, sr=sr, hop_length=hop_length)
    librosa.display.specshow(chromagram, x_axis='time', y_axis='chroma', hop_length=hop_length, cmap='coolwarm')

    plt.title(songname.strip('.mp3'),fontsize=24)
    plt.tight_layout()
plt.savefig('色度频率图.png',dpi=500)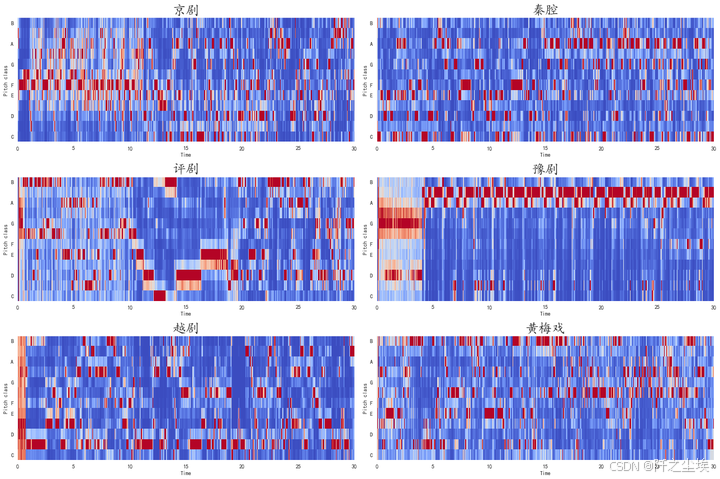
Mel-Scaled频率图
python
# Mel-Scaled频率图
plt.figure(figsize=(18, 12))
for i,songname in enumerate(os.listdir(f'./样本')):
    filename = f'./样本/{songname}'
    y, sr = librosa.load(filename , mono=True, duration=30)
    D = np.abs(librosa.stft(y)) ** 2  # stft频谱
    S = librosa.feature.melspectrogram(S=D)  # 使用stft频谱求Mel频谱

    plt.subplot(3,2,i+1)
    librosa.display.specshow(librosa.power_to_db(S, ref=np.max),
                            y_axis='mel', fmax=8000, x_axis='time')
    plt.colorbar(format='%+2.0f dB')
    plt.title(songname.strip('.mp3'),fontsize=24)
    plt.tight_layout()
plt.savefig('Mel-Scaled频率图.png',dpi=500)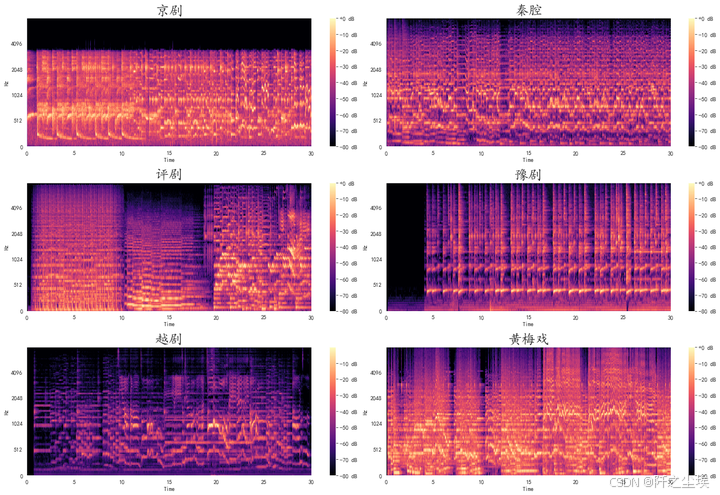
功率谱案例图
python
#功率谱案例图
S = np.abs(librosa.stft(y))
# print(librosa.power_to_db(S**2))
plt.figure()
plt.subplot(2,1,1)
librosa.display.specshow(S**2, sr=sr, y_axis='log')
plt.colorbar()
plt.title('Power spectrogram')

plt.subplot(2,1,2)
# 相对于峰值功率计算db
librosa.display.specshow(librosa.power_to_db(S**2, ref=np.max), sr=sr, y_axis='log', x_axis='time')
plt.colorbar(format='%+2.0f dB')
plt.title('Log Power spectrogram')
plt.set_cmap('autumn')
plt.tight_layout()
plt.show()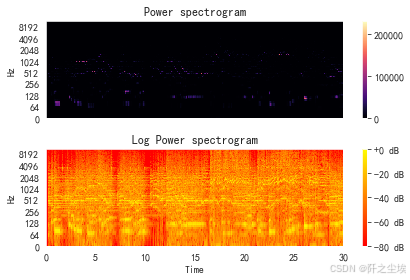
频率谱图
python
# 频率谱图
plt.figure()

plt.subplot(2, 1, 1)
librosa.display.specshow(D, y_axis='linear')
plt.colorbar(format='%+2.0f dB')
plt.title('Linear freq. Power Spec.') # 线性频率功率谱

plt.subplot(2, 1, 2)
librosa.display.specshow(librosa.amplitude_to_db(np.abs(librosa.stft(y)), ref=np.max), y_axis='log')
plt.colorbar(format='%+2.0f dB')
plt.title('Log freq. Power Spec.') # 对数频率功率谱
plt.show()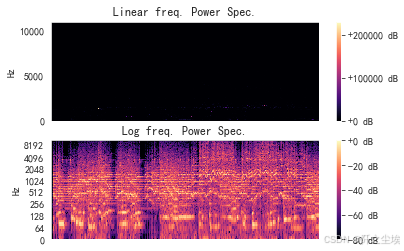
由于音频文件是典型的序列文件,其实最经典应该是用循环神经网络系列来做分类,LSTM,GRU这些,还可以加注意力机制等。本文重点在于构建特征,和音频分析,而不是神经网络模型,模型构建可以进行更多的尝试,也是很简单的。
创作不易,看官觉得写得还不错的话点个关注和赞吧,本人会持续更新python数据分析领域的代码文章~(需要定制类似的代码可私信)