作者: yangzhj 原文来源: https://tidb.net/blog/229e283c
背景
在日常运维工作中,我们有时需要将多个生产集群的告警信息展示在一起,统一集中观察和分析TiDB 集群的告警情况。
本文将通过 Grafana 的多数据源功能来将多个TiDB 集群的 emergency级别的告警信息展示到一张 Grafana Dashboard 中。
实现过程示例
首先需要选择某个集群的 grafana 创建 Dashboard。
创建dashboard

创建panel

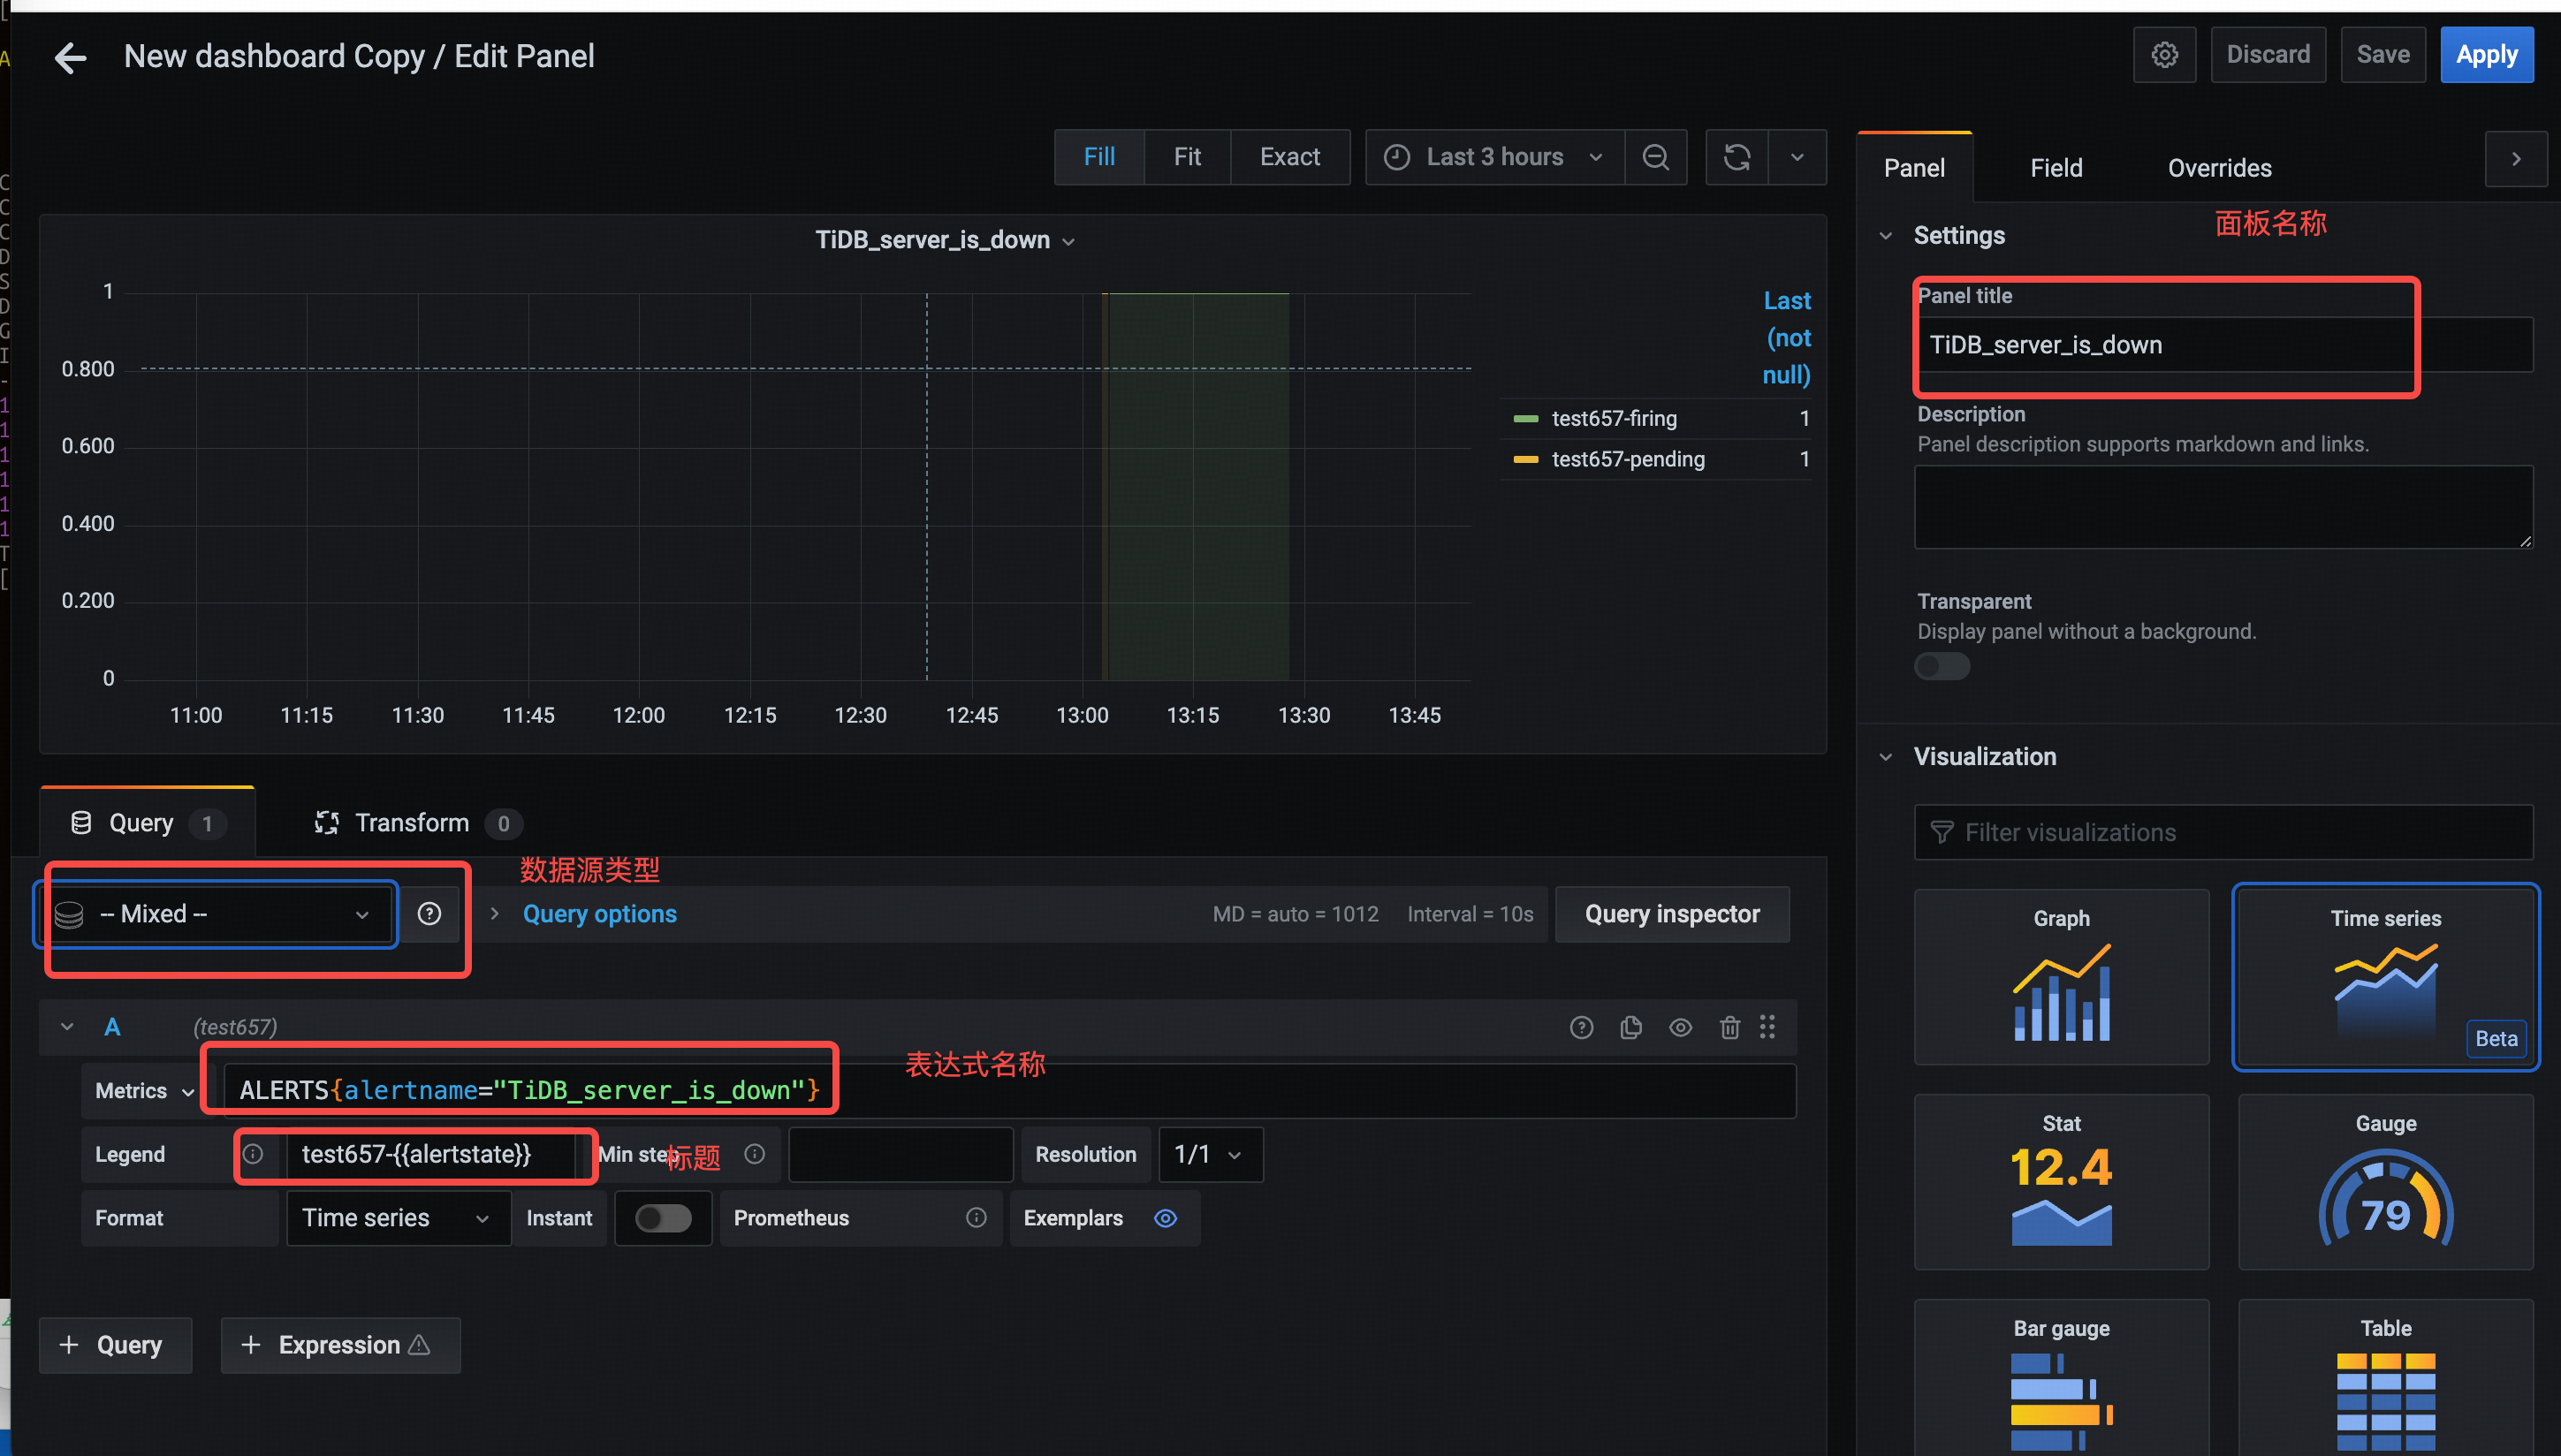
配置panel

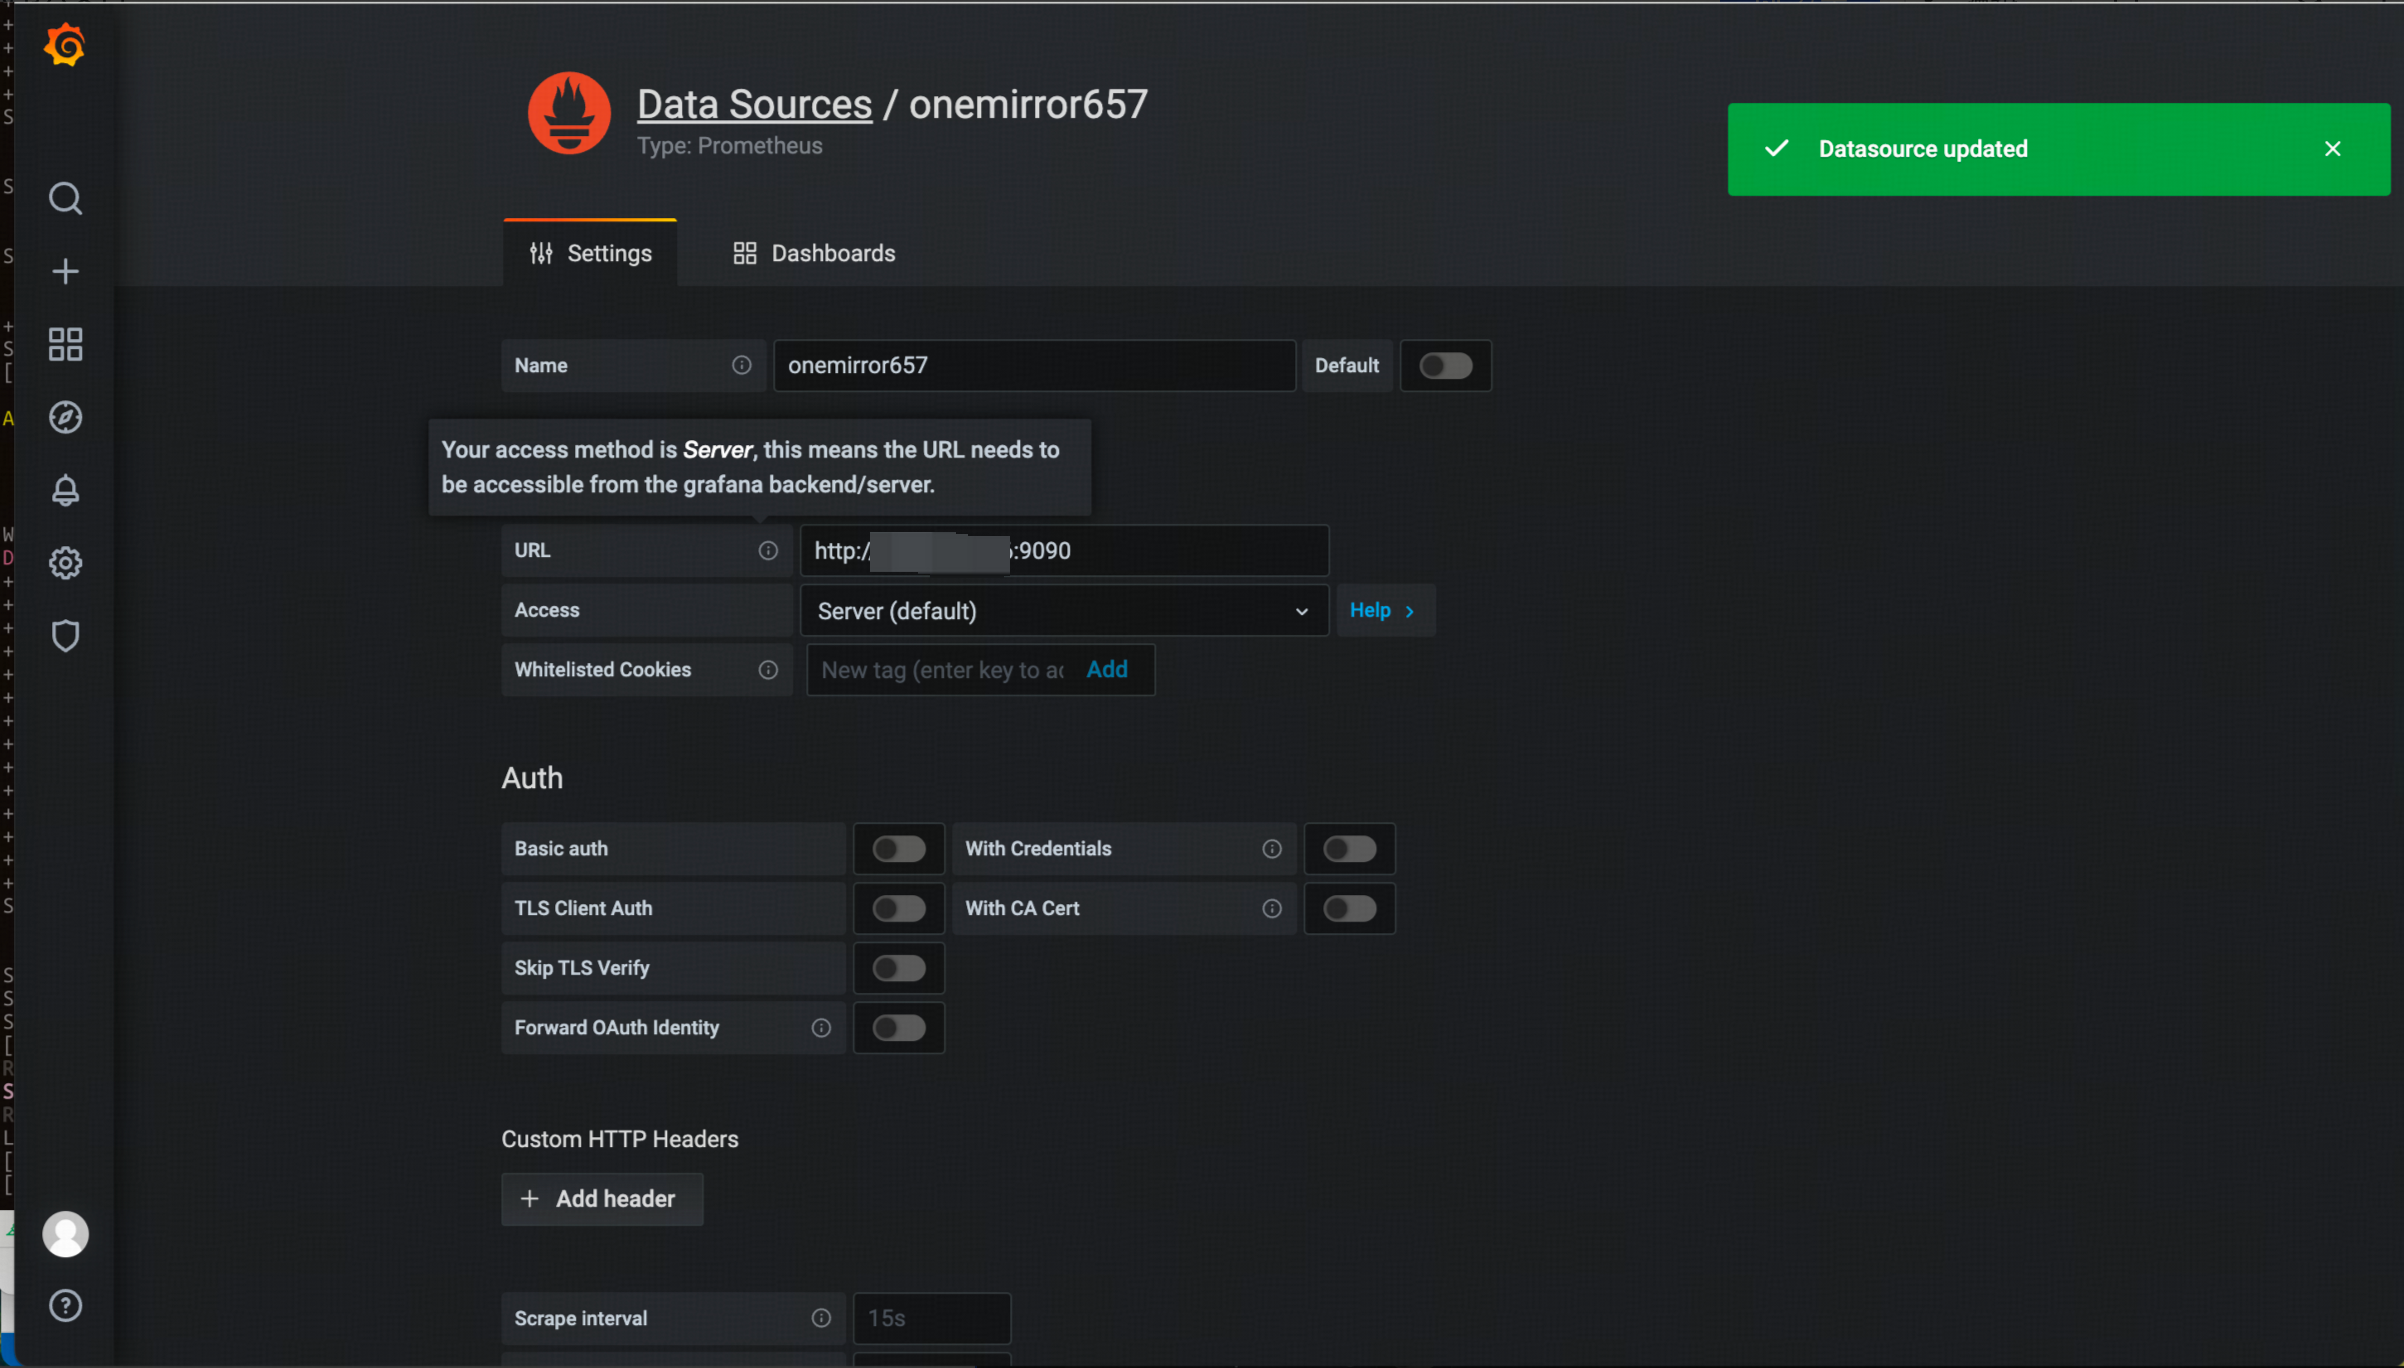
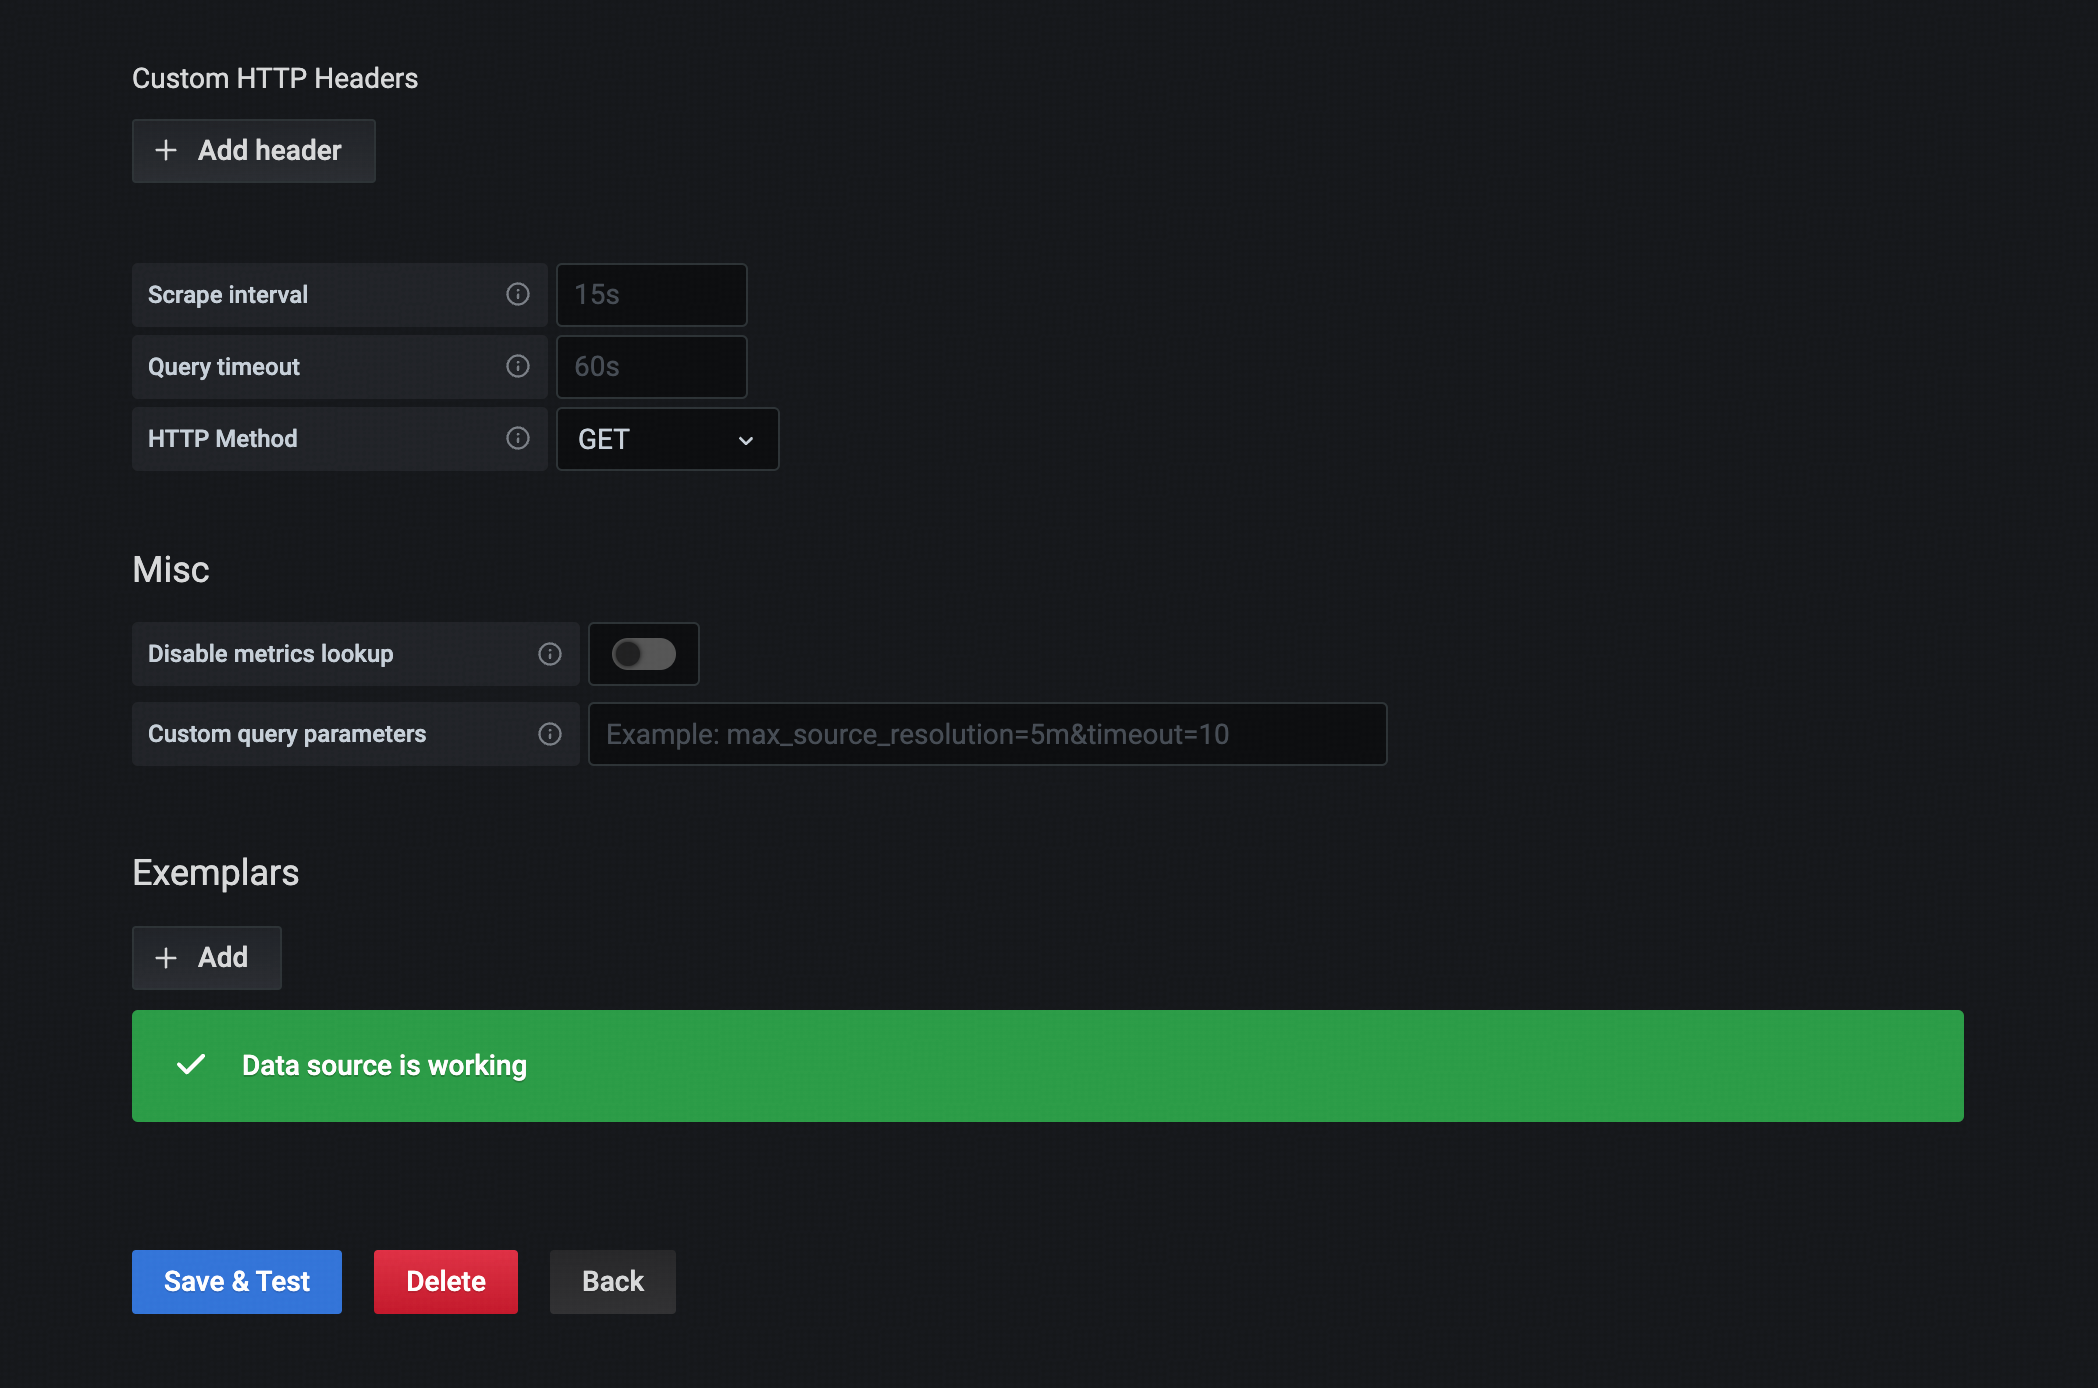
添加其他tidb集群的数据源


在面板中增加其他数据源的监控指标

添加其他监控指标的面板
其他监控指标面板的方式与上述示例相同,不再重复描述。
示例Dashboard配置
JSON
{
  "annotations": {
    "list": [
      {
        "builtIn": 1,
        "datasource": "-- Grafana --",
        "enable": true,
        "hide": true,
        "iconColor": "rgba(0, 211, 255, 1)",
        "name": "Annotations & Alerts",
        "type": "dashboard"
      }
    ]
  },
  "editable": true,
  "gnetId": null,
  "graphTooltip": 0,
  "id": 27,
  "links": [],
  "panels": [
    {
      "datasource": "-- Mixed --",
      "description": "",
      "fieldConfig": {
        "defaults": {
          "color": {
            "mode": "palette-classic"
          },
          "custom": {
            "axisLabel": "",
            "axisPlacement": "auto",
            "barAlignment": 0,
            "drawStyle": "line",
            "fillOpacity": 10,
            "gradientMode": "none",
            "hideFrom": {
              "graph": false,
              "legend": false,
              "tooltip": false
            },
            "lineInterpolation": "stepAfter",
            "lineStyle": {
              "fill": "solid"
            },
            "lineWidth": 1,
            "pointSize": 4,
            "scaleDistribution": {
              "type": "linear"
            },
            "showPoints": "always",
            "spanNulls": true
          },
          "mappings": [
            {
              "from": "",
              "id": 1,
              "text": "告警中",
              "to": "",
              "type": 1,
              "value": "1"
            }
          ],
          "max": 1,
          "min": 0,
          "thresholds": {
            "mode": "absolute",
            "steps": [
              {
                "color": "green",
                "value": null
              },
              {
                "color": "red",
                "value": 80
              }
            ]
          },
          "unit": "short"
        },
        "overrides": []
      },
      "gridPos": {
        "h": 6,
        "w": 12,
        "x": 0,
        "y": 0
      },
      "id": 2,
      "options": {
        "graph": {},
        "legend": {
          "calcs": [
            "lastNotNull"
          ],
          "displayMode": "table",
          "placement": "right"
        },
        "tooltipOptions": {
          "mode": "multi"
        }
      },
      "pluginVersion": "7.5.11",
      "targets": [
        {
          "datasource": "test657",
          "exemplar": false,
          "expr": "ALERTS{alertname=\"TiDB_server_is_down\"}",
          "instant": false,
          "interval": "",
          "legendFormat": "test657-{{alertstate}}",
          "queryType": "randomWalk",
          "refId": "A"
        },
        {
          "datasource": "onemirror657",
          "exemplar": true,
          "expr": "ALERTS{alertname=\"TiDB_server_is_down\"}",
          "format": "time_series",
          "hide": false,
          "instant": false,
          "interval": "",
          "legendFormat": "onemirror657-{{alertstate}}",
          "refId": "B"
        }
      ],
      "timeFrom": null,
      "timeShift": null,
      "title": "TiDB_server_is_down",
      "type": "timeseries"
    }
  ],
  "refresh": false,
  "schemaVersion": 27,
  "style": "dark",
  "tags": [],
  "templating": {
    "list": []
  },
  "time": {
    "from": "now-3h",
    "to": "now"
  },
  "timepicker": {},
  "timezone": "",
  "title": "New dashboard Copy",
  "uid": "RPbLfznHk",
  "version": 5
}
询问AI
询问AI