导入
#pip install 第三方库 -i https://pypi.tuna.tsinghua.edu.cn/simple`
`#pip install pyecharts -i https://pypi.tuna.tsinghua.edu.cn/simple`
`import pyecharts`
`pyecharts.__version__  # 查看版本
绘制图表
from pyecharts.charts import Bar`

`bar = Bar()`
`bar.add_xaxis(["衬衫", "羊毛衫", "雪纺衫", "裤子", "高跟鞋", "袜子"])`
`bar.add_yaxis("商家A", [5, 20, 36, 10, 75, 90])`
`bar.render_notebook()  # 在notebook显示`
`
pyecharts绘制基本图表
#Calendar:日历图
import datetime`
`import random`
`from pyecharts import options as opts`
`from pyecharts.charts import Calendar`
`begin = datetime.date(2017,1,1)`
`end = datetime.date(2017,12,31)`
`data =` `[`
`[str(begin+datetime.timedelta(days = i)),random.randint(1000,25000)]` `for i in` `range((end-begin).days+1)`
`]`
`c = Calendar(init_opts=opts.InitOpts(width='1200px',height='250px'))`
`c.add('',data,calendar_opts=opts.CalendarOpts(range_=2017))`
`c.set_global_opts(title_opts = opts.TitleOpts(title='日历图'),`
` visualmap_opts = opts.VisualMapOpts(`
` max_=25000,`
` min_=500,`
` orient='horizontal',`
` is_piecewise=True,`
` pos_top='230px',`
` pos_left='100px'))`
`c.render_notebook()` `#渲染到Jupyter Notebook中`
`c.render("calendar_chart.html")` `#在pycharm的同级目录下生成一个html文件,用浏览器可查看`
`这段代码的作用是生成一个日历图,展示2017年每一天的数据。具体含义如下:
-
导入所需的库:`datetime`用于处理日期和时间,`random`用于生成随机数。
-
定义起始日期`begin`为2017年1月1日,结束日期`end`为2017年12月31日。
-
使用列表推导式生成一个包含日期和随机整数的二维列表`data`。每个元素是一个包含 日期字符串和随机整数(范围在1000到25000之间)的列表。
-
创建一个`Calendar`对象`c`,并设置其宽度为1200像素,高度为250像素。
-
向`Calendar`对象`c`中添加数据,设置日历的范围为2017年。
-
设置全局选项,包括标题、视觉映射等。标题设置为"日历图",视觉映射的最大值为 25000,最小值为500,水平显示,分段显示,位置在距离顶部230像素,距离左侧 100 像素。
-
最后,使用`render_notebook()`方法将日历图渲染到Jupyter Notebook中。

begin = datetime.date(2017, 1, 1)  # 即便写成1/9,日历图都是从1月1号开始`
`end = datetime.date(2017, 12, 31)`
`data = [`
`    [str(begin + datetime.timedelta(days=i)), random.randint(1000, 25000)] for i in range((end - begin).days + 1)`
`]`

`c = (`
`    Calendar(init_opts=opts.InitOpts(width='1200px', height='250px'))  # 默认宽度下无法显示全2017年全年的数据,需要加宽`
`    .add("", data, calendar_opts=opts.CalendarOpts(range_=2017))`
`    .set_global_opts(`
`        title_opts=opts.TitleOpts(title="Calendar-2017年微信步数情况"),`
`        visualmap_opts=opts.VisualMapOpts(`
`            max_=25000,`
`            min_=500,`
`            orient="horizontal",`
`            is_piecewise=True,`
`            pos_top="230px",`
`            pos_left="100px",`
`        ),`
`    )`
`)`
`c.render_notebook()                    #渲染到Jupyter Notebook中`
`c.render("calendar_chart.html")     #在pycharm的同级目录下生成一个html文件,用浏览器可查看`
`
这段代码的目的是生成一个日历图,展示2017年微信步数的情况。首先,它定义了起始日期和结束日期,然后生成了一个包含日期和随机步数的二维列表。接着,它创建了一个Calendar对象,并设置了宽度、高度、标题等选项。最后,它将日历图渲染到Jupyter Notebook中,并在同级目录下生成一个HTML文件,可以用浏览器查看。

#Funnel:漏斗图
import os`
`os.chdir(r'C:\Users\ThinkPad\Desktop')from pyecharts.charts import Funnel`
`import json`
`with open('funnel.json',encoding='utf-8') as f:`
` data = json.load(f)`
`data_ful = [(i['action'],i['pv']) for i in data['data']]`
`c = Funnel()`
`c.add('商品',data_ful)`
`c.set_global_opts(title_opts=opts.TitleOpts(title='Funnel'))`
`c.render_notebook() #渲染到Jupyter Notebook中`
`c.render("calendar_chart.html") #在pycharm的同级目录下生成一个html文件,用浏览器可查看`
`使用pyecharts库创建一个漏斗图,并将其渲染到Jupyter Notebook中以及生成一个HTML文件。具体步骤如下:
-
导入所需的库:os、pyecharts.charts中的Funnel和json。
-
os.chdir(r'C:\Users\ThinkPad\Desktop')
更改当前工作目录到指定路径(C:\Users\ThinkPad\Desktop)。
-
从名为'funnel.json'的文件中读取数据,并将其解析为JSON格式。
-
从解析后的数据中提取出动作(action)和访问量(pv),并将它们组合成一个列表data_ful。
-
创建一个Funnel对象c。
-
向Funnel对象c中添加数据,设置图表标题为"Funnel"。
-
将Funnel对象c渲染到Jupyter Notebook中。
-
将Funnel对象c渲染为一个名为"calendar_chart.html"的HTML文件,该文件可以在浏览器中查看。
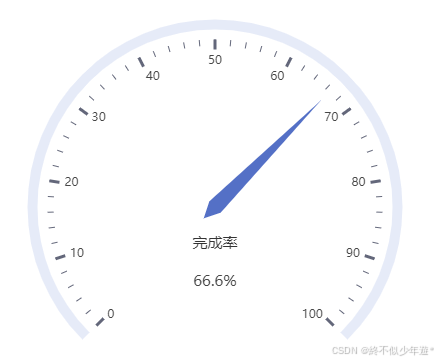
使用仪表盘展现项目完成进度
from pyecharts.charts import Gauge`
`c = Gauge()`
`c.add("", [("完成率", 66.6)])`
`c.render_notebook()                    #渲染到Jupyter Notebook中`
`c.render("calendar_chart.html")     #在pycharm的同级目录下生成一个html文件,用浏览器可查看`
`
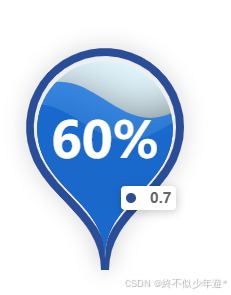
使用水球图展现项目进度
from pyecharts.charts import Liquid`
`c = Liquid()`
`c.add('',[0.6,0.7],is_animation=False,shape='pin')`
`c.render_notebook()                    #渲染到Jupyter Notebook中`
`c.render("calendar_chart.html")     #在pycharm的同级目录下生成一个html文件,用浏览器可查看`
`
from pyecharts import options as opts`
`from pyecharts.charts import Liquid, Page`
`from pyecharts.globals import SymbolType`

`c = (`
`    Liquid()`
`    .add("lq", [0.6, 0.7])`
`    .set_global_opts(title_opts=opts.TitleOpts(title="Liquid-基本示例"))`
`)`

`c.render_notebook()                    #渲染到Jupyter Notebook中`
`c.render("calendar_chart.html")     #在pycharm的同级目录下生成一个html文件,用浏览器可查看`
`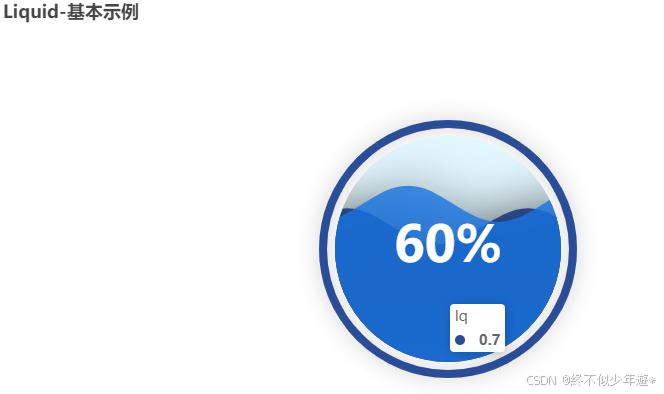
使用pyecharts库创建一个Liquid图表,并将其渲染到Jupyter Notebook中以及生成一个HTML文件。下面是逐行讲解:
-
`from pyecharts.charts import Liquid`: 从pyecharts库中导入Liquid类,用于创建液体图。
-
`c = Liquid()`: 创建一个Liquid对象实例。
-
`c.add('',[0.6,0.7],is_animation=False,shape='pin')`: 向Liquid对象添加数据,设置动画为关闭(is_animation=False),形状为'pin'。这里的数据是一个包含两个数值的列表,分别表示液体图的两个值。
-
`c.render_notebook()`: 将Liquid图表渲染到Jupyter Notebook中。
-
`from pyecharts import options as opts`: 从pyecharts库中导入options模块,用于设置图表的全局选项。
-
`from pyecharts.charts import Liquid, Page`: 从pyecharts库中导入Liquid和Page类,用于创建液体图和页面。
-
`from pyecharts.globals import SymbolType`: 从pyecharts库中导入SymbolType模块,用于设置图表中的符号类型。
-
`c = (Liquid().add("lq", [0.6, 0.7]).set_global_opts(title_opts=opts.TitleOpts(title="Liquid-基本示例")))`: 创建一个Liquid对象实例,并添加数据、设置标题选项。
-
`c.render_notebook()`: 将Liquid图表渲染到Jupyter Notebook中。
-
`c.render("calendar_chart.html")`: 将Liquid图表渲染为一个名为"calendar_chart.html"的HTML文件,该文件可以在浏览器中查看。
使用关系图展现不同节点关系
with open('Graph.json', 'r', encoding='utf-8') as f:`
`    data = json.load(f)`
`- `with open('Graph.json', 'r', encoding='utf-8') as f:`:打开名为'Graph.json'的文件,以只读模式('r')和指定的编码格式('utf-8')读取文件内容。
nodes = data['nodes']`
`links = []`
`for i in nodes:`
`    for j in nodes:`
`        links.append({'source':i.get('name'),'target':j.get('name')})`
`from pyecharts.charts import Graph`
`c = Graph()`
`c.add('',nodes,links,repulsion=8000)`
`c.render_notebook()                    #渲染到Jupyter Notebook中`
`c.render("calendar_chart.html")     #在pycharm的同级目录下生成一个html文件,用浏览器可查看`
`-
`data = json.load(f)`:使用json模块的load方法将文件内容解析为Python字典。
-
`nodes = data['nodes']`:从解析后的字典中获取键为'nodes'的值,并将其赋值给变量nodes。
-
`links = []`:创建一个空列表links,用于存储节点之间的连接关系。
-
`for i in nodes:`:遍历nodes列表中的每个元素i。
-
`for j in nodes:`:再次遍历nodes列表中的每个元素j。
-
`links.append({'source':i.get('name'),'target':j.get('name')})`:将两个节点i和j的名称作为源节点和目标节点添加到links列表中。
-
`from pyecharts.charts import Graph`:导入pyecharts库中的Graph类,用于创建图表。
-
`c = Graph()`:创建一个Graph对象实例。
-
`c.add('',nodes,links,repulsion=8000)`:向图表中添加节点和连接关系,设置节点之间的斥力为8000。
-
`c.render_notebook()`:在Jupyter Notebook中渲染图表。
nodes = data['nodes']`
`links = []`
`for i in nodes:`
`    for j in nodes:`
`        links.append({"source": i.get("name"), "target": j.get("name")})`
`c = (`
`    Graph()`
`    .add("", nodes, links, repulsion=8000)`
`    .set_global_opts(title_opts=opts.TitleOpts(title="Graph-基本示例"))`
`)`
`c.render_notebook()                    #渲染到Jupyter Notebook中`
`c.render("calendar_chart.html")     #在pycharm的同级目录下生成一个html文件,用浏览器可查看`
`-
`nodes = data['nodes']`:重新获取nodes列表。
-
`links = []`:重新创建一个空列表links。
-
`for i in nodes:`:遍历nodes列表中的每个元素i。
-
`for j in nodes:`:再次遍历nodes列表中的每个元素j。
-
`links.append({"source": i.get("name"), "target": j.get("name")})`:将两个节点i和j的名称作为源节点和目标节点添加到links列表中。
-
`c = (Graph().add("", nodes, links, repulsion=8000).set_global_opts(title_opts=opts.TitleOpts(title="Graph-基本示例")))`:创建一个Graph对象实例,并向其中添加节点和连接关系,设置节点之间的斥力为8000,同时设置图表的标题为"Graph-基本示例"。
-
`c.render_notebook()`:在Jupyter Notebook中渲染图表。
-
`c.render("calendar_chart.html")`:将图表渲染为一个名为"calendar_chart.html"的HTML文件,该文件可以在浏览器中查看。
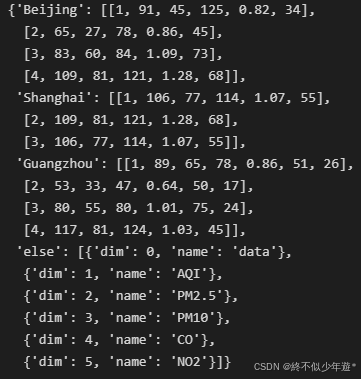
使用平行坐标轴展现不同日期的PM值
import json`
`with open('Parallel.json', 'r') as f:`
`    data = json.load(f)`
`-
`import json`:导入json模块,用于处理json格式的数据。
-
`with open('Parallel.json', 'r') as f:`:以只读模式打开名为'Parallel.json'的文件,并将其内容赋值给变量f。
-
`data = json.load(f)`:使用json模块的load方法将文件内容解析为Python字典,并将其赋值给变量data。
data #jupyter notebook 中可执行`
`
from pyecharts.charts import Parallel`
`c = Parallel()`
`c.add_schema(data['else'])`
`c.add('beijing',data['Beijing'])`
`c.add('shanghai',data['Shanghai'])`
`c.add('guangzhou',data['Guangzhou'])`
`c.render_notebook()                    #渲染到Jupyter Notebook中`
`c.render("calendar_chart.html")     #在pycharm的同级目录下生成一个html文件,用浏览器可查看`
`-
`from pyecharts.charts import Parallel`:从pyecharts库中导入Parallel类,用于创建平行坐标图。
-
`c = Parallel()`:创建一个Parallel对象实例,命名为c。
-
`c.add_schema(data['else'])`:向Parallel对象添加一个schema,schema是从data字典中获取的键为'else'的值。
-
`c.add('beijing',data['Beijing'])`:向Parallel对象添加一个名为'beijing'的数据系列,数据来源于data字典中键为'Beijing'的值。
-
`c.add('shanghai',data['Shanghai'])`:向Parallel对象添加一个名为'shanghai'的数据系列,数据来源于data字典中键为'Shanghai'的值。
-
`c.add('guangzhou',data['Guangzhou'])`:向Parallel对象添加一个名为'guangzhou'的数据系列,数据来源于data字典中键为'Guangzhou'的值。
-
`c.render_notebook()`:在Jupyter Notebook中渲染Parallel对象。
-
`c.render("calendar_chart.html")`:将Parallel对象渲染为一个名为"calendar_chart.html"的HTML文件,该文件可以在浏览器中查看。
from pyecharts import options as opts`
`from pyecharts.charts import Page, Parallel`

`c = (`
`    Parallel()`
`    .add_schema(data['else'])`
`    .add("Beijing", data["Beijing"])`
`    .add("Shanghai", data["Shanghai"])`
`    .add("Guangzhou", data["Guangzhou"])`
`    .set_global_opts(title_opts=opts.TitleOpts(title="Parallel-基本示例"))`
`)`
`c.render_notebook()                    #渲染到Jupyter Notebook中`
`c.render("calendar_chart.html")     #在pycharm的同级目录下生成一个html文件,用浏览器可查看`
`-
`from pyecharts import options as opts`:从pyecharts库中导入options模块,并将其重命名为opts。
-
`from pyecharts.charts import Page, Parallel`:从pyecharts库中导入Page和Parallel类。
-
`c = (Parallel().add_schema(data['else']).add("Beijing", data["Beijing"]).add("Shanghai", data["Shanghai"]).add("Guangzhou", data["Guangzhou"]).set_global_opts(title_opts=opts.TitleOpts(title="Parallel-基本示例")))`:创建一个Parallel对象实例,并向其添加schema、数据系列以及设置全局选项(标题)。
-
`c.render_notebook()`:在Jupyter Notebook中渲染Parallel对象。
-
`c.render("calendar_chart.html")`:将Parallel对象渲染为一个名为"calendar_chart.html"的HTML文件,该文件可以在浏览器中查看。
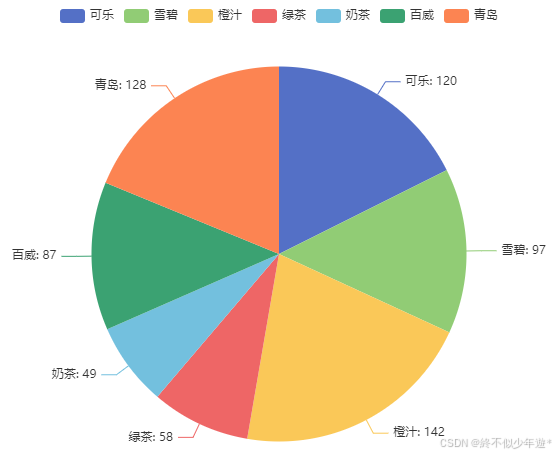
使用饼状图统计饮料售卖情况
from pyecharts.faker import Faker`
`Faker.drinks`        `#模块内置的一个数据样本`
`Faker.values()`
`from pyecharts.charts import Pie`
`c = Pie()`
`c.add('',[list(z) for  z in zip(Faker.drinks,Faker.values())])`
`c.set_series_opts(label_opts=opts.LabelOpts(formatter='{b}: {c}'))`
`c.render_notebook()                    #渲染到Jupyter Notebook中`
`c.render("calendar_chart.html")     #在pycharm的同级目录下生成一个html文件,用浏览器可查看`
`
-
`from pyecharts.faker import Faker`:从pyecharts库中导入Faker模块,用于生成一些内置的数据样本。
-
`Faker.drinks`:获取Faker模块内置的饮料数据样本。
-
`Faker.values()`:获取Faker模块内置的一些数值数据样本。
-
`from pyecharts.charts import Pie`:从pyecharts库中导入Pie类,用于创建饼图。
-
`c = Pie()`:创建一个Pie对象实例,命名为c。
-
`c.add('',[list(z) for z in zip(Faker.drinks,Faker.values())])`:向饼图c中添加数据,数据来源于Faker模块中的饮料和数值数据样本,将它们组合成一个列表,并添加到饼图中。
-
`c.set_series_opts(label_opts=opts.LabelOpts(formatter='{b}: {c}'))`:设置饼图的标签选项,使用格式化字符串'{b}: {c}'来显示每个扇区的标签,其中{b}表示类别名称,{c}表示该类别的值。
-
`c.render_notebook()`:在Jupyter Notebook中渲染饼图。
-
`c.render("calendar_chart.html")`:将饼图渲染为一个名为"calendar_chart.html"的HTML文件,该文件可以在浏览器中查看。
from pyecharts.faker import Faker`
`from pyecharts.charts import Pie`

`c = (`
`    Pie()`
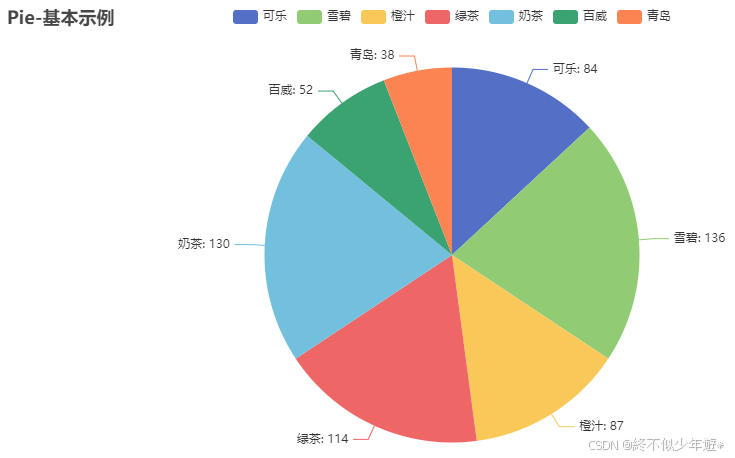
`    .add("", [list(z) for z in zip(Faker.drinks, Faker.values())])`
`    .set_global_opts(title_opts=opts.TitleOpts(title="Pie-基本示例"))`
`    .set_series_opts(label_opts=opts.LabelOpts(formatter="{b}: {c}"))`
`)`
`c.render_notebook()                    #渲染到Jupyter Notebook中`
`c.render("calendar_chart.html")     #在pycharm的同级目录下生成一个html文件,用浏览器可查看`
`
-
`from pyecharts.faker import Faker`:从pyecharts库中导入Faker模块,用于生成一些内置的数据样本。
-
`from pyecharts.charts import Pie`:从pyecharts库中导入Pie类,用于创建饼图。
-
`c = (Pie())`:创建一个Pie对象实例,命名为c。
-
`.add("", [list(z) for z in zip(Faker.drinks, Faker.values())])`:向饼图c中添加数据,数据来源于Faker模块中的饮料和数值数据样本,将它们组合成一个列表,并添加到饼图中。
-
`.set_global_opts(title_opts=opts.TitleOpts(title="Pie-基本示例"))`:设置饼图的全局选项,包括标题。
-
`.set_series_opts(label_opts=opts.LabelOpts(formatter="{b}: {c}"))`:设置饼图的系列选项,包括标签格式。
-
`c.render_notebook()`:在Jupyter Notebook中渲染饼图。
-
`c.render("calendar_chart.html")`:将饼图渲染为一个名为"calendar_chart.html"的HTML文件,该文件可以在浏览器中查看。
使用极坐标展现客户价值分析结果
import numpy as np`
`from pyecharts.charts import Radar`
`data = np.load('radar.npy')`
`-
导入numpy库,用于处理数组数据;
-
导入pyecharts库中的Radar模块,用于绘制雷达图;
-
使用numpy的load方法加载名为'radar.npy'的文件,将其内容存储在变量data中;
c = Radar()`
`c.add_schema(schema=[opts.RadarIndicatorItem(name=m,max_=n,min_ = k) for m ,n ,k in zip(list('LRFMC'),`
`                                                                                        data.max(axis = 0),`
`                                                                                        data.min(axis = 0))])`
`cols = ['#FF6EB4', '#FA8072', '#EECFA1', '#CDB5CD', '#B03060']`
`for i , j in enumerate(cols):`
`    c.add('客户群'+str(i),[[float(y) for y in data[i]]],`
`         areastyle_opts=opts.AreaStyleOpts(opacity=0.3,color=j),`
`         label_opts=opts.LabelOpts(is_show=False))`
`c.render_notebook()                    #渲染到Jupyter Notebook中`
`c.render("calendar_chart.html")     #在pycharm的同级目录下生成一个html文件,用浏览器可查看`
`-
创建一个Radar对象c;
-
为雷达图添加schema,设置各个指标的名称、最大值和最小值;
-
定义一个颜色列表cols;
-
遍历颜色列表,为每个客户群添加数据点,并设置区域样式和标签选项;
-
将雷达图渲染到Jupyter Notebook中;
-
将雷达图渲染为一个名为"calendar_chart.html"的HTML文件,以便在浏览器中查看;
cols`
`
c = (`
`    Radar()`
`    .add_schema(schema=[opts.RadarIndicatorItem(name=m, max_=n, min_=k) for m, n, k in zip(list('LRFMC'),`
`                                                                                           data.max(axis=0), `
`                                                                                           data.min(axis=0))])`
`    .set_global_opts(title_opts=opts.TitleOpts(title="Radar-基本示例"))`
`)`

`for i, j in enumerate(cols):`
`    c = (c.add('客户群'+str(i), [[float(y) for y in data[i]]], `
`               areastyle_opts=opts.AreaStyleOpts(opacity=0.3, color=j),  # 区域填充样式配置项`
`               label_opts=opts.LabelOpts(is_show=False, formatter={'color':cols}))  # 标签配置项`
`        )`

`c.render_notebook()`
`-
创建一个新的Radar对象c,并为其添加schema;
-
设置全局选项,如标题;
-
遍历颜色列表,为每个客户群添加数据点,并设置区域样式和标签选项;
13.将雷达图渲染到Jupyter Notebook中。
使用桑葚图展现不同种类的迁移
import json`
`with open('./sankey.json', 'r') as f:`
`    data = json.load(f)`
`data`
`- `import json`:导入json模块,用于处理JSON数据。
2.`with open('./sankey.json', 'r') as f:`:使用`with`语句打开名为'sankey.json'的文件,以只读模式('r')打开。
3.`data = json.load(f)`:使用`json.load()`函数从文件中读取JSON数据,并将其存储在变量`data`中。
from pyecharts import options as opts`
`from pyecharts.charts import Sankey`

`c = (`
`    Sankey()`
`    .add(`
`        "sankey",`
`        data['nodes'],`
`        data['links'],`
`        linestyle_opt=opts.LineStyleOpts(opacity=0.2, curve=0.5, color="source"),`
`        label_opts=opts.LabelOpts(position="right"),`
`    )`
`    .set_global_opts(title_opts=opts.TitleOpts(title="Sankey-基本示例"))`
`)`
`c.render_notebook()`
`-
`from pyecharts import options as opts`:从pyecharts库中导入options模块,并将其重命名为opts。
-
`from pyecharts.charts import Sankey`:从pyecharts.charts模块中导入Sankey类。
-
`c = (`:创建一个Sankey对象实例,并将其赋值给变量`c`。
-
`Sankey()`:调用Sankey类的构造函数创建一个新的Sankey对象。
-
`.add(`:调用Sankey对象的`add`方法,用于添加数据和配置选项。
-
`"sankey"`:为该Sankey图设置一个名称。
-
`data['nodes']`:从`data`字典中获取节点数据。
-
`data['links']`:从`data`字典中获取链接数据。
-
`linestyle_opt=opts.LineStyleOpts(opacity=0.2, curve=0.5, color="source")`:设置线条样式选项,包括透明度、曲线和颜色。
-
`label_opts=opts.LabelOpts(position="right")`:设置标签选项,将标签位置设置为右侧。
-
`)`:结束`add`方法的参数列表。
-
`.set_global_opts(title_opts=opts.TitleOpts(title="Sankey-基本示例"))`:设置全局选项,包括标题。
-
`c.render_notebook()`:将Sankey图渲染到Jupyter Notebook中。
##实现主题河流图
import json`
`with open('./ThemeRiver.json', 'r') as f:`
`    data = json.load(f)`
`-
`import json`:导入Python的json模块,用于处理JSON数据。
-
`with open('./ThemeRiver.json', 'r') as f:`:使用`with`语句打开名为'ThemeRiver.json'的文件,以只读模式('r')打开,并将文件对象赋值给变量`f`。
-
`data = json.load(f)`:使用`json.load()`函数从文件对象`f`中读取JSON数据,并将其存储在变量`data`中。
from pyecharts import options as opts`
`from pyecharts.charts import ThemeRiver`

`c = (`
`    ThemeRiver()`
`    .add(`
`        data['names'],`
`        data['data'],`
`        singleaxis_opts=opts.SingleAxisOpts(type_="time", pos_bottom="10%"),`
`    )`
`    .set_global_opts(title_opts=opts.TitleOpts(title="ThemeRiver-基本示例"))`
`)`
`c.render_notebook()`
`-
`from pyecharts import options as opts`:从pyecharts库中导入options模块,并将其重命名为opts。
-
`from pyecharts.charts import ThemeRiver`:从pyecharts.charts模块中导入ThemeRiver类。
-
`c = (`:创建一个ThemeRiver对象实例,并将其赋值给变量`c`。
-
`ThemeRiver()`:调用ThemeRiver类的构造函数创建一个新的ThemeRiver对象。
-
`.add(`:调用ThemeRiver对象的`add`方法,用于添加数据和配置选项。
-
`data['names'],`:从`data`字典中获取键为'names'的值,作为主题河流的名称。
-
`data['data'],`:从`data`字典中获取键为'data'的值,作为主题河流的数据。
-
`singleaxis_opts=opts.SingleAxisOpts(type_="time", pos_bottom="10%"),`:设置单轴选项,将类型设置为时间轴,位置底部设置为10%。
-
`)`:结束`add`方法的参数列表。
-
`.set_global_opts(title_opts=opts.TitleOpts(title="ThemeRiver-基本示例"))`:设置全局选项,包括标题选项,将标题设置为"ThemeRiver-基本示例"。
-
`)`:结束ThemeRiver对象的初始化。(12行)
-
`c.render_notebook()`:将主题河流图表渲染到Jupyter Notebook中。
使用词云图展现文本分类结果
import json`
`from pyecharts.charts import  WordCloud`
`with open('WordCloud.json', 'r') as f:`
`    data = json.load(f)`
`data['words']`
`c = WordCloud()`
`c.add('',data['words'])`
`c.render()`
`
需要有对应文件WordCloud.json
pyecharts绘制直角坐标系图表
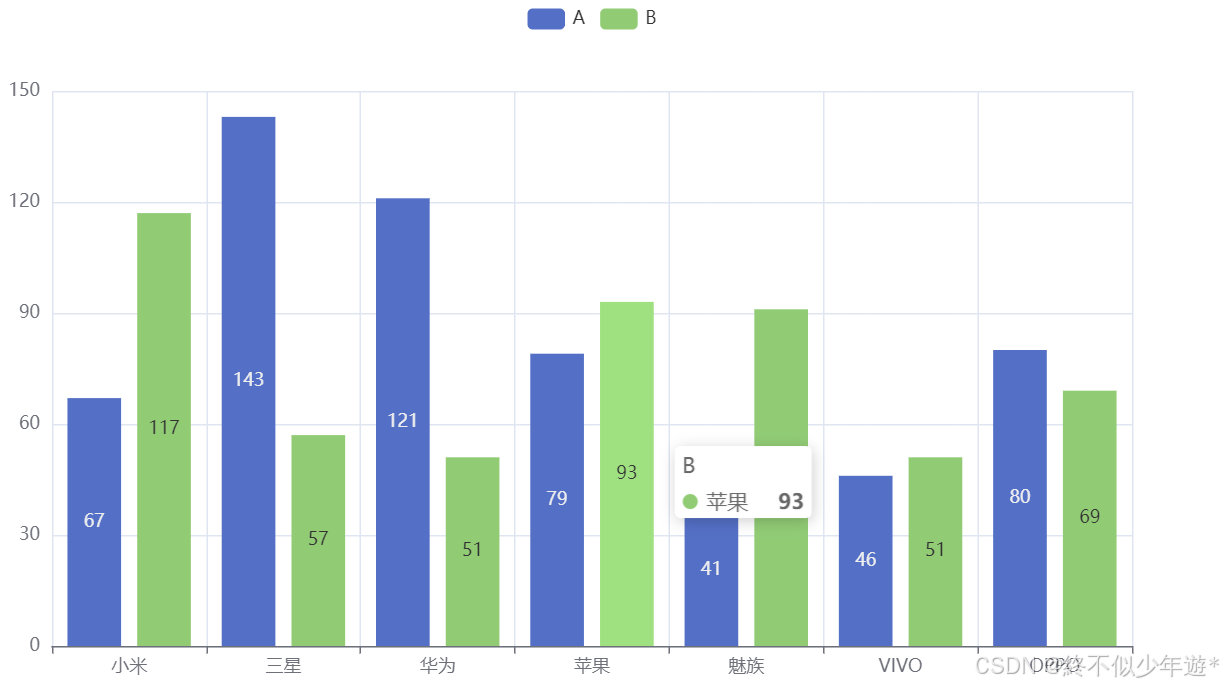
##使用条形图查看手机售卖情况
# Bar:柱状图/条形图`
`from pyecharts.faker import Faker`
`from pyecharts.charts import Bar`
`Faker.phones`
`Faker.values()`
`c = Bar()`
`c.add_xaxis(Faker.phones)`
`c.add_yaxis('A',Faker.values())`
`c.add_yaxis('B',Faker.values())`
`c.render_notebook()                    #渲染到Jupyter Notebook中`
`c.render("calendar_chart.html")     #在pycharm的同级目录下生成一个html文件,用浏览器可查看`
`
from pyecharts import options as opts`
`c = (`
`    Bar()`
`    .add_xaxis(Faker.phones)`
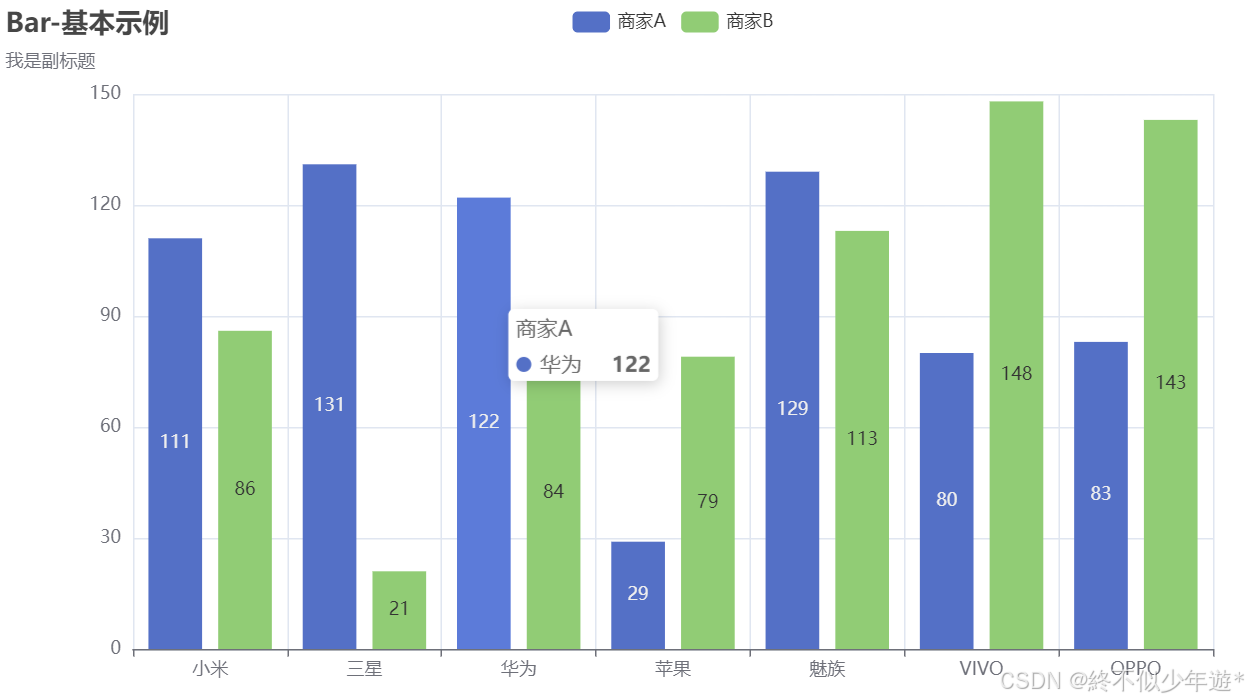
`    .add_yaxis("商家A", Faker.values())`
`    .add_yaxis("商家B", Faker.values())`
`    .set_global_opts(title_opts=opts.TitleOpts(title="Bar-基本示例", subtitle="我是副标题"))`
`)`
`c.render_notebook()`
`c.render("calendar_chart.html")     #在pycharm的同级目录下生成一个html文件,用浏览器可查看`
`
pyecharts绘制树形图表
##使用树图展现不同类型的归属
from pyecharts import options as opts`
`from pyecharts.charts import Tree`
`import json`

`with open('Tree.json', 'r') as f:`
`    data = json.load(f)`

`data['data']`
`c = Tree()`
`c.add('',data['data'])`
`c.render_notebook()`
`-
导入pyecharts库中的options模块和Tree类。
-
从文件'Tree.json'中读取数据,并将其存储在变量data中。
-
创建一个Tree对象c。
-
使用add方法将data['data']添加到Tree对象c中。
-
使用render_notebook方法在Jupyter Notebook中渲染树状图。
c = (`
`    Tree()`
`    .add("", data['data'])`
`    .set_global_opts(title_opts=opts.TitleOpts(title="Tree-基本示例"))`
`)`
`c.render_notebook()`
`
##使用矩形树图展现不同属性的归属
from pyecharts import options as opts`
`from pyecharts.charts import TreeMap`
`import json`
`with open('TreeMap.json','r') as f:`
`    data = json.load(f)`

`c = (`
`    TreeMap()`
`    .add("演示数据", data['data'])`
`    .set_global_opts(title_opts=opts.TitleOpts(title="TreeMap-基本示例"))`
`)`
`c.render_notebook()`
`c.render("calendar_chart.html")     #在pycharm的同级目录下生成一个html文件,用浏览器可查看`
`-
导入pyecharts库中的options模块和Tree类。
-
从文件'Tree.json'中读取数据,并将其存储在变量data中。
-
创建一个Tree对象c。
-
使用add方法将data['data']添加到Tree对象c中。
-
使用render_notebook方法在Jupyter Notebook中渲染树状图。
-
创建一个新的Tree对象c,并使用add方法添加数据。
-
设置全局选项,包括标题。
-
再次使用render_notebook方法在Jupyter Notebook中渲染树状图。
-
导入pyecharts库中的options模块和TreeMap类。
-
从文件'TreeMap.json'中读取数据,并将其存储在变量data中。
-
创建一个TreeMap对象c。
-
使用add方法将data['data']添加到TreeMap对象c中。
-
设置全局选项,包括标题。
-
使用render_notebook方法在Jupyter Notebook中渲染树状图。
-
使用render方法将树状图保存为名为"calendar_chart.html"的HTML文件。
pyecharts绘制地理图表
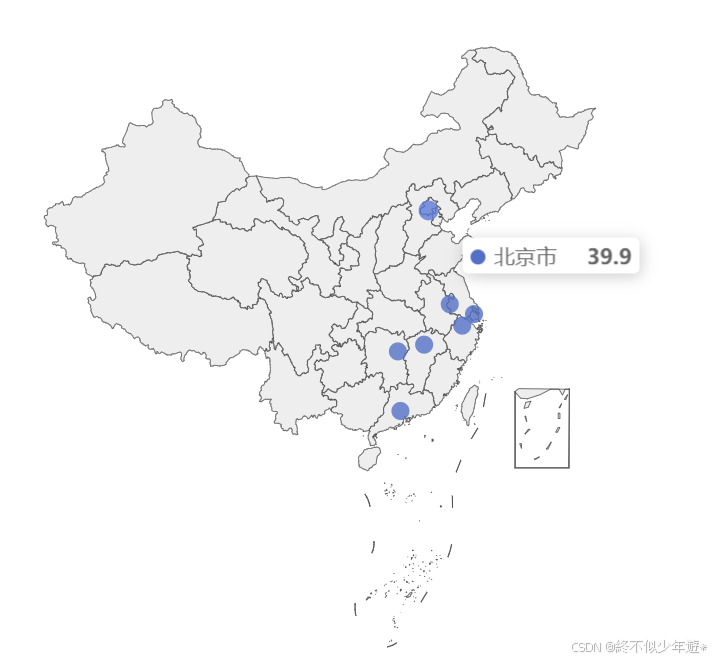
##绘制地理散点图
from pyecharts.charts import Geo`
`from pyecharts.faker import Faker`
`import pyecharts.options as opts`
`data_map = [(i,j) for i ,j in zip(Faker.provinces,Faker.values())]`
`c = Geo()`
`c.add_schema(maptype='china')`
`c.add('',data_map)`
`c.render_notebook()`
`c.render("calendar_chart.html")     #在pycharm的同级目录下生成一个html文件,用浏览器可查看`
`
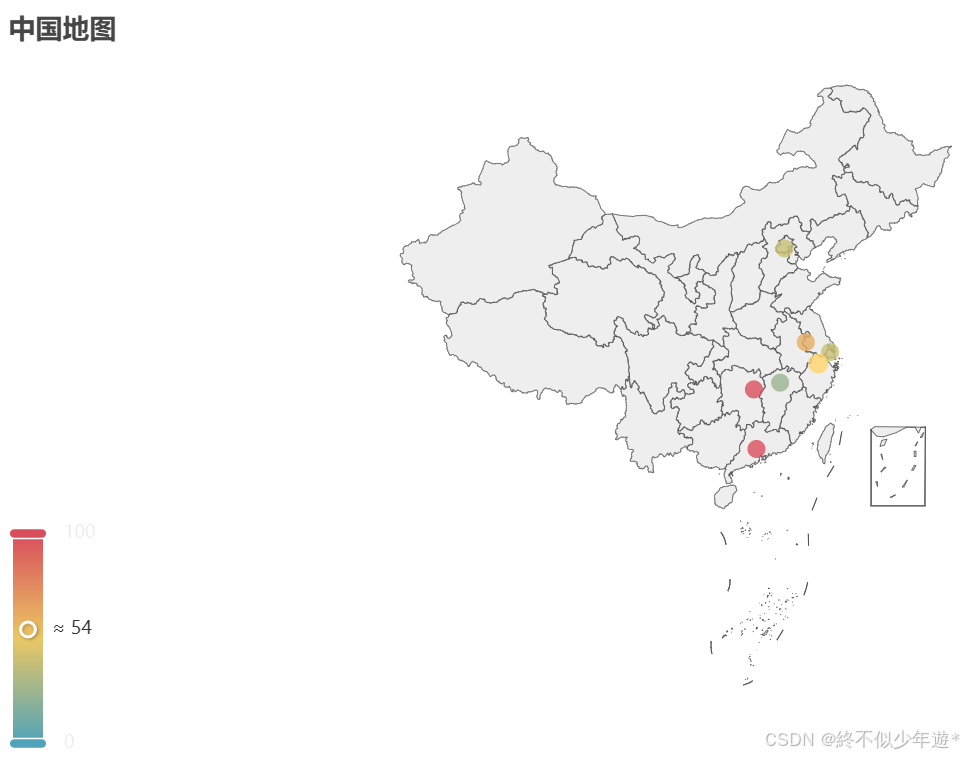
(`
`    Geo()`
`    .add_schema(maptype='china')`
`    .add(series_name='', data_pair=[(i, j) for i, j in zip(Faker.provinces, Faker.values())])`
`    .set_global_opts(`
`        title_opts=opts.TitleOpts(title='中国地图'),`
`        visualmap_opts=opts.VisualMapOpts(`
`#             is_piecewise=True`
`        )`
`    )`
`).render("calendar_chart.html")` `#.render_notebook()`
`
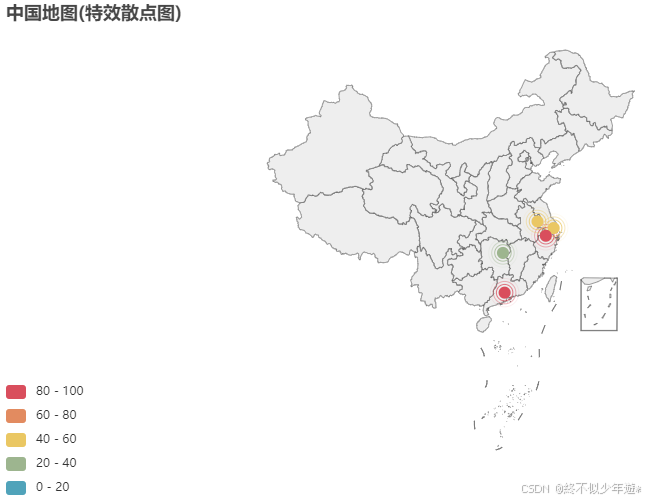
##绘制地理特效散点图
from pyecharts.charts import Geo`
`import pyecharts.options as opts`
`from pyecharts.globals import ChartType`
`from pyecharts.faker import Faker`
`# from example.commons import Faker`

`(`
`    Geo()`
`    .add_schema(maptype='china')`
`    .add(series_name='', data_pair=[(i, j) for i, j in zip(Faker.provinces, Faker.values())],`
`        type_=ChartType.EFFECT_SCATTER)`
`    .set_global_opts(`
`        title_opts=opts.TitleOpts(title='中国地图(特效散点图)'),`
`        visualmap_opts=opts.VisualMapOpts(`
`            is_piecewise=True`
`        )`
`    )`
`).render("calendar_chart.html") #.render_notebook()`
`
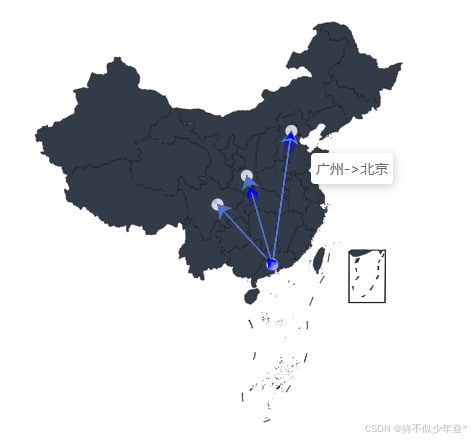
##绘制地理迁移图
from pyecharts.charts import Geo`
`from pyecharts.globals import ChartType, SymbolType`
`import pyecharts.options as opts`

`city_num = [('广州', 105), ('成都', 70), ('北京', 99), ('西安', 80)]`
`start_end = [('广州', '成都'), ('广州', '北京'), ('广州', '西安')]`


`(`
`    Geo()`
`    .add_schema(maptype='china', `
`                itemstyle_opts=opts.ItemStyleOpts(color='#323c48', border_color='#111'))`
`    .add('', data_pair=city_num, color='white')`
`    .add('', data_pair=start_end, type_=ChartType.LINES,`
`         effect_opts=opts.EffectOpts(symbol=SymbolType.ARROW, `
`                                     color='blue', `
`                                     symbol_size=8))`
`).render("calendar_chart.html") #.render_notebook()`
`
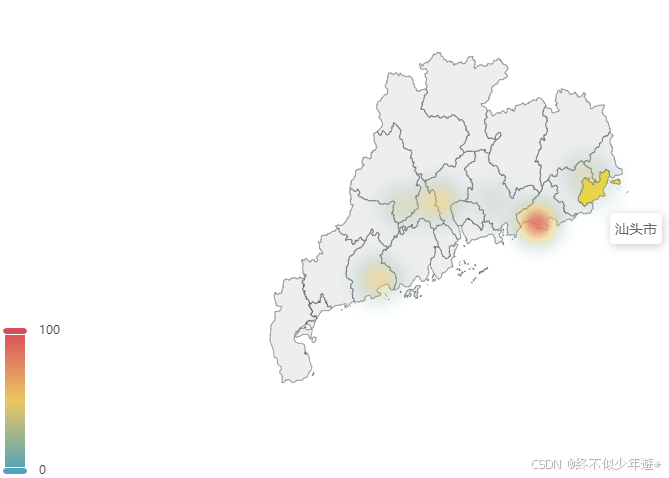
##绘制地理热力图
from pyecharts.charts import Geo`
`import pyecharts.options as opts`
`from pyecharts.globals import ChartType`
`from pyecharts.faker import Faker`

`(`
`    Geo()`
`    .add_schema(maptype='广东')`
`    .add(series_name='', data_pair=[(i, j) for i, j in zip(Faker.guangdong_city, Faker.values())],`
`         type_=ChartType.HEATMAP)`
`    .set_global_opts(visualmap_opts=opts.VisualMapOpts())`
`).render("calendar_chart.html") #.render_notebook()`
`
##绘制地理区域图
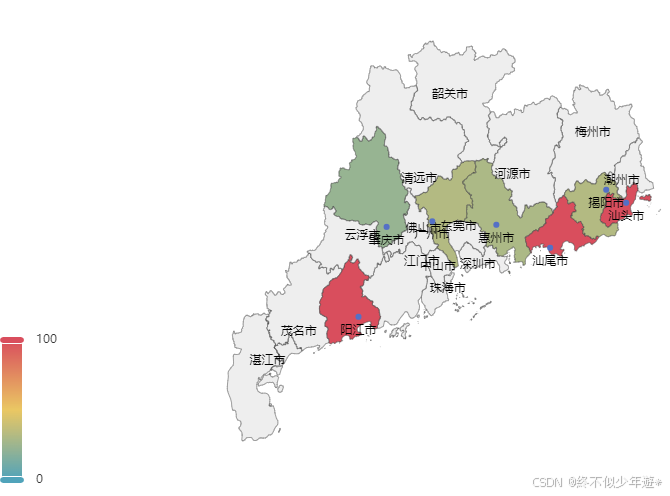
from pyecharts.charts import Map`
`import pyecharts.options as opts`
`from pyecharts.faker import Faker`

`(`
`    Map()`
`    .add('', [(i, j) for i, j in zip(Faker.guangdong_city, Faker.values())], '广东')`
`    .set_global_opts(visualmap_opts=opts.VisualMapOpts())`
`).render("calendar_chart.html") #.render_notebook()`
`
pyecharts绘制3D图表
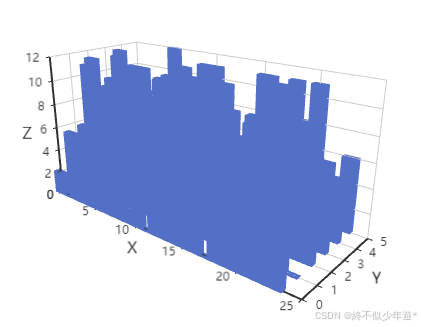
from pyecharts.charts import Bar3D`
`import random`

`data = [(i, j, random.randint(0, 12)) for i in range(6) for j in range(24)]`
`print(data)`
`c = Bar3D()`
`c.add('',[[d[1],d[0],d[2]] for d in data])`

`c.render_notebook()`
`c.render("calendar_chart.html") #.render_notebook()`
`
-
导入pyecharts库中的Bar3D模块,用于创建3D柱状图。
-
导入random库,用于生成随机数。
-
创建一个名为data的列表,其中包含6个元素(0到5)和24个元素(0到23),每个元素是一个三元组,第三个元素是一个0到12之间的随机整数。
-
打印data列表。
-
创建一个Bar3D对象c。
-
使用add方法向Bar3D对象c中添加数据,数据格式为:[(j, i, d[2]) for d in data],即将原始数据的第二个元素作为x轴,第一个元素作为y轴,第三个元素作为z轴的高度。
-
使用render_notebook方法在Jupyter Notebook中渲染3D柱状图。
-
使用render方法将3D柱状图保存为名为"calendar_chart.html"的HTML文件。
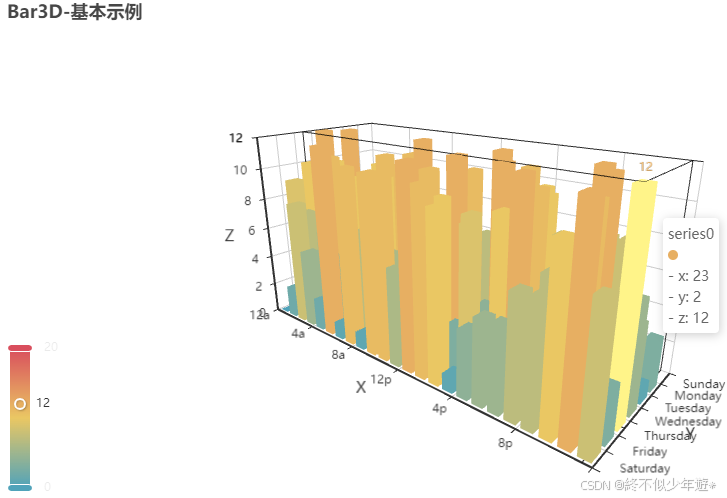
from pyecharts.charts import Bar3D`
`import pyecharts.options as opts`
`from pyecharts.faker import Faker`
`import random`

`data =` `[(i, j, random.randint(0,` `12))` `for i in` `range(6)` `for j in` `range(24)]`

`c =` `(`
`    Bar3D()`
    `.add(`
        `"",`
        `[[d[1], d[0], d[2]]` `for d in data],`
`        xaxis3d_opts=opts.Axis3DOpts(Faker.clock, type_="category"),`
`        yaxis3d_opts=opts.Axis3DOpts(Faker.week_en, type_="category"),`
`        zaxis3d_opts=opts.Axis3DOpts(type_="value"),`
    `)`
    `.set_global_opts(`
`        visualmap_opts=opts.VisualMapOpts(max_=20),`
`        title_opts=opts.TitleOpts(title="Bar3D-基本示例"),`
    `)`
`)`
`c.render("calendar_chart.html")` `#.render_notebook()`
`
-
创建一个Bar3D对象,命名为c。
-
使用add方法向Bar3D对象c中添加数据,数据格式为:[(d[1], d[0], d[2]) for d in data],即将原始数据的第二个元素作为x轴,第一个元素作为y轴,第三个元素作为z轴的高度。
-
设置x轴的选项,使用Faker库的clock函数生成类别轴标签,类型为"category"。
-
设置y轴的选项,使用Faker库的week_en函数生成类别轴标签,类型为"category"。
-
设置z轴的选项,类型为"value"。
-
使用set_global_opts方法设置全局选项,包括视觉映射的最大值为20,以及图表标题为"Bar3D-基本示例"。
-
使用render方法将图表渲染为名为"calendar_chart.html"的HTML文件。