基于 Python 的天气数据分析与可视化
1. 项目背景
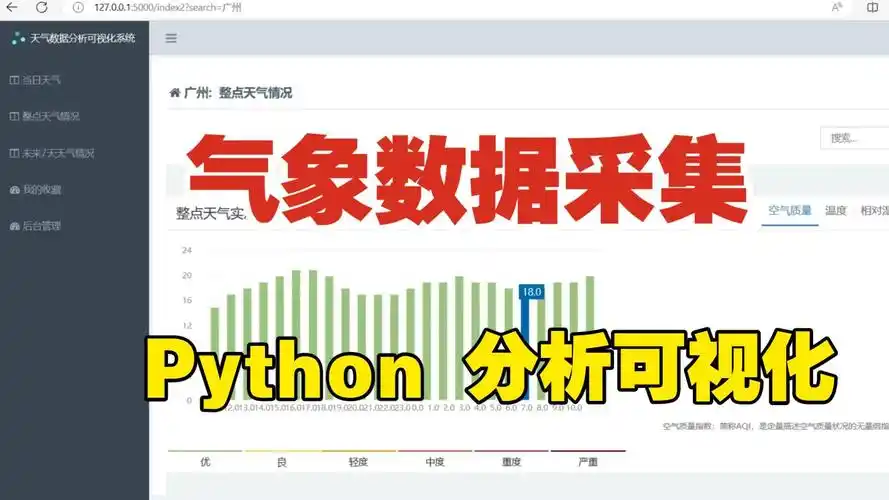
天气数据分析与可视化项目旨在通过爬取天气数据并进行分析,生成可视化图表,帮助用户了解天气变化趋势。通过该项目,学生可以掌握 Python 的数据爬取、数据分析和可视化技能。该项目适用于气象研究、农业规划、旅游出行等领域。
2. 功能需求
- 数据爬取:从天气网站爬取历史天气数据。
- 数据分析:分析温度、降水等数据的变化趋势。
- 数据可视化:使用 Matplotlib 生成折线图、柱状图等可视化图表。
3. 技术选型
- 编程语言:Python
- 数据爬取:Requests、BeautifulSoup
- 数据分析:Pandas
- 数据可视化:Matplotlib
4. 系统设计
4.1 数据来源
- 从公开的天气网站(如中国天气网)爬取历史天气数据。
- 数据字段包括日期、温度、降水量等。
4.2 功能模块
- 数据爬取模块:从网站爬取天气数据并存储到本地。
- 数据分析模块:对温度、降水量等数据进行分析。
- 数据可视化模块:生成折线图、柱状图等可视化图表。
5. 核心代码实现
python
import requests
from bs4 import BeautifulSoup
import pandas as pd
import matplotlib.pyplot as plt

# 爬取天气数据
def fetch_weather_data(city, year, month):
    # 模拟请求(实际项目中需替换为真实 URL)
    url = f"https://www.example.com/weather/{city}/{year}-{month}"
    response = requests.get(url)
    soup = BeautifulSoup(response.text, 'html.parser')

    # 解析数据
    weather_data = []
    for row in soup.find_all('tr'):
        cols = row.find_all('td')
        if len(cols) > 0:
            date = cols[0].text.strip()
            temperature = cols[1].text.strip()
            precipitation = cols[2].text.strip()
            weather_data.append([date, temperature, precipitation])

    # 转换为 DataFrame
    df = pd.DataFrame(weather_data, columns=["日期", "温度", "降水量"])
    df["温度"] = df["温度"].str.replace("℃", "").astype(float)
    df["降水量"] = df["降水量"].str.replace("mm", "").astype(float)
    return df

# 数据可视化
def plot_weather_data(df):
    plt.figure(figsize=(10, 6))

    # 绘制温度折线图
    plt.plot(df["日期"], df["温度"], label="温度 (℃)", marker='o', color='red')

    # 绘制降水量柱状图
    plt.bar(df["日期"], df["降水量"], label="降水量 (mm)", alpha=0.5, color='blue')

    # 设置图表属性
    plt.xlabel("日期")
    plt.ylabel("值")
    plt.title(f"{city} {year}年{month}月天气数据可视化")
    plt.legend()
    plt.grid(True)
    plt.xticks(rotation=45)
    plt.tight_layout()
    plt.show()

# 主程序
if __name__ == "__main__":
    # 设置城市、年份和月份
    city = "beijing"
    year = "2023"
    month = "10"

    # 爬取天气数据
    weather_df = fetch_weather_data(city, year, month)
    print("爬取的天气数据:")
    print(weather_df)

    # 数据可视化
    plot_weather_data(weather_df)
6. 运行效果
- 数据爬取 :
- 从天气网站爬取指定城市、年份和月份的天气数据。
- 数据存储到 Pandas DataFrame 中,字段包括日期、温度和降水量。
- 数据可视化 :
- 使用 Matplotlib 生成温度折线图和降水量柱状图。
- 图表标题为"北京 2023年10月天气数据可视化"。
- 横轴为日期,纵轴为温度和降水量。
7. 总结
通过本项目的开发,我们实现了一个简单的天气数据分析与可视化系统,涵盖了数据爬取、数据分析和数据可视化等功能。Python 的丰富库(如 Requests、Pandas 和 Matplotlib)使得该项目易于实现和扩展。未来可以进一步优化系统,例如:
- 支持更多城市和更长时间范围的天气数据。
- 添加更多的数据分析功能(如平均值、最大值、最小值等)。
- 开发交互式可视化工具(如使用 Plotly)。
希望这篇文章能为你的毕业设计提供帮助!如果需要更多功能或优化建议,可以随时告诉我!😊
如果你有其他需求或想法,欢迎继续交流!