1 prometheus的PQL查询
1.1 Metrics数据介绍
- prometheus监控中采集过来的数据统一称为Metrics数据,其并不是代表具体的数据格式,而是一种统计度量计算单位
- 当需要为某个系统或者某个服务做监控时,就需要使用到 metrics
prometheus支持的metrics包括但不限于以下几种数据类型:
- guage:最简单的度量指标,只是一个简单的返回值,或者叫瞬时状态。比如说统计硬盘,内存等使用情况
- counter:就是一个计数器,从数据量0开始累积计算,在理想情况下,只能是永远的增长,不会降低。比如统计1小时,1天,1周,1一个月的用户访问量,这就是一个累加的操作
- histograms (直方图):是统计数据的分布情况,比如最小值,最大值,中间值,中位数等,代表的是一种近似百分比估算数值。通过histograms可以分别统计处在一个时间段(1s,2s,5s,10s)内nginx访问用户的响应时间
- summary (摘要):summary是histograms的扩展类型,主要弥补histograms不足
- Info:Info 类型用于记录服务或系统的静态信息,通常包括版本、构建时间、主机名等。这种类型的指标是常用的元数据
- Event(事件):事件类型用于记录系统中发生的特定事件。它们通常表示一次性的事件,而非持续的度量。例如:表示系统启动、重要错误、任务完成等事件
- Rate(速率):速率是用来表示某个计数器在一定时间窗口内的变化速率。Prometheus 提供了 rate() 函数来计算每秒的增量
- Latency(延迟)::延迟通过 Histogram 或 Summary 类型来记录,表示某个操作的延迟分布
1.2 简单的PQL示例
参考链接:https://prometheus.io/docs/prometheus/latest/querying/functions/
bash
1 查看某个特定的key
node_cpu_seconds_total

2 查看某个节点的指标
node_cpu_seconds_total{instance="10.0.0.41:9100"}

3 查看某个节点的某刻CPU的某种状态
node_cpu_seconds_total{instance="10.0.0.41:9100",cpu="0",mode="idle"}

4 查询最近10s内某个节点CPU的某种状态时间
node_cpu_seconds_total{instance="10.0.0.41:9100",cpu="0",mode="idle"}[10s]

5 统计1分钟内,使用标签过滤器查看"10.0.0.42:9100"节点的第0颗CPU,非空闲状态使用的总时间
node_cpu_seconds_total{mode!="idle",cpu="0", instance="10.0.0.42:9100"}[1m]

6 统计1分钟内,使用标签过滤器查看"10.0.0.42:9100"节点的第0颗CPU,mode名称以字母"i"开头的所有CPU核心
node_cpu_seconds_total{mode=~"i.*",cpu="0", instance="10.0.0.42:9100"}[1m]

7 统计1分钟内,使用标签过滤器查看"10.0.0.42:9100"节点的第0颗CPU,mode名称不是以字母"i"开头的所有CPU核心
node_cpu_seconds_total{mode!~"i.*",cpu="0", instance="10.0.0.42:9100"}[1m1.查看某个节点的某刻CPU的空闲状态,输入:node_cpu_seconds_total{instance="10.0.0.41:9100",cpu="0",mode="idle"}


2.当然也可以查询所有的指标:node_cpu_seconds_total{instance="10.0.0.41:9100"}

3.若要获取更多的CPU指标,可以使用 !=
bash
node_cpu_seconds_total{instance="10.0.0.41:9100",cpu="0",mode != 'irq'}
1.3 prometheus常用的函数
参考链接:https://prometheus.io/docs/prometheus/latest/querying/functions/
bash
1 increase
increase函数:
	用来针对counter数据类型,截取其中一段时间总的增量。

举个例子:
	increase(node_cpu_seconds_total{mode="idle",cpu="0", instance="10.0.0.42:9100"}[1m])
		统计1分钟内,使用标签过滤器查看"10.0.0.42:9100"节点的第0颗CPU,空闲状态使用的总时间增量。

	2 sum
sum函数:
	加和的作用。

举个例子:
 sum(increase(node_cpu_seconds_total{mode="idle",cpu="0"}[1m]))
		统计1分钟内,使用标签过滤器查看所有节点的第0颗CPU,空闲状态使用的总时间增量,并将返回结果累加。

	3 by
by函数:
	将数据进行分组,类似于MySQL的"GROUP BY"。

举个例子:
	sum(increase(node_cpu_seconds_total{mode="idle"}[1m])) by (instance)
		统计1分钟内,使用标签过滤器查看CPU空闲状态,并将结果进行累加,基于instance进行分组。

	4 rate
rate函数:
	它的功能是按照设置的时间段,取counter在这个时间段中平均每秒的增量。

举个例子:
	rate(node_cpu_seconds_total{mode="idle",cpu="0", instance="10.0.0.42:9100"}[1m])
		统计1分钟内,使用标签过滤器查看"10.0.0.42:9100"节点的第0颗CPU,空闲状态使用的每秒的增量。
increase和rate如何选择:
	(1)对于采集数据频率较低的场景建议使用increase函数,因为使用rate函数可能会出现断点,比如针对硬盘容量监控。
	(2)对于采集数据频率较高的场景建议使用rate函数,比如针对CPU,内存,网络流量等都是可以基于rate函数来采集等。

	5 topk
topk函数:
	取前几位的最高值,实际使用的时候一般会用该函数进行瞬时报警,而不是为了观察曲线图。
举个例子:
	topk(3, rate(node_cpu_seconds_total{mode="idle"}[1m]))
		统计1分钟内,使用标签过滤器查看CPU,所有状态使用的每秒的增量,只查看前3个节点。


	6 count
count函数:
	把数值符合条件的,输出数目进行累加加和。
	比如说企业中有100台服务器,如果只有10台服务器CPU使用率高于80%时候是不需要报警的,但是数量操作70台时就需要报警了。

举个例子:
	count(zhiyong18_tcp_wait_conn > 500):
		假设zhiyong18_tcp_wait_conn是咱们自定义的KEY。
		若TCP等待数量大于500的机器数量就判断条件为真。

	count(rate(node_cpu_seconds_total{cpu="0",mode="idle"}[1m]))
		对统计的结果进行计数。
1.4 PQL查询案例
bash
监控CPU的使用情况案例
	1 统计各个节点CPU的使用率
		1.1 我们需要先找到CPU相关的KEY
node_cpu_seconds_total

		1.2 过滤出CPU的空闲时间({mode='idle'})和全部CPU的时间('{}')
node_cpu_seconds_total{mode='idle'}
	过滤CPU的空闲时间。

node_cpu_seconds_total{}
	此处的'{}'可以不写,因为里面没有任何参数,代表获取CPU的所有状态时间。

		1.3 统计1分钟内CPU的增量时间
increase(node_cpu_seconds_total{mode='idle'}[1m])
	统计1分钟内CPU空闲状态的增量。

increase(node_cpu_seconds_total[1m])
	统计1分钟内CPU所有状态的增量。

		1.4 将结果进行加和统计
sum(increase(node_cpu_seconds_total{mode='idle'}[1m]))
	将1分钟内所有CPU空闲时间的增量进行加和计算。

sum(increase(node_cpu_seconds_total[1m]))
	将1分钟内所有CPU空闲时间的增量进行加和计算。

		1.5 按照不同节点进行分组
sum(increase(node_cpu_seconds_total{mode='idle'}[1m])) by (instance)
	将1分钟内所有CPU空闲时间的增量进行加和计算,并按照机器实例进行分组。

sum(increase(node_cpu_seconds_total[1m])) by (instance)
	将1分钟内所有CPU空闲时间的增量进行加和计算,并按照机器实例进行分组。

		1.6 计算1分钟内CPU空闲时间的百分比
sum(increase(node_cpu_seconds_total{mode='idle'}[1m])) by (instance) / sum(increase(node_cpu_seconds_total[1m])) by (instance)

		1.7 统计1分钟内CPU的使用率,计算公式: (1 - CPU空闲时间的百分比) * 100%。
(1 - sum(increase(node_cpu_seconds_total{mode='idle'}[1m])) by (instance) / sum(increase(node_cpu_seconds_total[1m])) by (instance)) * 100

		1.7 统计1小时内CPU的使用率,计算公式: (1 - CPU空闲时间的百分比) * 100%。
(1 - sum(increase(node_cpu_seconds_total{mode='idle'}[1h])) by (instance) / sum(increase(node_cpu_seconds_total[1h])) by (instance)) * 100

2 计算CPU用户态的1分钟内百分比
sum(increase(node_cpu_seconds_total{mode='user'}[1m])) by (instance) / sum(increase(node_cpu_seconds_total[1m])) by (instance) * 100

3 计算CPU内核态的1分钟内百分比
(sum(increase(node_cpu_seconds_total{mode='system'}[1m])) by (instance) / sum(increase(node_cpu_seconds_total[1m])) by (instance)) * 100

4 计算CPU IO等待时间的1分钟内百分比
(sum(increase(node_cpu_seconds_total{mode='iowait'}[1m])) by (instance) / sum(increase(node_cpu_seconds_total[1m])) by (instance)) * 100
2 grafna展示监控数据
2.1 安装grafana
很明显,对于Prometheus的PromQL语法不太适合新手,可以使用别人写的好的为自己所用即可。比如使用grafana导入的方式监控Linux的常用指标
1.安装 grafana
dpkg install 这个包
修改配置文件设置为中文
bash
grep -in 'default_language' /etc/grafana/grafana.ini

470:default_language = zh-Hans
启动 grafana:systemctl enable grafana-server.service --now
2.访问 grafana 的webUI:http://10.0.0.31:3000/

2.2 配置grafana数据源
以配置 prometheus 数据源为例


https://grafana.com/grafana/dashboards/


3 prometheus监控各种中间件
zookeeper
01 开启zookeeper监控指标
1.首先搭建zookeeper集群,略
2.修改zookeeper集群的配置文件(大约在30行),开启监控指标。elk92和elk93操作相同
bash
[root@elk91 ~]# vim /zhiyong18/softwares/apache-zookeeper-3.8.4-bin/conf/zoo.cfg
...
# https://prometheus.io Metrics Exporter
metricsProvider.className=org.apache.zookeeper.metrics.prometheus.PrometheusMetricsProvider
metricsProvider.httpHost=0.0.0.0
metricsProvider.httpPort=7000
metricsProvider.exportJvmInfo=true
...
[root@elk91 ~]# systemctl restart zk
测试zookeeper集群是否正常
bash
[root@elk91~]# for i in `seq 91 93`; do echo stat | nc 10.0.0.$i 2181 | grep Mode;done
Mode: follower
Mode: follower
Mode: leader
3.也可以访问zookeeper的webUI
bash
http://10.0.0.91:7000/metrics
http://10.0.0.92:7000/metrics
http://10.0.0.93:7000/metrics
02 采集zookeeper指标
1.Prometheus server配置监控zookeeper集群,只需要新建一个 job 即可。最后重载prometheus:rr
bash
[root@prometheus-server31 ~]# tail -6  /zhiyong18/softwares/prometheus-2.53.2.linux-amd64/prometheus.yml
  - job_name: zhiyong18-zhiyong-zookeeper
    static_configs:
    - targets:
      - 10.0.0.91:7000
      - 10.0.0.92:7000
- 10.0.0.93:70002.访问Prometheus的WebUI进行验证:http://10.0.0.31:9090/targets

5.grafana导入模板:10465
获取grafana官方模版:https://grafana.com/grafana/dashboards/
kafka
bash
1.启动kafka集群
[root@elk91 ~]# kafka-server-start.sh -daemon $KAFKA_HOME/config/server.properties
[root@elk92 ~]# kafka-server-start.sh -daemon $KAFKA_HOME/config/server.properties
[root@elk93 ~]# kafka-server-start.sh -daemon $KAFKA_HOME/config/server.properties

2.验证kafka服务是否正常
[root@elk91 ~]# zkCli.sh ls /zhiyong18-kafka371/brokers/ids  | grep "^\["
[91, 92, 93]

3.下载kafka的exporter
wget https://github.com/danielqsj/kafka_exporter/releases/download/v1.7.0/kafka_exporter-1.7.0.linux-amd64.tar.gz

4.启动kafka的exporter
[root@elk91 ~]# tar xf  kafka_exporter-1.7.0.linux-amd64.tar.gz -C /usr/local/bin/ kafka_exporter-1.7.0.linux-amd64/kafka_exporter  --strip-components=1
[root@elk91 ~]#
[root@elk91 ~]# ll /usr/local/bin/
total 18876
drwxr-xr-x  2 root root     4096 Aug 16 11:03 ./
drwxr-xr-x 10 root root     4096 Aug 10  2023 ../
-rwxr-xr-x  1 1001  123 19317972 May 24  2023 kafka_exporter*
[root@elk91 ~]#
[root@elk91 ~]# kafka_exporter --web.listen-address=":9308" --web.telemetry-path="/metrics"  --kafka.version="3.7.1" --kafka.server=10.0.0.93:9092

5.访问测试kafka的exporter页面
http://10.0.0.91:9308/metrics

6.Prometheus配置监控kafka的exporter
[root@prometheus-server31 ~]# vim /zhiyong18/softwares/prometheus-2.53.2.linux-amd64/prometheus.yml
...
  - job_name: zhiyong18-zhiyong-kafka
    static_configs:
    - targets:
      - 10.0.0.91:9308

7.查看Prometheus的WebUI是否监控到目标
http://10.0.0.31:9090/targets

8.grafana出图展示
12460

9.测试验证准确信
9.1 创建topic
[root@elk93 ~]# kafka-topics.sh --bootstrap-server 10.0.0.91:9092 --create --topic xixi --partitions 3
Created topic xixi.
[root@elk93 ~]#

9.2 启动消费者
[root@elk92 ~]# kafka-console-consumer.sh --bootstrap-server 10.0.0.91:9092  --topic xixi

9.3 启动生产者
[root@elk93 ~]# kafka-console-producer.sh --bootstrap-server 10.0.0.91:9092  --topic xixi
ES
bash
2.解压软件包
[root@elk91 ~]# tar xf elasticsearch_exporter-1.7.0.linux-amd64.tar.gz
[root@elk91 ~]#
[root@elk91 ~]# cd elasticsearch_exporter-1.7.0.linux-amd64/
[root@elk91 elasticsearch_exporter-1.7.0.linux-amd64]#
[root@elk91 elasticsearch_exporter-1.7.0.linux-amd64]# ll
total 12844
drwxr-xr-x 2 1001 1002     4096 Dec 22  2023 ./
drwx------ 9 root root     4096 Aug 16 10:25 ../
-rw-r--r-- 1 1001 1002     7010 Dec 22  2023 CHANGELOG.md
-rw-r--r-- 1 1001 1002    49644 Dec 22  2023 dashboard.json
-rw-r--r-- 1 1001 1002     1805 Dec 22  2023 deployment.yml
-rwxr-xr-x 1 1001 1002 13017088 Dec 22  2023 elasticsearch_exporter*
-rw-r--r-- 1 1001 1002      979 Dec 22  2023 elasticsearch.rules
-rw-r--r-- 1 1001 1002    11357 Dec 22  2023 LICENSE
-rw-r--r-- 1 1001 1002    41096 Dec 22  2023 README.md
[root@elk91 elasticsearch_exporter-1.7.0.linux-amd64]#
[root@elk91 elasticsearch_exporter-1.7.0.linux-amd64]#


	3.启动测试
[root@elk91 elasticsearch_exporter-1.7.0.linux-amd64]# ./elasticsearch_exporter --es.uri="http://elastic:123456@10.0.0.93:9200" --web.listen-address=:9114 --web.telemetry-path="/metrics"


	4.Prometheus server监控es的exporter
[root@prometheus-server31 ~]# vim /zhiyong18/softwares/prometheus-2.53.2.linux-amd64/prometheus.yml
...

  - job_name: zhiyong18-zhiyong-elasticsearch
    static_configs:
    - targets:
      - 10.0.0.91:9114

[root@prometheus-server31 ~]#
[root@prometheus-server31 ~]# check
Checking /zhiyong18/softwares/prometheus-2.53.2.linux-amd64/prometheus.yml
 SUCCESS: /zhiyong18/softwares/prometheus-2.53.2.linux-amd64/prometheus.yml is valid prometheus config file syntax

[root@prometheus-server31 ~]#
[root@prometheus-server31 ~]# rr
[root@prometheus-server31 ~]#

	5.查看Prometheus的WebUI是否监控到目标
http://10.0.0.31:9090/targets


	6.grafana出图展示
14191
jenkins
1.jenkins安装插件

2.验证Jenkins的metrics组件是否生效
http://10.0.0.211:8080/prometheus/
bash
4.修改Prometheus的配置文件
[root@prometheus-server31 ~]# vim /zhiyong18/softwares/prometheus-2.53.2.linux-amd64/prometheus.yml
...
  - job_name: zhiyong18-zhiyong-jenkins
    metrics_path: /prometheus
    static_configs:
    - targets:
      - 10.0.0.211:8080
...
[root@prometheus-server31 ~]#
[root@prometheus-server31 ~]# check
Checking /zhiyong18/softwares/prometheus-2.53.2.linux-amd64/prometheus.yml
 SUCCESS: /zhiyong18/softwares/prometheus-2.53.2.linux-amd64/prometheus.yml is valid prometheus config file syntax

[root@prometheus-server31 ~]#
[root@prometheus-server31 ~]# rr
[root@prometheus-server31 ~]#


	5.访问Prometheus的WebUI
http://10.0.0.31:9090/targets

	6.导入Jenkins的相关模板
9964
9524
12646
MySQL
- ⚠️mysql的密码不使用
mysql_native_password,可能导致认证不通过,无法获取监控指标
bash
1.部署MySQL,确保mysql服务运行
[root@jenkins211 ~]# docker run --name mysql-server -d \
  -e MYSQL_USER="zhiyong" \
  -e MYSQL_PASSWORD="zhiyong18" \
  -e MYSQL_ALLOW_EMPTY_PASSWORD="yes" \
  --network=host \
  --restart unless-stopped \
  mysql:8.3.0-oracle \
  --character-set-server=utf8mb4 \
  --collation-server=utf8mb4_bin \
  --default-authentication-plugin=mysql_native_password

[root@jenkins211 ~]# docker ps -l
CONTAINER ID   IMAGE                COMMAND                  CREATED          STATUS          PORTS     NAMES
5db1d0101b5c   mysql:8.3.0-oracle   "docker-entrypoint.s..."   13 seconds ago   Up 13 seconds             mysql-server

[root@jenkins211 ~]# ss -ntl | grep 3306
LISTEN 0      151                *:3306             *:*
LISTEN 0      70                 *:33060            *:*

2.下载mysql exporter
wget https://github.com/prometheus/mysqld_exporter/releases/download/v0.15.1/mysqld_exporter-0.15.1.linux-amd64.tar.gz

3.安装mysql exporters
[root@jenkins211 ~]# tar xf mysqld_exporter-0.15.1.linux-amd64.tar.gz -C /usr/local/bin/ mysqld_exporter-0.15.1.linux-amd64/mysqld_exporter  --strip-components=1

[root@jenkins211 ~]# ls /usr/local/bin/
mysqld_exporter*

4.准备MySQL的链接认证文件,创建MySQL的配置,指定默认的用户名和密码
[root@jenkins211 ~]# cat  ~/.my.cnf
[client]
user=zhiyong
password=zhiyong18

5.运行mysqld-exporter
[root@jenkins211 ~]# ./mysqld_exporter --mysqld.address="10.0.0.211:3306" --web.listen-address=:9104 --config.my-cnf="/root/.my.cnf"

6.访问mysqld_exporter的webUI
http://10.0.0.211:9104/metrics

7.修改Prometheus的配置文件,添加mysql采集任务,然后重启服务
[root@prometheus-server31 ~]# vim /zhiyong18/softwares/prometheus-2.53.2.linux-amd64/prometheus.yml
...
  - job_name: zhiyong18-zhiyong-mysql
    static_configs:
    - targets:
      - 10.0.0.211:9104

8.查看Prometheus是否监控到数据
http://10.0.0.31:9090/targets

9.grafana出图展示
18949
17320
14057
redis
注意:运行容器使用host网络模式
bash
prometheus监控Redis服务
1.部署Redis
[root@jenkins211 ~]# docker run -d --name redis-server --restart always --network host  redis:7.2.5

2.下载redis-exporter
wget https://github.com/oliver006/redis_exporter/releases/download/v1.52.0/redis_exporter-v1.52.0.linux-amd64.tar.gz

3.解压软件包到PATH路径
[root@jenkins211 ~]# tar xf redis_exporter-v1.61.0.linux-amd64.tar.gz -C /usr/local/bin/ redis_exporter-v1.61.0.linux-amd64/redis_exporter --strip-components=1

[root@jenkins211 ~]# ll /usr/local/bin/
-rwxr-xr-x  1 1001 1002 15811157 Dec 12  2023 mysqld_exporter*
-rwxr-xr-x  1 root root  8290456 Jun 10 01:31 redis_exporter*

4.运行redis-exporter
[root@jenkins211 ~]# redis_exporter -web.listen-address=:9121 -web.telemetry-path=/metrics  -redis.addr=redis://10.0.0.211:6379

5.访问redis-exporter的WebUI
http://10.0.0.211:9121/metrics

6.修改Prometheus的配置文件
[root@prometheus-server31 ~]# vim /zhiyong18/softwares/prometheus-2.53.2.linux-amd64/prometheus.yml
...
  - job_name: zhiyong18-zhiyong-redis
    static_configs:
    - targets:
      - 10.0.0.211:9121

7.访问Prometheus的WebUI
http://10.0.0.31:9090/targets

8.grafana出图展示
763
14091
mongodb
参考:https://github.com/percona/mongodb_exporter
目前未验证
nginx
bash
1 编译安装nginx
		1.1 安装编译工具
CentOS:
yum -y install git wget gcc make zlib-devel gcc-c++ libtool openssl openssl-devel

Ubuntu:
apt -y install git wget gcc make zlib1g-dev build-essential libtool openssl libssl-dev


		1.2 克隆nginx-module-vts模块
git clone git://github.com/vozlt/nginx-module-vts.git


如果上述连接不好用,可以执行下面代码:
git clone https://gitee.com/jasonyin2020/nginx-module-vts.git

		1.3 下载nginx软件包
wget https://nginx.org/download/nginx-1.26.2.tar.gz

		1.4 解压nginx
tar xf nginx-1.26.2.tar.gz


		1.5 配置nginx
cd nginx-1.26.2
./configure --prefix=/zhiyong18/softwares/nginx \
  --with-http_ssl_module \
  --with-http_v2_module \
  --with-http_realip_module \
  --without-http_rewrite_module \
  --with-http_stub_status_module \
  --without-http_gzip_module  \
  --with-file-aio \
  --with-stream \
  --with-stream_ssl_module \
  --with-stream_realip_module \
  --add-module=/root/nginx-module-vts


	1.6 编译并安装nginx
make -j 2 && make install


	1.7 修改nginx的配置文件
[root@jenkins211nginx]# yy /zhiyong18/softwares/nginx/conf/nginx.conf
worker_processes  1;
events {
    worker_connections  1024;
}
http {
    include       mime.types;
    vhost_traffic_status_zone;
    upstream zhiyong18-prometheus {
       server 10.0.0.31:9090;
    }
    default_type  application/octet-stream;
    sendfile        on;
    keepalive_timeout  65;
    server {
        listen       80;
        server_name  localhost;
        location / {
            root   html;
	    proxy_pass http://zhiyong18-prometheus;
        }
        location /status {
            vhost_traffic_status_display;
            vhost_traffic_status_display_format html;
        }
        error_page   500 502 503 504  /50x.html;
        location = /50x.html {
            root   html;
        }
    }
}

	1.8 检查配置文件语法
[root@jenkins211 ~]# /zhiyong18/softwares/nginx/sbin/nginx -t
nginx: the configuration file /zhiyong18/softwares/nginx/conf/nginx.conf syntax is ok
nginx: configuration file /zhiyong18/softwares/nginx/conf/nginx.conf test is successful
[root@jenkins211 ~]#

	1.9 启动nginx
[root@jenkins211 ~]# /zhiyong18/softwares/nginx/sbin/nginx
[root@jenkins211 ~]#
[root@jenkins211 ~]# ss -ntl | grep 80
LISTEN 0      511          0.0.0.0:80        0.0.0.0:*
[root@jenkins211 ~]#

	1.10 访问nginx的状态页面
http://10.0.0.211/status/format/prometheus


	2 安装nginx-vtx-exporter
		2.1 下载nginx-vtx-exporter

wget https://github.com/hnlq715/nginx-vts-exporter/releases/download/v0.10.3/nginx-vts-exporter-0.10.3.linux-amd64.tar.gz


温馨提示:
	不建议下载更高版本,因为其会提升对GLIC的版本要求,可以通过" strings /lib64/libc.so.6 | grep GLIBC_ "查看默认是2.17版本,若使用较高版本则需要2.32+

		2.2 解压软件包到path路径
tar xf nginx-vts-exporter-0.10.3.linux-amd64.tar.gz -C /usr/local/bin/ nginx-vts-exporter-0.10.3.linux-amd64/nginx-vts-exporter --strip-components=1

	2.3 运行nginx-vtx-exporter
[root@jenkins211 ~]# nginx-vts-exporter -nginx.scrape_uri=http://10.0.0.211/status/format/json


	3 配置prometheus采集nginx数据
		3.1 修改配置文件
[root@prometheus-server31 ~]# vim /zhiyong18/softwares/prometheus-2.53.2.linux-amd64/prometheus.yml

...
scrape_configs:
  ...
  - job_name: "zhiyong18-nginx-exporter"
    metrics_path: "/status/format/prometheus"
    static_configs:
      - targets:
          - "10.0.0.211:80"

  - job_name: "zhiyong18-nginx-vts-exporter"
    static_configs:
      - targets:
          - "10.0.0.211:9913"

[root@prometheus-server31 ~]# check
Checking /zhiyong18/softwares/prometheus-2.53.2.linux-amd64/prometheus.yml
 SUCCESS: /zhiyong18/softwares/prometheus-2.53.2.linux-amd64/prometheus.yml is valid prometheus config file syntax

[root@prometheus-server31 ~]#
[root@prometheus-server31 ~]# rr
[root@prometheus-server31 ~]#

		3.2 访问Prometheus的WebUI
http://10.0.0.31:9090/targets

		3.3 导入grafana模板
2949
tomcat
bash
- prometheus监控tomcat服务
	1 基于Dockerfile构建tomcat-exporter
[root@jenkins211 ~]# git clone https://gitee.com/jasonyin2020/tomcat-exporter.git

	2.编译镜像
[root@jenkins211 ~]# cd tomcat-exporter/
[root@jenkins211 tomcat-exporter]# ll
total 44
drwxr-xr-x  5 root root 4096 Aug 16 17:00 ./
drwx------ 14 root root 4096 Aug 16 17:00 ../
-rw-r--r--  1 root root   96 Aug 16 17:00 build.sh
-rw-r--r--  1 root root  503 Aug 16 17:00 Dockerfile
drwxr-xr-x  8 root root 4096 Aug 16 17:00 .git/
drwxr-xr-x  2 root root 4096 Aug 16 17:00 libs/
-rw-r--r--  1 root root 3407 Aug 16 17:00 metrics.war
drwxr-xr-x  2 root root 4096 Aug 16 17:00 myapp/
-rw-r--r--  1 root root  191 Aug 16 17:00 README.md
-rw-r--r--  1 root root 7604 Aug 16 17:00 server.xml
[root@jenkins211 tomcat-exporter]#
[root@jenkins211 tomcat-exporter]# chmod +x build.sh
[root@jenkins211 tomcat-exporter]#
[root@jenkins211 tomcat-exporter]# ./build.sh


	3 运行tomcat镜像
[root@jenkins211 ~]# docker run -dp 18080:8080 --name tomcat-server registry.cn-hangzhou.aliyuncs.com/yinzhengjie-k8s/tomcat9-app:v1
670fa3fa723687fbdd50a0731f5611b86bfecc9dc17045423ad6829a151ca95e
[root@jenkins211 ~]#
[root@jenkins211 ~]# docker ps -l
CONTAINER ID   IMAGE                                                              COMMAND                  CREATED         STATUS        PORTS                                                             NAMES
670fa3fa7236   registry.cn-hangzhou.aliyuncs.com/yinzhengjie-k8s/tomcat9-app:v1   "/usr/local/tomcat/b..."   3 seconds ago   Up 1 second   8009/tcp, 8443/tcp, 0.0.0.0:18080->8080/tcp, :::18080->8080/tcp   tomcat-server
[root@jenkins211 ~]#

	4.访问tomcat应用
http://10.0.0.211:18080/metrics/
http://10.0.0.211:18080/myapp/

	5.配置prometheus监控tomcat应用
		5.1 修改配置文件
[root@prometheus-server31 ~]# vim /zhiyong18/softwares/prometheus-2.53.2.linux-amd64/prometheus.yml
...
scrape_configs:
  ...
  - job_name: "zhiyong18-tomcat-exporter"
    static_configs:
      - targets:
          - "10.0.0.211:18080"

[root@prometheus-server31 ~]#
[root@prometheus-server31 ~]# check
Checking /zhiyong18/softwares/prometheus-2.53.2.linux-amd64/prometheus.yml
 SUCCESS: /zhiyong18/softwares/prometheus-2.53.2.linux-amd64/prometheus.yml is valid prometheus config file syntax

[root@prometheus-server31 ~]#
[root@prometheus-server31 ~]# rr
[root@prometheus-server31 ~]#

		5.2 导入grafana模板
由于官方的支持并不友好,可以在GitHub自行搜索相应的tomcat监控模板。

参考链接:
https://github.com/nlighten/tomcat_exporter/blob/master/dashboard/example.json
docker
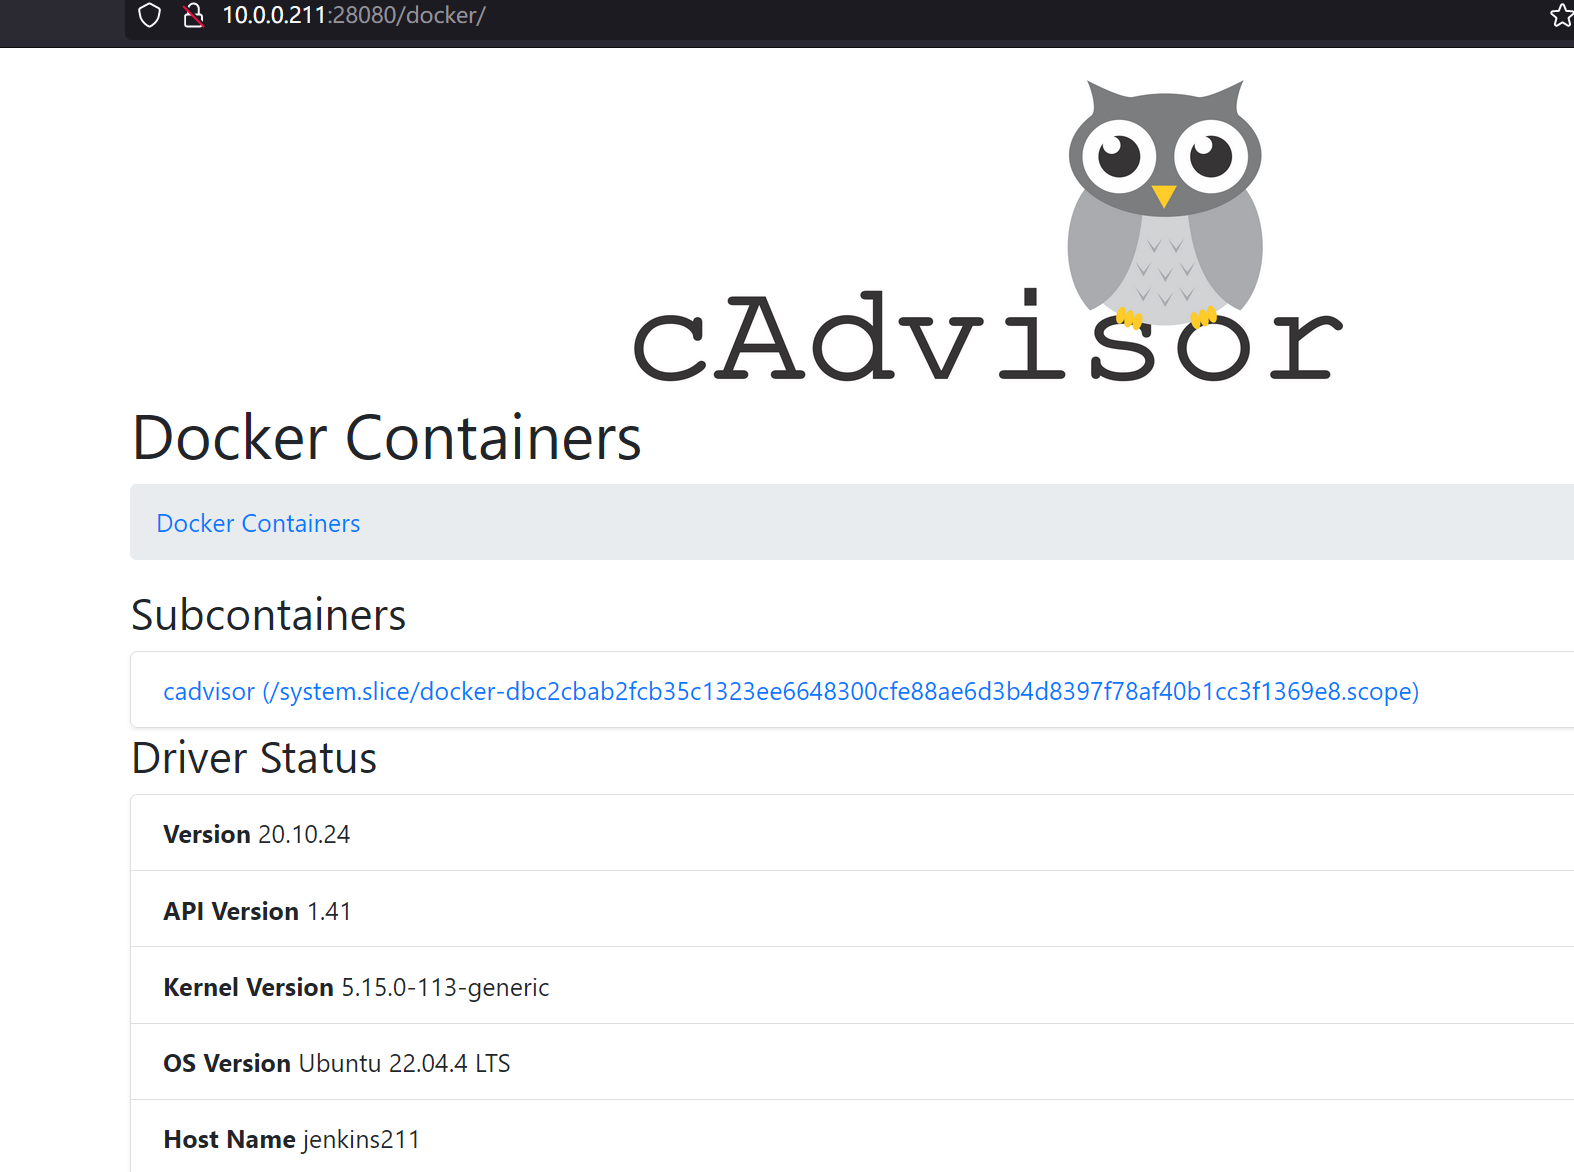
Container Advisor 是一个由 Google 开发的开源工具,主要用于容器资源监控和性能分析。
项目地址:https://github.com/google/cadvisor
1.在任意一个主机上部署,(过于老旧,参考:https://github.com/google/cadvisor/tree/v0.47.2)
bashVERSION=v0.36.0 docker run \ --volume=/:/rootfs:ro \ --volume=/var/run:/var/run:ro \ --volume=/sys:/sys:ro \ --volume=/var/lib/docker/:/var/lib/docker:ro \ --volume=/dev/disk/:/dev/disk:ro \ --publish=8080:8080 \ --detach=true \ --name=cadvisor \ --privileged \ --device=/dev/kmsg \ gcr.io/cadvisor/cadvisor:$VERSION
bash
docker run --volume=/:/rootfs:ro \
  --volume=/var/run:/var/run:rw \
  --volume=/sys:/sys:ro \
  --volume=/var/lib/docker/:/var/lib/docker:ro \
  --network host \
  --detach=true \
  --name=zhiyong18_cadvisor \
  registry.cn-hangzhou.aliyuncs.com/yinzhengjie-k8s/cadvisor:v0.47.2
也可以使用较新的版本(本次使用新版)
bash
VERSION=v0.49.1
docker run \
  -v /:/rootfs:ro \
  -v /var/run:/var/run:ro \
  -v /sys:/sys:ro \
  -v /var/lib/docker/:/var/lib/docker:ro \
  -v /dev/disk/:/dev/disk:ro \
  -p 58080:8080 \
  -d \
  --name=cadvisor \
  --privileged \
  --device=/dev/kmsg \
  gcr.io/cadvisor/cadvisor-amd64:$VERSION
--privileged将容器定义为特权容器,也就是说,让容器可以修改内核参数。当使用宿主机网络时,此选项慎用,因为可能直接将宿主机的内核参数修改掉--device将宿主机的设备添加到容器中/dev/kmsg特殊设备文件,提供了内核日志的访问接口。通过/dev/kmsg,用户空间的进程可以读取到内核产生的日志消息:内核的错误、警告、调试信息和系统事件
2.prometheus采集cAdvisor容器,增加一个采集任务
bash
  - job_name: "prometheus-zhiyong18-cAdvisor"
    static_configs:
    - targets:
      - "10.0.0.211:28080"


	5 导入grafana模板
315
10619
14282


	6 grafana的官方优化思路-对于容器出现小数的情况
针对10619模板,当容器数量增多时,如果容器出现小数点,微调即可。

Value options  --->  "Last*"
页面内容:
.47.2
也可以使用较新的版本(本次使用新版)

```bash
VERSION=v0.49.1
docker run \
  -v /:/rootfs:ro \
  -v /var/run:/var/run:ro \
  -v /sys:/sys:ro \
  -v /var/lib/docker/:/var/lib/docker:ro \
  -v /dev/disk/:/dev/disk:ro \
  -p 58080:8080 \
  -d \
  --name=cadvisor \
  --privileged \
  --device=/dev/kmsg \
  gcr.io/cadvisor/cadvisor-amd64:$VERSION
--privileged将容器定义为特权容器,也就是说,让容器可以修改内核参数。当使用宿主机网络时,此选项慎用,因为可能直接将宿主机的内核参数修改掉--device将宿主机的设备添加到容器中/dev/kmsg特殊设备文件,提供了内核日志的访问接口。通过/dev/kmsg,用户空间的进程可以读取到内核产生的日志消息:内核的错误、警告、调试信息和系统事件
2.prometheus采集cAdvisor容器,增加一个采集任务
bash
  - job_name: "prometheus-zhiyong18-cAdvisor"
    static_configs:
    - targets:
      - "10.0.0.211:28080"


	5 导入grafana模板
315
10619
14282


	6 grafana的官方优化思路-对于容器出现小数的情况
针对10619模板,当容器数量增多时,如果容器出现小数点,微调即可。

Value options  --->  "Last*"
页面内容: