动画效果详解
-
- 一、D3.js动画核心API
-
- [1. d3.transition()](#1. d3.transition())
- [2. transition.duration()](#2. transition.duration())
- [3. transition.delay()](#3. transition.delay())
- [4. 其他重要API](#4. 其他重要API)
- 二、动画实现原理
- 三、完整动画示例解析
-
- [1. 柱状图生长动画](#1. 柱状图生长动画)
- [2. 文本跟随动画](#2. 文本跟随动画)
- 四、动画效果优化技巧
-
- [1. 缓动函数选择:](#1. 缓动函数选择:)
- [2. 组合动画:](#2. 组合动画:)
- [3. 动画事件监听:](#3. 动画事件监听:)
- [4. 性能优化:](#4. 性能优化:)
- 五、进阶动画技术
-
- [1. 自定义插值器](#1. 自定义插值器)
- [2. 路径动画](#2. 路径动画)
- [3. 交错动画](#3. 交错动画)
- 六、注意事项小结
- 小结
- 下章预告:交互式操作
在数据可视化中,动画效果不仅能增强视觉吸引力,还能帮助观众更好地理解数据变化过程。本章将详细介绍如何使用D3.js为图表添加流畅的动画效果。
一、D3.js动画核心API
1. d3.transition()
这是D3动画系统的基础,用于创建一个过渡效果。它会返回一个过渡对象,可以在该对象上链式调用其他过渡方法。
js
d3.selectAll("rect")
  .transition() // 开始过渡
  .attr("width", 100); // 目标属性值
2. transition.duration()
设置动画持续时间(毫秒)。持续时间越长,动画越慢。
js
.duration(1000) // 1秒动画3. transition.delay()
设置动画延迟时间(毫秒)。可以为每个元素设置不同的延迟时间。
js
.delay(function(d, i) {
  return i * 100; // 每个元素延迟100ms
})
4. 其他重要API
-
transition.ease() - 设置缓动函数(如
d3.easeLinear、d3.easeBounce等) -
transition.on() - 监听过渡事件("start"、"end"、"interrupt")
-
transition.attrTween() - 自定义属性插值器
二、动画实现原理
D3的过渡系统基于插值原理工作:
- 记录初始状态
- 指定目标状态
- 在指定时间内平滑过渡
三、完整动画示例解析
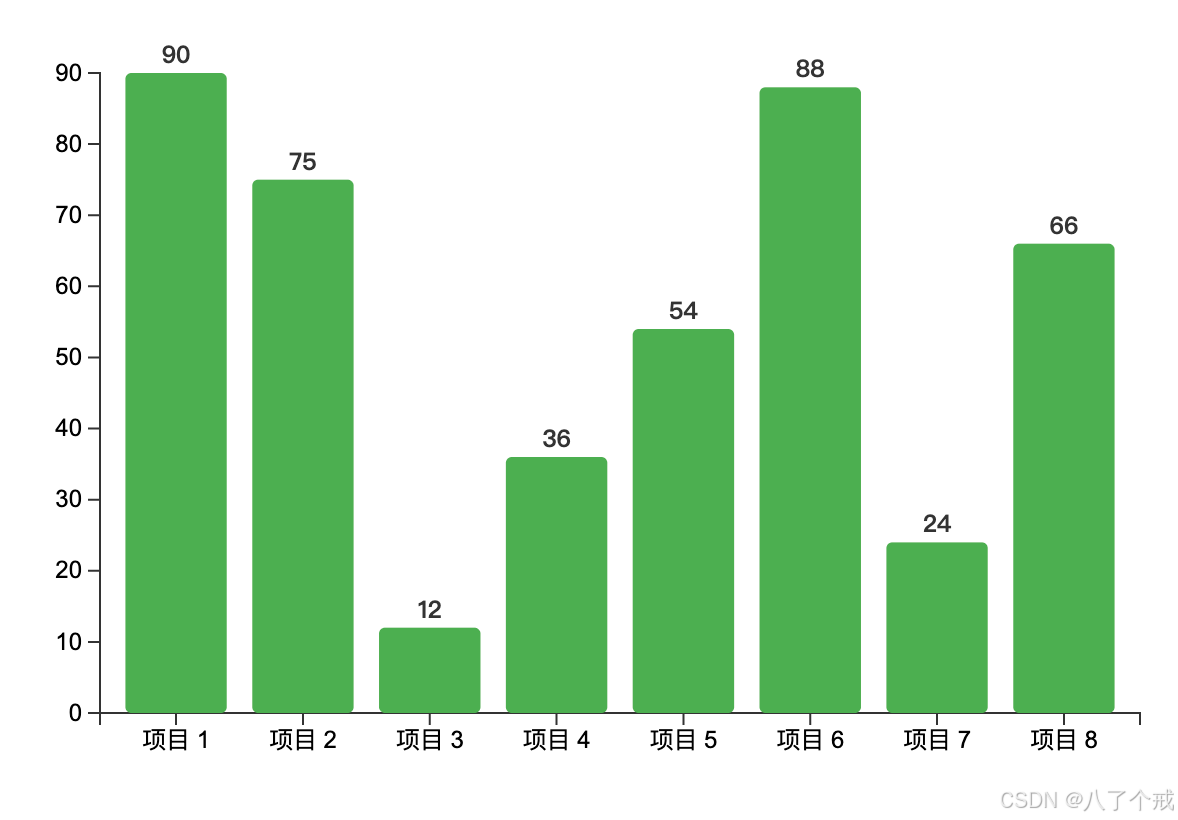
1. 柱状图生长动画
👇 完整代码:
html
<!DOCTYPE html>
<html lang="en">
<head>
    <meta charset="UTF-8">
    <title>柱状图生长动画</title>
    <script src="https://d3js.org/d3.v7.min.js"></script>
    <style>
        .bar {
            fill: #4CAF50;
            transition: fill 0.3s;
        }
        .bar:hover {
            fill: #FF5722;
        }
        .axis path,
        .axis line {
            fill: none;
            stroke: #333;
            shape-rendering: crispEdges;
        }
        .axis text {
            font-family: Arial;
            font-size: 12px;
        }
        .label {
            font-size: 12px;
            font-weight: bold;
            fill: #333;
        }
    </style>
</head>
<body>
    <svg width="600" height="400"></svg>

    <script>
        // 数据集
        const dataset = [90, 75, 12, 36, 54, 88, 24, 66];
        const margin = {top: 30, right: 30, bottom: 50, left: 50};
        const width = 600 - margin.left - margin.right;
        const height = 400 - margin.top - margin.bottom;

        // 创建SVG容器
        const svg = d3.select("svg")
            .attr("width", width + margin.left + margin.right)
            .attr("height", height + margin.top + margin.bottom)
            .append("g")
            .attr("transform", `translate(${margin.left},${margin.top})`);

        // 创建比例尺
        const xScale = d3.scaleBand()
            .domain(d3.range(dataset.length))
            .range([0, width])
            .padding(0.2);

        const yScale = d3.scaleLinear()
            .domain([0, d3.max(dataset)])
            .range([height, 0]);

        // 创建坐标轴
        const xAxis = d3.axisBottom(xScale)
            .tickFormat(d => `项目 ${+d + 1}`);

        const yAxis = d3.axisLeft(yScale);

        // 添加X轴
        svg.append("g")
            .attr("class", "axis")
            .attr("transform", `translate(0,${height})`)
            .call(xAxis);

        // 添加Y轴
        svg.append("g")
            .attr("class", "axis")
            .call(yAxis);

        // 创建柱状图分组
        const bars = svg.selectAll(".bar")
            .data(dataset)
            .enter()
            .append("g");

        // 柱状图生长动画
        bars.append("rect")
            .attr("class", "bar")
            .attr("x", (d, i) => xScale(i))
            .attr("y", height) // 初始位置在底部
            .attr("width", xScale.bandwidth())
            .attr("height", 0) // 初始高度为0
            .attr("rx", 3) // 圆角
            .attr("ry", 3)
            .transition()
            .duration(1500)
            .delay((d, i) => i * 200) // 每个柱子延迟200ms
            .ease(d3.easeElasticOut) // 弹性效果
            .attr("y", d => yScale(d))
            .attr("height", d => height - yScale(d));

        // 添加数据标签
        bars.append("text")
            .attr("class", "label")
            .attr("x", (d, i) => xScale(i) + xScale.bandwidth() / 2)
            .attr("y", height + 20) // 初始位置在底部下方
            .attr("text-anchor", "middle")
            .text(d => d)
            .transition()
            .duration(1500)
            .delay((d, i) => i * 200)
            .attr("y", d => yScale(d) - 5); // 最终位置在柱子上方
    </script>
</body>
</html>
👇 效果展示:
该示例演示了柱状图的生长动画,包括柱子从底部向上生长和标签跟随移动的效果
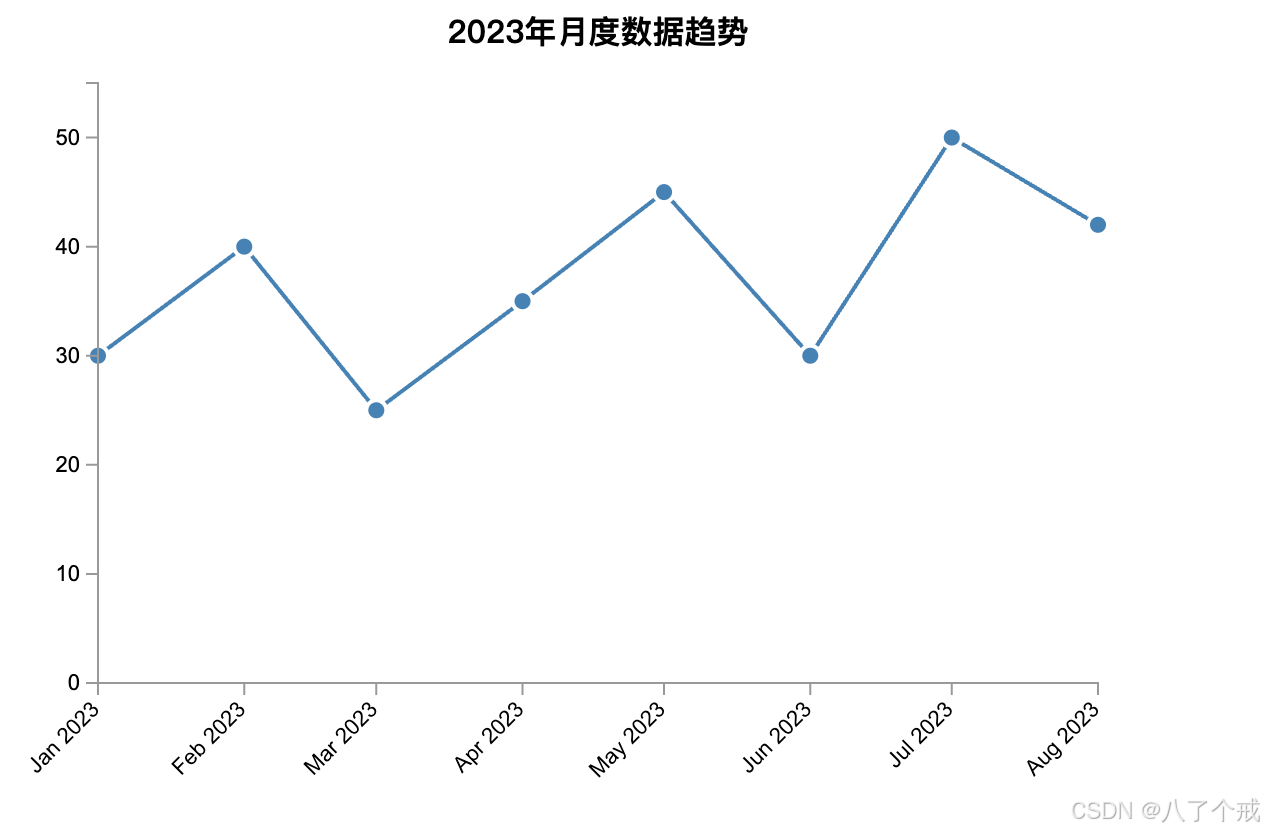
2. 文本跟随动画
👇 完整代码:
js
<!DOCTYPE html>
<html lang="en">
<head>
    <meta charset="UTF-8">
    <title>文本跟随动画</title>
    <script src="https://d3js.org/d3.v7.min.js"></script>
    <style>
        .dot {
            fill: steelblue;
            stroke: #fff;
            stroke-width: 2px;
        }
        .label {
            font-family: Arial;
            font-size: 12px;
            fill: #333;
            opacity: 0; /* 初始不可见 */
        }
        .line {
            fill: none;
            stroke: steelblue;
            stroke-width: 2px;
        }
        .axis path,
        .axis line {
            fill: none;
            stroke: #999;
            shape-rendering: crispEdges;
        }
        .axis text {
            font-family: Arial;
            font-size: 11px;
        }
    </style>
</head>
<body>
    <svg width="600" height="400"></svg>

    <script>
        // 时间序列数据
        const timeData = [
            {date: new Date(2023, 0, 1), value: 30},
            {date: new Date(2023, 1, 1), value: 40},
            {date: new Date(2023, 2, 1), value: 25},
            {date: new Date(2023, 3, 1), value: 35},
            {date: new Date(2023, 4, 1), value: 45},
            {date: new Date(2023, 5, 1), value: 30},
            {date: new Date(2023, 6, 1), value: 50},
            {date: new Date(2023, 7, 1), value: 42}
        ];

        // 设置边距和尺寸
        const margin = {top: 40, right: 40, bottom: 60, left: 60};
        const width = 600 - margin.left - margin.right;
        const height = 400 - margin.top - margin.bottom;

        // 创建SVG容器
        const svg = d3.select("svg")
            .attr("width", width + margin.left + margin.right)
            .attr("height", height + margin.top + margin.bottom)
            .append("g")
            .attr("transform", `translate(${margin.left},${margin.top})`);

        // 创建比例尺
        const xScale = d3.scaleTime()
            .domain(d3.extent(timeData, d => d.date))
            .range([0, width]);

        const yScale = d3.scaleLinear()
            .domain([0, d3.max(timeData, d => d.value) * 1.1])
            .range([height, 0]);

        // 创建折线生成器
        const line = d3.line()
            .x(d => xScale(d.date))
            .y(d => yScale(d.value));

        // 添加折线路径(初始不可见)
        svg.append("path")
            .datum(timeData)
            .attr("class", "line")
            .attr("d", line)
            .attr("stroke-dasharray", function() { return this.getTotalLength(); })
            .attr("stroke-dashoffset", function() { return this.getTotalLength(); })
            .transition()
            .duration(2000)
            .attr("stroke-dashoffset", 0);

        // 创建数据点分组
        const dots = svg.selectAll(".dot-group")
            .data(timeData)
            .enter()
            .append("g")
            .attr("class", "dot-group");

        // 添加数据点
        dots.append("circle")
            .attr("class", "dot")
            .attr("cx", d => xScale(d.date))
            .attr("cy", height) // 初始位置在底部
            .attr("r", 5)
            .transition()
            .duration(2000)
            .delay((d, i) => i * 300)
            .ease(d3.easeBounceOut)
            .attr("cy", d => yScale(d.value));

        // 添加数据标签(跟随动画)
        dots.append("text")
            .attr("class", "label")
            .attr("x", d => xScale(d.date))
            .attr("y", height) // 初始位置在底部
            .attr("dy", -10)
            .attr("text-anchor", "middle")
            .text(d => d.value)
            .transition()
            .duration(2000)
            .delay((d, i) => i * 300)
            .attr("y", d => yScale(d.value))
            .attr("opacity", 1);

        // 添加坐标轴
        const xAxis = d3.axisBottom(xScale)
            .ticks(d3.timeMonth.every(1))
            .tickFormat(d3.timeFormat("%b %Y"));

        const yAxis = d3.axisLeft(yScale)
            .ticks(5);

        svg.append("g")
            .attr("class", "axis")
            .attr("transform", `translate(0,${height})`)
            .call(xAxis)
            .selectAll("text")
            .attr("transform", "rotate(-45)")
            .attr("dx", "-.8em")
            .attr("dy", ".15em")
            .style("text-anchor", "end");

        svg.append("g")
            .attr("class", "axis")
            .call(yAxis);

        // 添加图表标题
        svg.append("text")
            .attr("x", width / 2)
            .attr("y", 0 - (margin.top / 2))
            .attr("text-anchor", "middle")
            .style("font-size", "16px")
            .style("font-weight", "bold")
            .text("2023年月度数据趋势");
    </script>
</body>
</html>
👇 效果展示:
该示例展示了折线图的绘制动画、圆点的弹跳效果以及文本标签的跟随动画
四、动画效果优化技巧
1. 缓动函数选择:
js
.ease(d3.easeElasticOut) // 弹性效果2. 组合动画:
js
.transition()
  .attr("x", 100)
.transition() // 链式调用实现连续动画
  .attr("y", 200)
3. 动画事件监听:
js
.on("end", function() {
  console.log("动画结束");
})
4. 性能优化:
-
避免过多同时运行的动画
-
使用
transform代替left/top等属性 -
对复杂图形考虑使用CSS动画
五、进阶动画技术
1. 自定义插值器
js
.transition()
.attrTween("fill", function() {
  return d3.interpolateRgb("red", "blue");
});
2. 路径动画
js
path.transition()
  .duration(2000)
  .attrTween("d", pathTween); // 自定义路径插值
3. 交错动画
js
.delay(function(d, i) {
  return Math.random() * 1000; // 随机延迟
})
六、注意事项小结
- 初始状态必须明确: 确保动画开始前设置了明确的初始属性
- 坐标系考虑: SVG的y轴向下增长,动画方向要注意
- 浏览器兼容性: 复杂动画在不同浏览器可能有性能差异
- 无障碍访问: 为动画提供适当的ARIA标签和替代内容
小结
核心要点
1. 三大基础API:
transition()启动动画过渡duration()控制动画时长(毫秒)delay()设置延迟启动时间
2. 实现流程:
graph LR
A[设置初始状态] --> B[调用transition()]
B --> C[定义目标状态]
C --> D[配置动画参数]
3. 四种进阶控制:
- 缓动函数
.ease() - 事件监听
.on() - 属性插值
.attrTween() - 路径动画
pathTween()
实践建议
1. 设计原则:
- 动画时长控制在200-1000ms
- 使用交错延迟增强视觉效果
- 保持动画目的性(数据强调/状态过渡)
2. 性能优化:
- 优先使用transform属性
- 复杂动画考虑CSS混合实现
- 移动端减少同时运行的动画数量
3. 常见模式:
js
// 典型生长动画
.attr('height', 0)  // 初始状态
.transition()
.duration(500)
.attr('height', d => height - yScale(d)) // 最终状态