✨作者主页 :IT研究室✨
个人简介:曾从事计算机专业培训教学,擅长Java、Python、微信小程序、Golang、安卓Android等项目实战。接项目定制开发、代码讲解、答辩教学、文档编写、降重等。
文章目录
一、前言
系统介绍
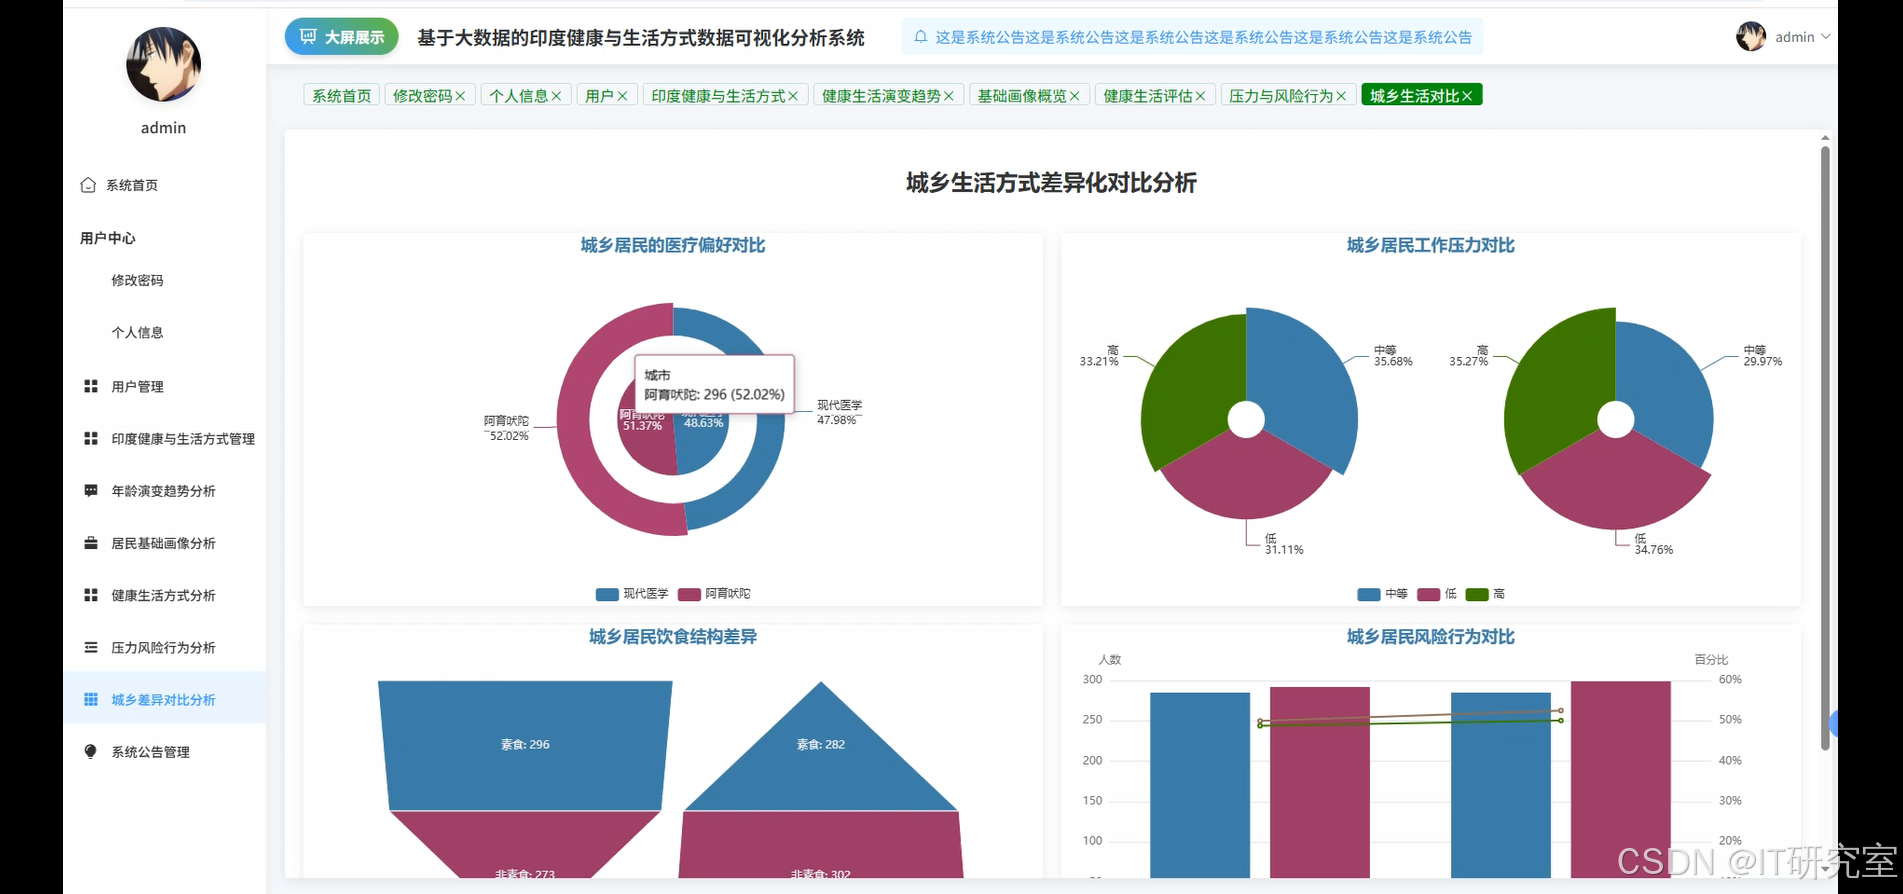
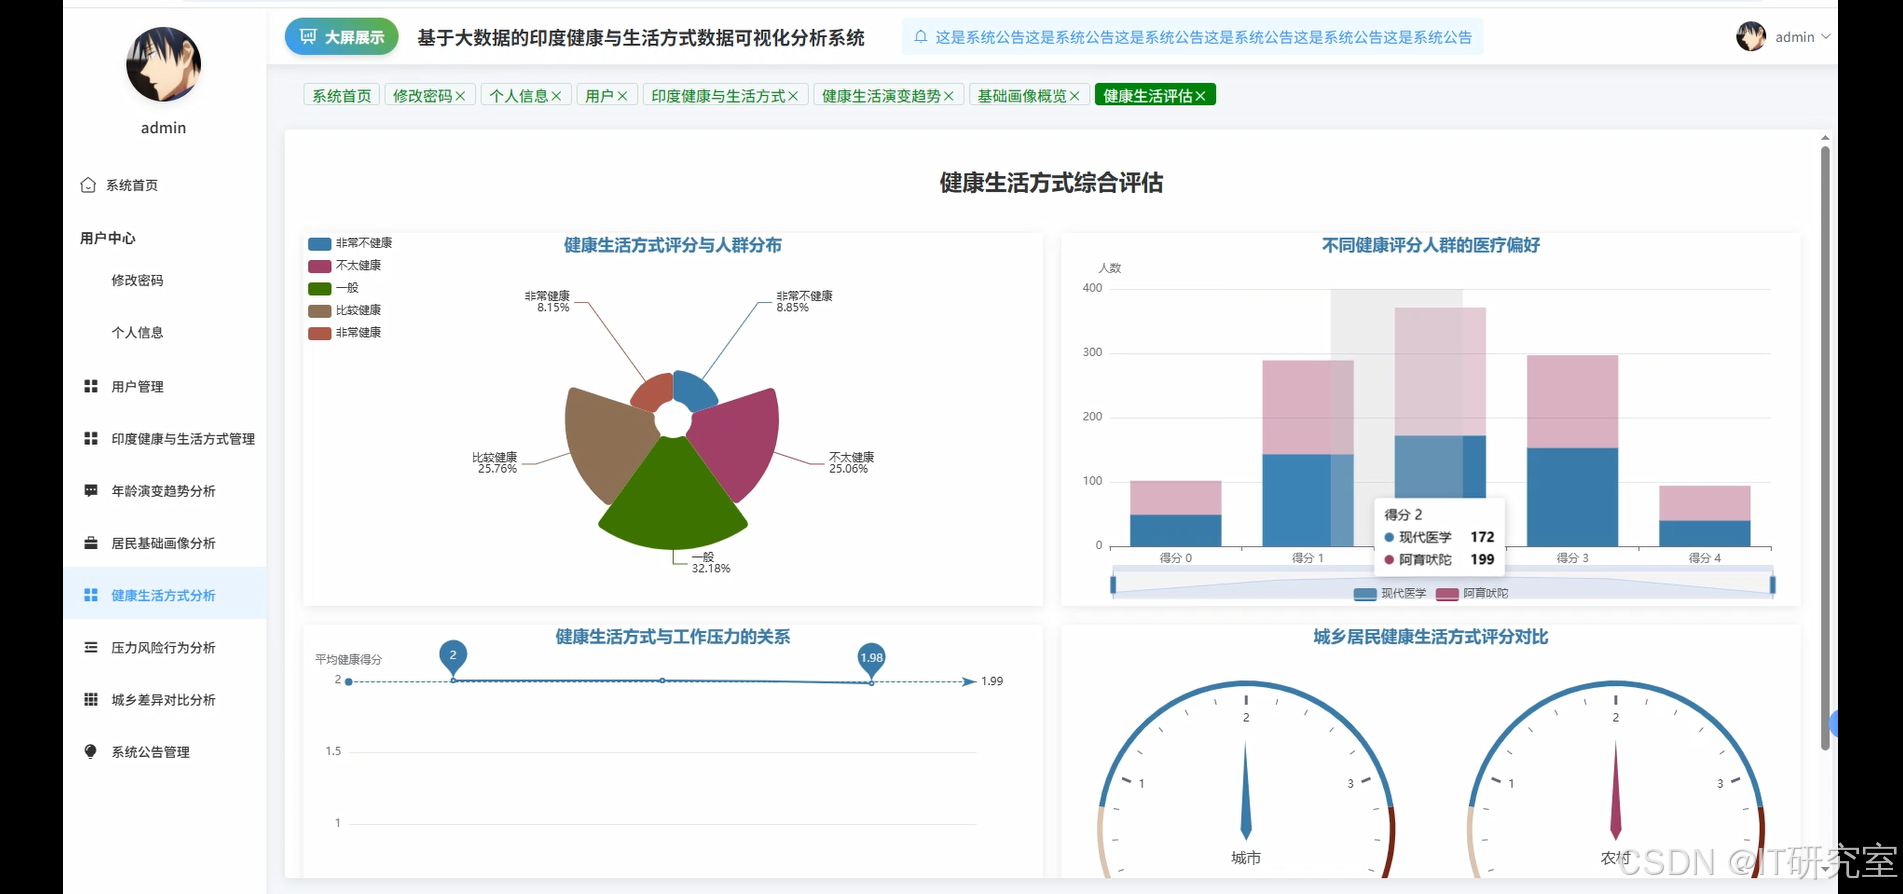
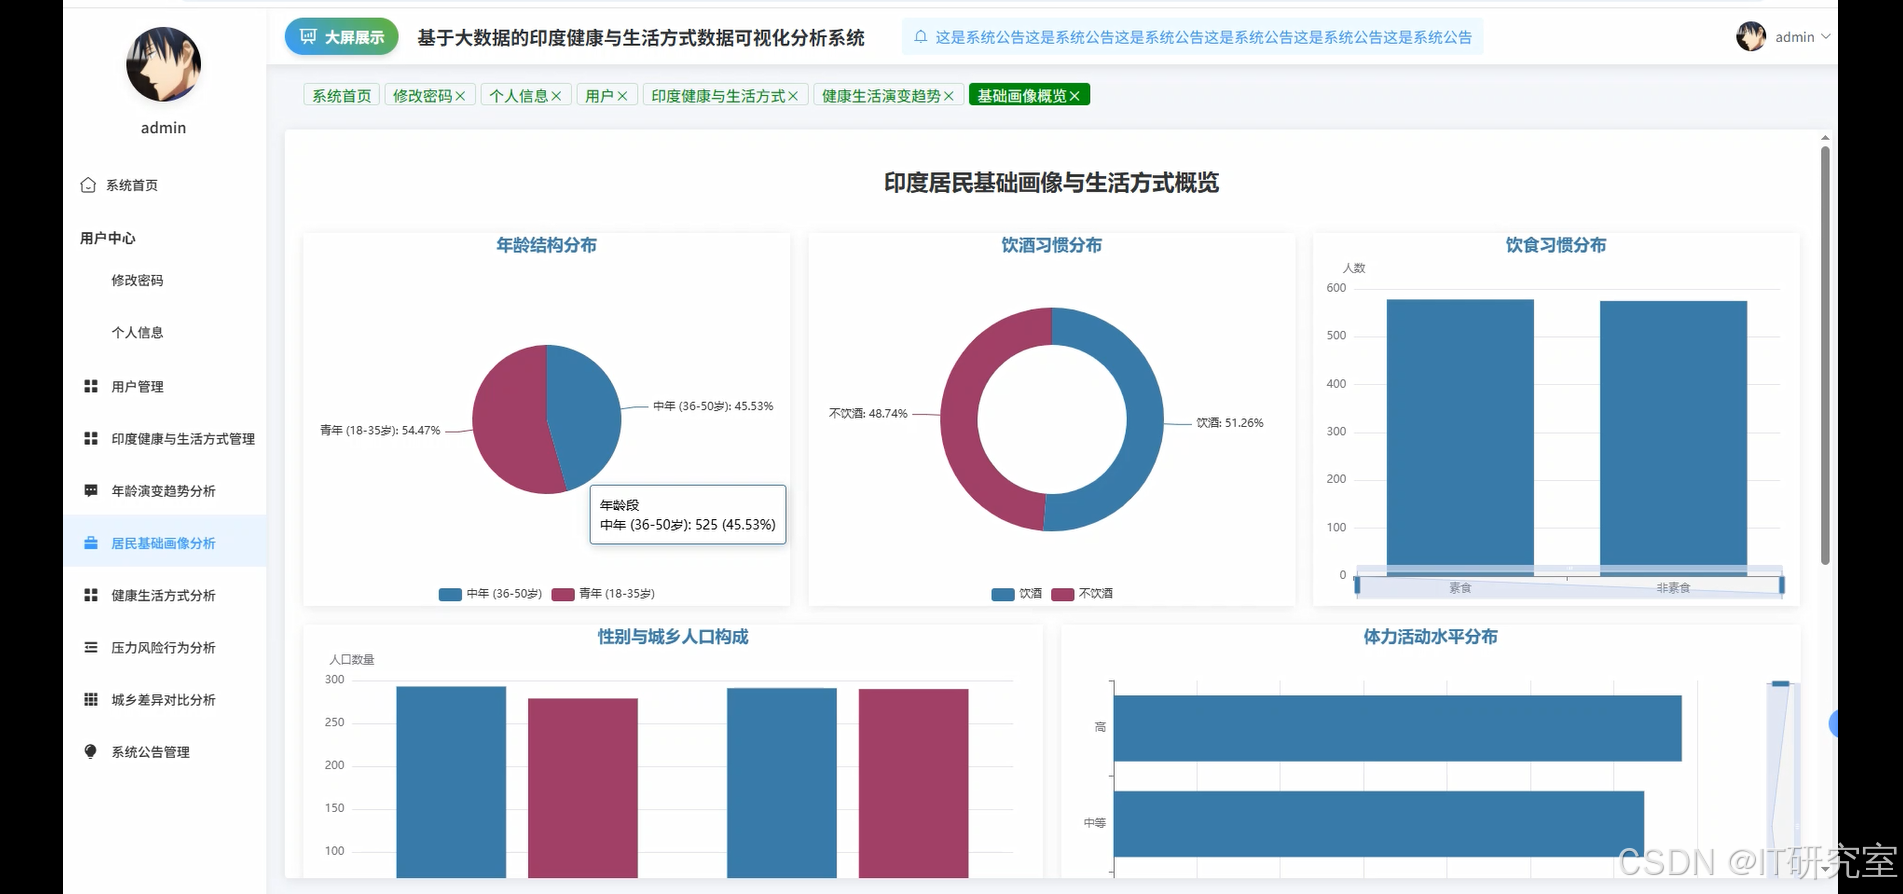
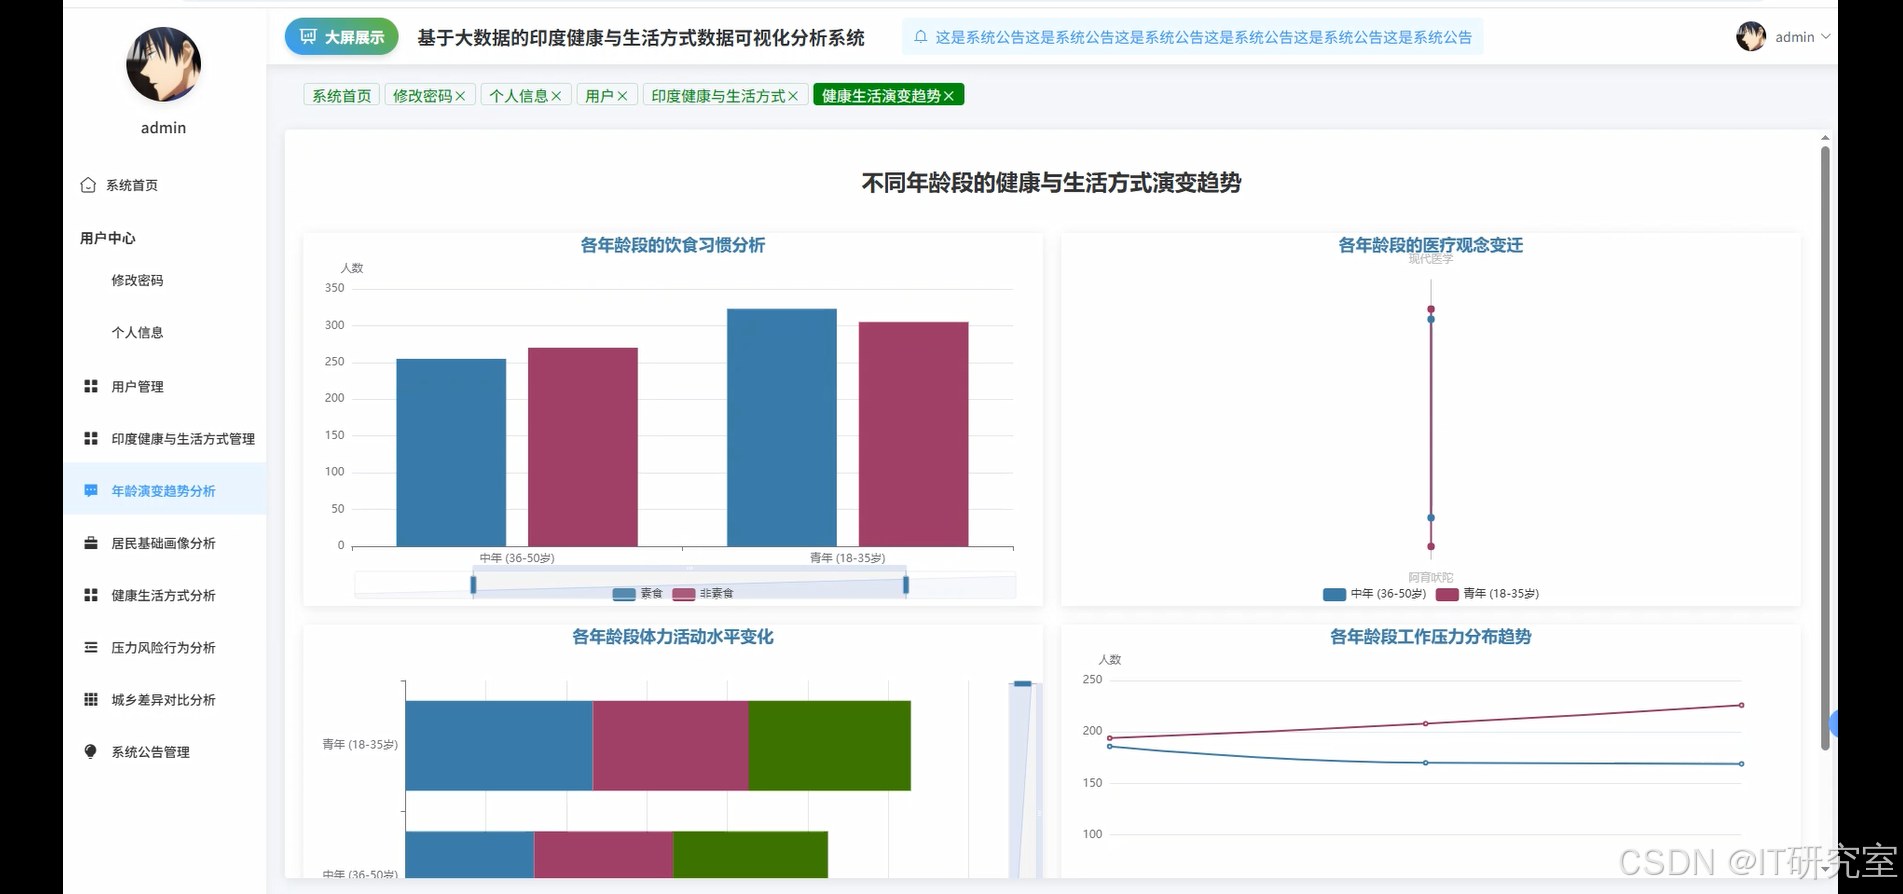
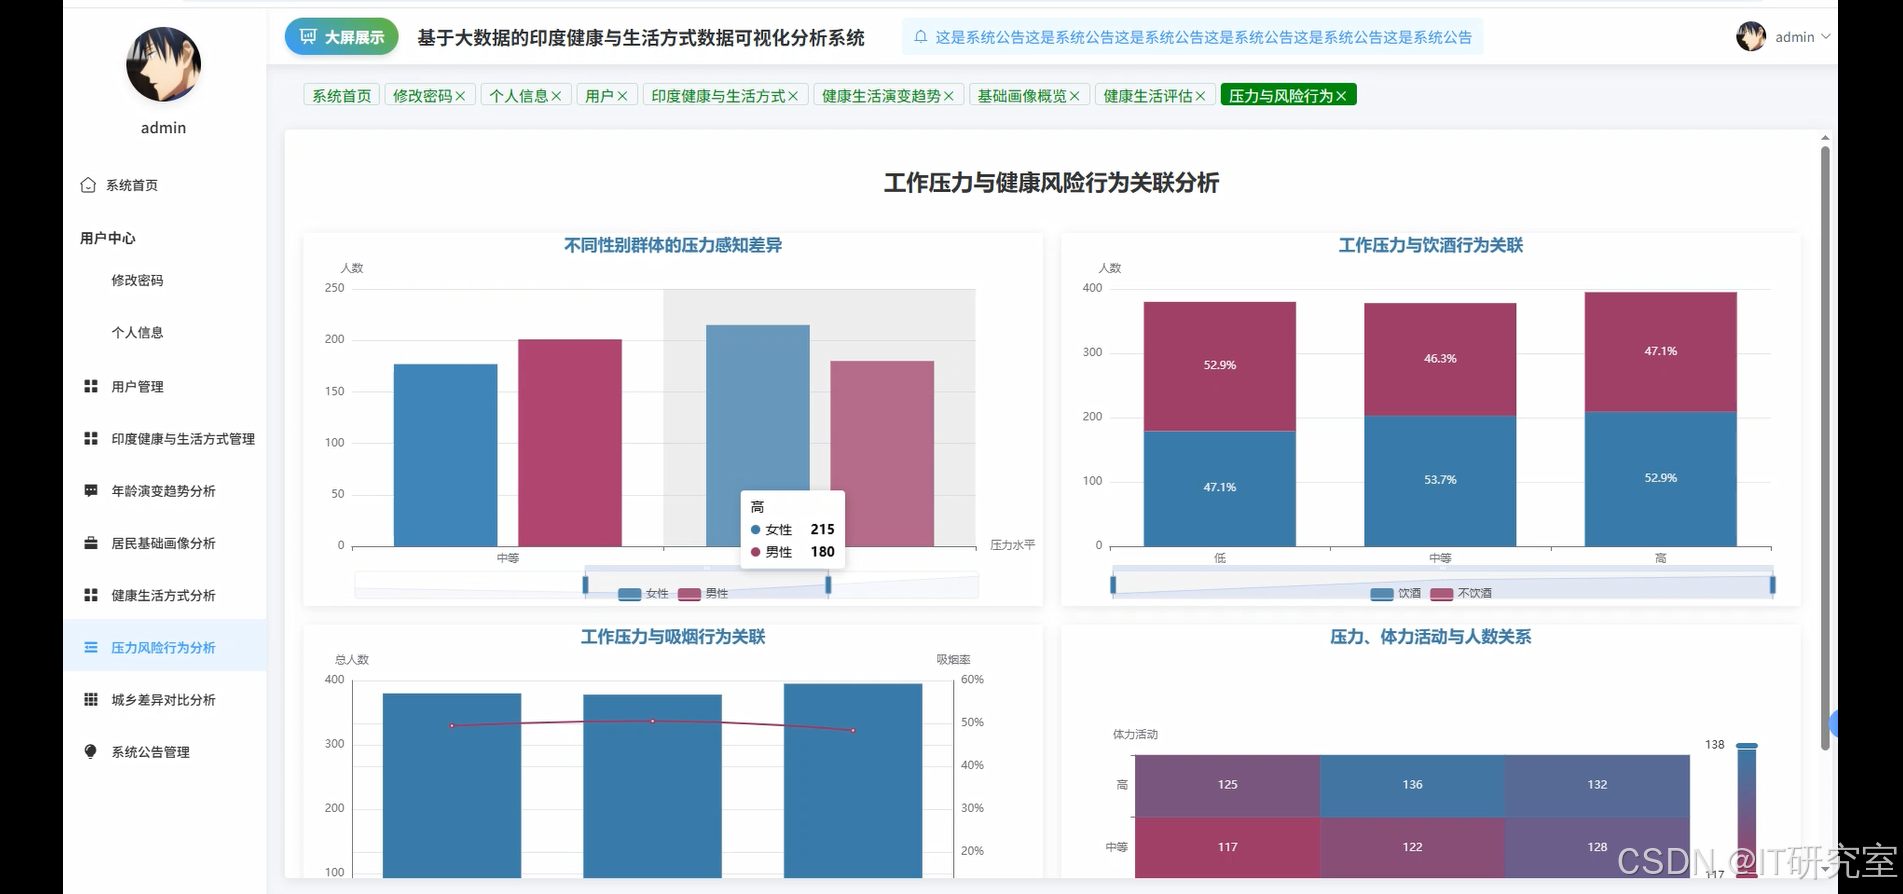
基于大数据的健康与生活方式数据可视化分析系统是一个专门针对印度居民健康数据的综合性分析平台。该系统利用Hadoop分布式存储架构和Spark大数据处理引擎,对包含性别、年龄、城乡分布、医疗偏好、工作压力、吸烟饮酒习惯、体力活动水平等多维度的健康生活方式数据进行深度挖掘和分析。系统采用Django/Spring Boot后端架构设计,结合MySQL数据库进行数据持久化存储,前端运用Vue框架配合ElementUI组件库和ECharts可视化图表库,构建了直观友好的数据展示界面。系统核心功能涵盖居民基础画像分析、城乡生活方式差异对比、工作压力与健康风险行为关联分析、不同年龄段健康演变趋势分析以及健康生活方式综合评估等五大分析维度。通过Spark SQL进行复杂数据查询和统计分析,结合Pandas和NumPy进行数据处理和计算,最终以多样化的图表形式呈现分析结果,为健康管理决策提供数据支撑。系统特别注重数据的实时性和准确性,能够处理大规模健康数据集,为研究人员和政策制定者提供可靠的数据分析工具。
选题背景
随着全球健康意识的不断提升和大数据技术的快速发展,健康数据分析已成为现代医疗卫生领域的重要研究方向。印度作为世界第二人口大国,其复杂的社会经济结构和多样化的生活环境造就了独特的健康生活方式模式,城市与农村地区在医疗资源配置、生活习惯、工作压力等方面存在显著差异。传统的健康数据分析方法往往局限于小样本调查或单一维度分析,难以全面反映不同人群的健康状况和生活方式特征。大数据技术的兴起为健康数据的深度挖掘提供了新的可能性,能够处理海量多维度数据并发现隐藏的关联模式。同时,数据可视化技术的成熟使得复杂的分析结果能够以直观的方式呈现给决策者和研究人员。当前健康管理领域急需一套能够综合分析多维度健康数据、识别不同群体健康风险因素、并提供可视化决策支持的系统平台。
选题意义
本研究的开展具有重要的实际应用价值和学术意义。从实际应用角度来看,该系统能够帮助卫生部门更好地了解不同地区和人群的健康状况分布,为制定针对性的公共卫生政策提供数据依据。通过分析城乡差异和年龄演变趋势,可以识别健康风险的高发人群和地区,有助于优化医疗资源配置和健康干预措施的实施。系统对工作压力与健康风险行为关联的分析,能够为企业制定员工健康管理策略提供参考。从技术角度来看,本系统将大数据技术与健康数据分析相结合,展示了Hadoop和Spark在健康信息学领域的应用潜力,为相关技术在医疗健康领域的推广应用提供了实践案例。从学术研究价值来看,该系统构建的多维度健康评估模型和可视化分析方法,为健康数据分析领域的研究提供了新的思路和工具。虽然作为毕业设计项目,系统规模和复杂度相对有限,但其探索的技术路线和分析方法具有一定的参考价值,为后续更大规模的健康数据分析系统开发奠定了基础。
二、开发环境
- 大数据框架:Hadoop+Spark(本次没用Hive,支持定制)
- 开发语言:Python+Java(两个版本都支持)
- 后端框架:Django+Spring Boot(Spring+SpringMVC+Mybatis)(两个版本都支持)
- 前端:Vue+ElementUI+Echarts+HTML+CSS+JavaScript+jQuery
- 详细技术点:Hadoop、HDFS、Spark、Spark SQL、Pandas、NumPy
- 数据库:MySQL
三、系统界面展示
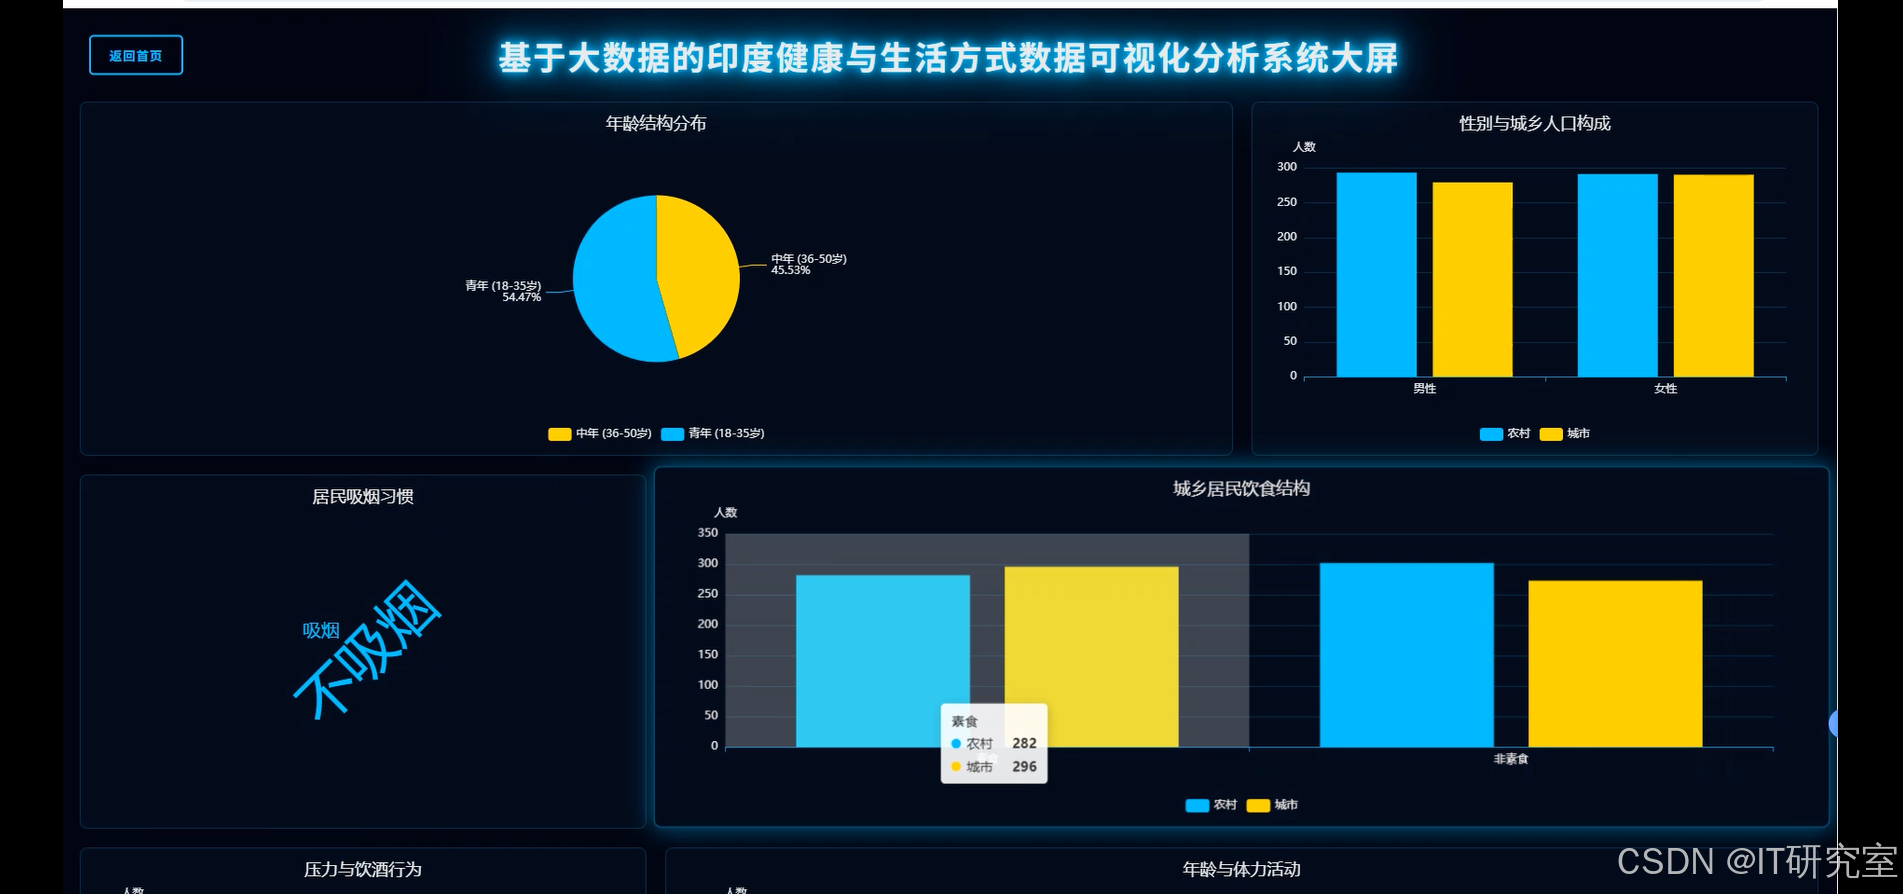
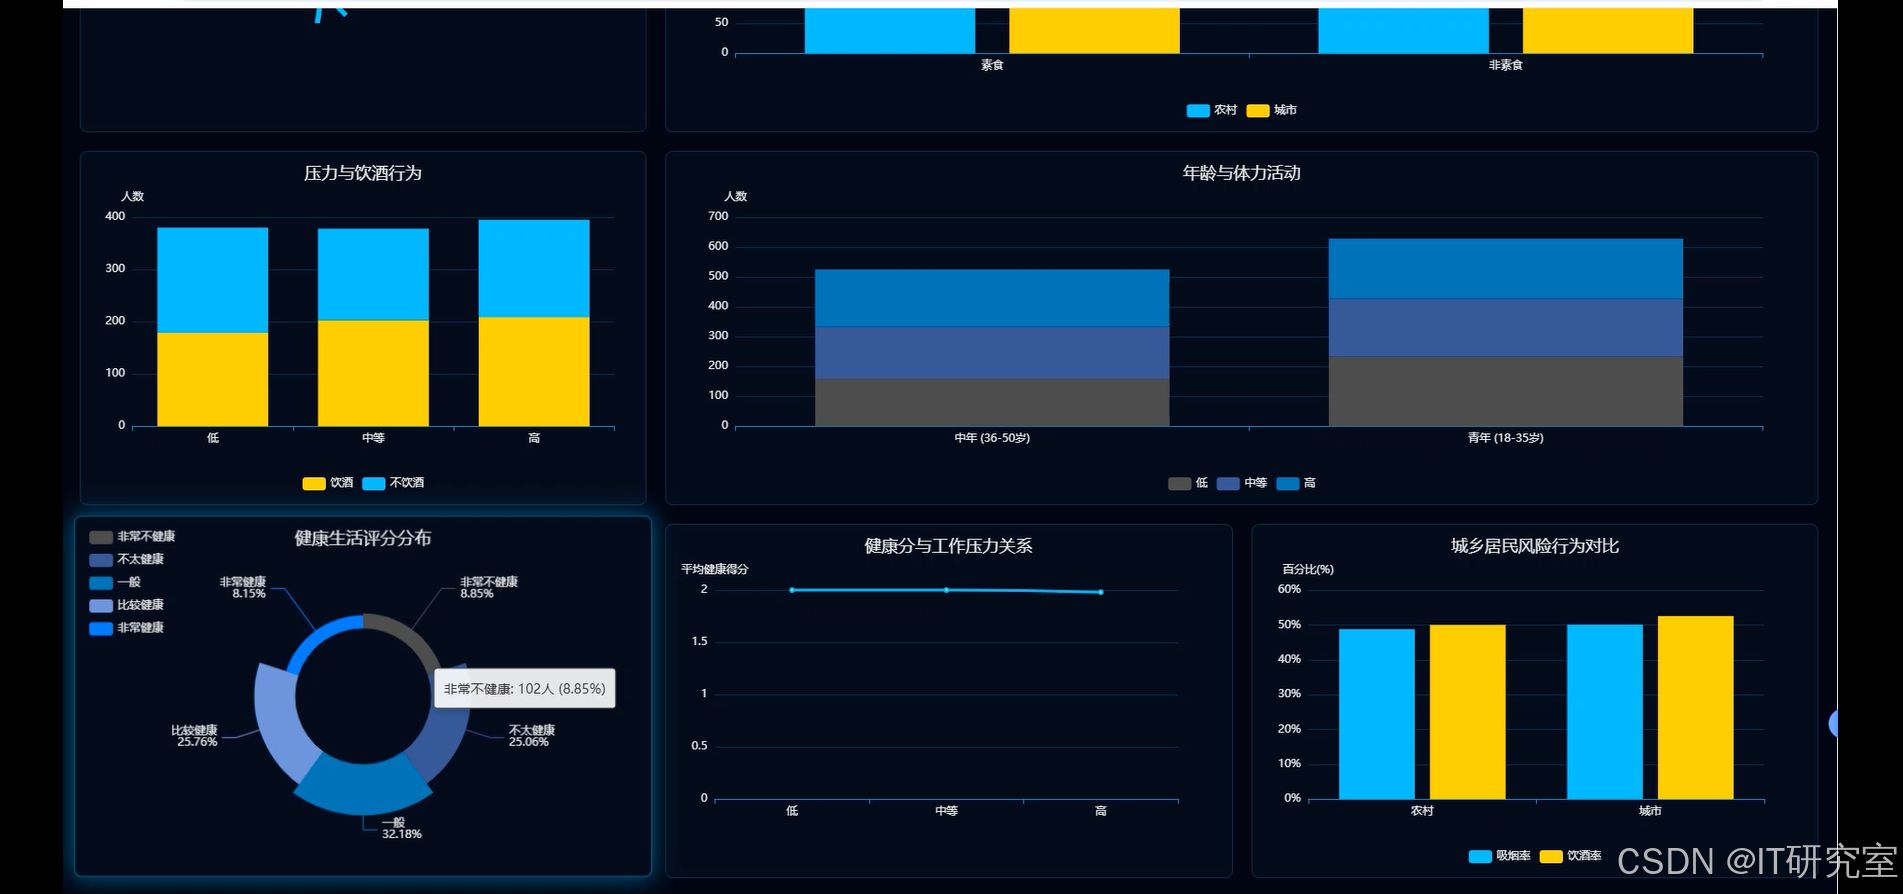
- 基于大数据的健康与生活方式数据可视化分析系统界面展示:
四、代码参考
- 项目实战代码参考:
java(贴上部分代码)
from pyspark.sql import SparkSession
from pyspark.sql.functions import col, count, when, sum as spark_sum, desc, asc
from pyspark.sql.types import IntegerType
import pandas as pd
import numpy as np

spark = SparkSession.builder.appName("HealthDataAnalysis").config("spark.some.config.option", "some-value").getOrCreate()

def urban_rural_lifestyle_comparison():
    """城乡生活方式差异对比分析核心功能"""
    df = spark.read.csv("Reproductive_Health.csv", header=True, inferSchema=True)
    smoking_comparison = df.groupBy("Urban/Rural", "Smoking Status").count()
    smoking_pivot = smoking_comparison.groupBy("Urban/Rural").pivot("Smoking Status").sum("count")
    alcohol_comparison = df.groupBy("Urban/Rural", "Alcohol Consumption").count()
    alcohol_pivot = alcohol_comparison.groupBy("Urban/Rural").pivot("Alcohol Consumption").sum("count")
    medicine_preference = df.groupBy("Urban/Rural", "Preferred Medicine").count()
    medicine_pivot = medicine_preference.groupBy("Urban/Rural").pivot("Preferred Medicine").sum("count")
    work_stress_comparison = df.groupBy("Urban/Rural", "Work Stress").count()
    stress_pivot = work_stress_comparison.groupBy("Urban/Rural").pivot("Work Stress").sum("count")
    diet_comparison = df.groupBy("Urban/Rural", "Diet Type").count()
    diet_pivot = diet_comparison.groupBy("Urban/Rural").pivot("Diet Type").sum("count")
    urban_total = df.filter(col("Urban/Rural") == "Urban").count()
    rural_total = df.filter(col("Urban/Rural") == "Rural").count()
    smoking_percentages = smoking_pivot.withColumn("Smoker_Percentage",
                                                  (col("Smoker") / (col("Smoker") + col("Non-Smoker")) * 100))
    alcohol_percentages = alcohol_pivot.withColumn("Alcohol_Percentage",
                                                  (col("Yes") / (col("Yes") + col("No")) * 100))
    result_data = {
        'smoking_data': smoking_percentages.collect(),
        'alcohol_data': alcohol_percentages.collect(),
        'medicine_data': medicine_pivot.collect(),
        'stress_data': stress_pivot.collect(),
        'diet_data': diet_pivot.collect(),
        'urban_total': urban_total,
        'rural_total': rural_total
    }
    return result_data

def work_stress_health_risk_analysis():
    """工作压力与健康风险行为关联分析核心功能"""
    df = spark.read.csv("Reproductive_Health.csv", header=True, inferSchema=True)
    stress_smoking_corr = df.groupBy("Work Stress", "Smoking Status").count()
    stress_smoking_pivot = stress_smoking_corr.groupBy("Work Stress").pivot("Smoking Status").sum("count")
    stress_alcohol_corr = df.groupBy("Work Stress", "Alcohol Consumption").count()
    stress_alcohol_pivot = stress_alcohol_corr.groupBy("Work Stress").pivot("Alcohol Consumption").sum("count")
    stress_activity_corr = df.groupBy("Work Stress", "Physical Activity").count()
    stress_activity_pivot = stress_activity_corr.groupBy("Work Stress").pivot("Physical Activity").sum("count")
    gender_stress_analysis = df.groupBy("Gender", "Work Stress").count()
    gender_stress_pivot = gender_stress_analysis.groupBy("Gender").pivot("Work Stress").sum("count")
    high_stress_group = df.filter(col("Work Stress") == "High")
    high_stress_smoking_rate = high_stress_group.filter(col("Smoking Status") == "Smoker").count() / high_stress_group.count()
    high_stress_alcohol_rate = high_stress_group.filter(col("Alcohol Consumption") == "Yes").count() / high_stress_group.count()
    low_stress_group = df.filter(col("Work Stress") == "Low")
    low_stress_smoking_rate = low_stress_group.filter(col("Smoking Status") == "Smoker").count() / low_stress_group.count()
    low_stress_alcohol_rate = low_stress_group.filter(col("Alcohol Consumption") == "Yes").count() / low_stress_group.count()
    stress_levels = ["High", "Moderate", "Low"]
    correlation_matrix = []
    for stress_level in stress_levels:
        stress_subset = df.filter(col("Work Stress") == stress_level)
        smoking_count = stress_subset.filter(col("Smoking Status") == "Smoker").count()
        alcohol_count = stress_subset.filter(col("Alcohol Consumption") == "Yes").count()
        low_activity_count = stress_subset.filter(col("Physical Activity") == "Low").count()
        total_count = stress_subset.count()
        correlation_matrix.append({
            'stress_level': stress_level,
            'smoking_rate': smoking_count / total_count if total_count > 0 else 0,
            'alcohol_rate': alcohol_count / total_count if total_count > 0 else 0,
            'low_activity_rate': low_activity_count / total_count if total_count > 0 else 0
        })
    result_data = {
        'stress_smoking_data': stress_smoking_pivot.collect(),
        'stress_alcohol_data': stress_alcohol_pivot.collect(),
        'stress_activity_data': stress_activity_pivot.collect(),
        'gender_stress_data': gender_stress_pivot.collect(),
        'correlation_matrix': correlation_matrix,
        'risk_comparison': {
            'high_stress_smoking': high_stress_smoking_rate,
            'high_stress_alcohol': high_stress_alcohol_rate,
            'low_stress_smoking': low_stress_smoking_rate,
            'low_stress_alcohol': low_stress_alcohol_rate
        }
    }
    return result_data

def comprehensive_health_lifestyle_evaluation():
    """健康生活方式综合评估核心功能"""
    df = spark.read.csv("Reproductive_Health.csv", header=True, inferSchema=True)
    health_score_df = df.withColumn("health_score",
                                   when(col("Smoking Status") == "Non-Smoker", 3).otherwise(0) +
                                   when(col("Alcohol Consumption") == "No", 3).otherwise(0) +
                                   when(col("Physical Activity") == "High", 4)
                                   .when(col("Physical Activity") == "Moderate", 2).otherwise(0))
    health_score_distribution = health_score_df.groupBy("health_score").count().orderBy(asc("health_score"))
    avg_health_score_by_region = health_score_df.groupBy("Urban/Rural").agg(
        spark_sum("health_score").alias("total_score"),
        count("*").alias("total_count")
    ).withColumn("avg_health_score", col("total_score") / col("total_count"))
    health_score_by_stress = health_score_df.groupBy("Work Stress").agg(
        spark_sum("health_score").alias("total_score"),
        count("*").alias("total_count")
    ).withColumn("avg_health_score", col("total_score") / col("total_count"))
    health_score_by_medicine = health_score_df.groupBy("Preferred Medicine").agg(
        spark_sum("health_score").alias("total_score"),
        count("*").alias("total_count")
    ).withColumn("avg_health_score", col("total_score") / col("total_count"))
    health_categories = health_score_df.withColumn("health_category",
                                                  when(col("health_score") >= 8, "Excellent")
                                                  .when(col("health_score") >= 6, "Good")
                                                  .when(col("health_score") >= 3, "Fair")
                                                  .otherwise("Poor"))
    category_distribution = health_categories.groupBy("health_category").count()
    category_by_age_group = health_categories.withColumn("age_group",
                                                        when(col("Age") <= 25, "18-25")
                                                        .when(col("Age") <= 35, "26-35")
                                                        .when(col("Age") <= 45, "36-45")
                                                        .otherwise("46+"))
    age_health_analysis = category_by_age_group.groupBy("age_group", "health_category").count()
    gender_health_analysis = health_categories.groupBy("Gender", "health_category").count()
    top_healthy_profiles = health_score_df.filter(col("health_score") >= 8).groupBy(
        "Gender", "Urban/Rural", "Age"
    ).count().orderBy(desc("count"))
    risk_profiles = health_score_df.filter(col("health_score") <= 2).groupBy(
        "Work Stress", "Urban/Rural"
    ).count().orderBy(desc("count"))
    result_data = {
        'health_score_distribution': health_score_distribution.collect(),
        'regional_avg_scores': avg_health_score_by_region.collect(),
        'stress_health_correlation': health_score_by_stress.collect(),
        'medicine_health_correlation': health_score_by_medicine.collect(),
        'category_distribution': category_distribution.collect(),
        'age_health_analysis': age_health_analysis.collect(),
        'gender_health_analysis': gender_health_analysis.collect(),
        'top_healthy_profiles': top_healthy_profiles.collect(),
        'risk_profiles': risk_profiles.collect()
    }
    return result_data
五、系统视频
基于大数据的健康与生活方式数据可视化分析系统项目视频:
大数据毕业设计选题推荐-基于大数据的健康与生活方式数据可视化分析系统-Spark-Hadoop-Bigdata
结语
大数据毕业设计选题推荐-基于大数据的健康与生活方式数据可视化分析系统-Spark-Hadoop-Bigdata
想看其他类型的计算机毕业设计作品也可以和我说~谢谢大家!
有技术这一块问题大家可以评论区交流或者私我~
大家可以帮忙点赞、收藏、关注、评论啦~
源码获取:⬇⬇⬇