目录
[修改 docker-compose.yml,增加 Node Exporter](#修改 docker-compose.yml,增加 Node Exporter)
[修改 Prometheus 配置文件,添加 Node Exporter 目标](#修改 Prometheus 配置文件,添加 Node Exporter 目标)
[启动 Node Exporter 并刷新 Prometheus 配置](#启动 Node Exporter 并刷新 Prometheus 配置)
注意
localhost是本机的ip地址,需要修改
修改 docker-compose.yml,增加 Node Exporter
在 /opt/monitor/docker-compose.yml 文件中,增加一个服务 node-exporter:
version: '3.9'
services:
  prometheus:
    image: prom/prometheus:latest
    container_name: prometheus
    volumes:
      - ./prometheus/prometheus.yml:/etc/prometheus/prometheus.yml
    ports:
      - "9090:9090"
    restart: always

  grafana:
    image: grafana/grafana:latest
    container_name: grafana
    ports:
      - "3000:3000"
    environment:
      - GF_SECURITY_ADMIN_USER=admin
      - GF_SECURITY_ADMIN_PASSWORD=admin
    restart: always

  node-exporter:
    image: prom/node-exporter:latest
    container_name: node-exporter
    network_mode: "host"       # 让 Node Exporter 能直接访问宿主机指标
    pid: "host"                # 允许访问宿主机进程信息
    restart: always
说明:
-
network_mode: "host"是 Node Exporter 的推荐配置,可以直接采集宿主机指标。 -
不需要端口映射,因为 Prometheus 会直接抓
9100端口。
修改 Prometheus 配置文件,添加 Node Exporter 目标
编辑 /opt/monitor/prometheus/prometheus.yml,增加 node-exporter scrape 配置:
global:
  scrape_interval: 5s

scrape_configs:
  - job_name: 'prometheus'
    static_configs:
      - targets: ['localhost:9090']

  - job_name: 'node-exporter'
    static_configs:
      - targets: ['localhost:9100']
启动 Node Exporter 并刷新 Prometheus 配置
cd /opt/monitor

# 重新启动容器
docker compose down
docker compose up -d
或者只重启 Prometheus 和 Node Exporter:
docker compose up -d prometheus node-exporter验证
-
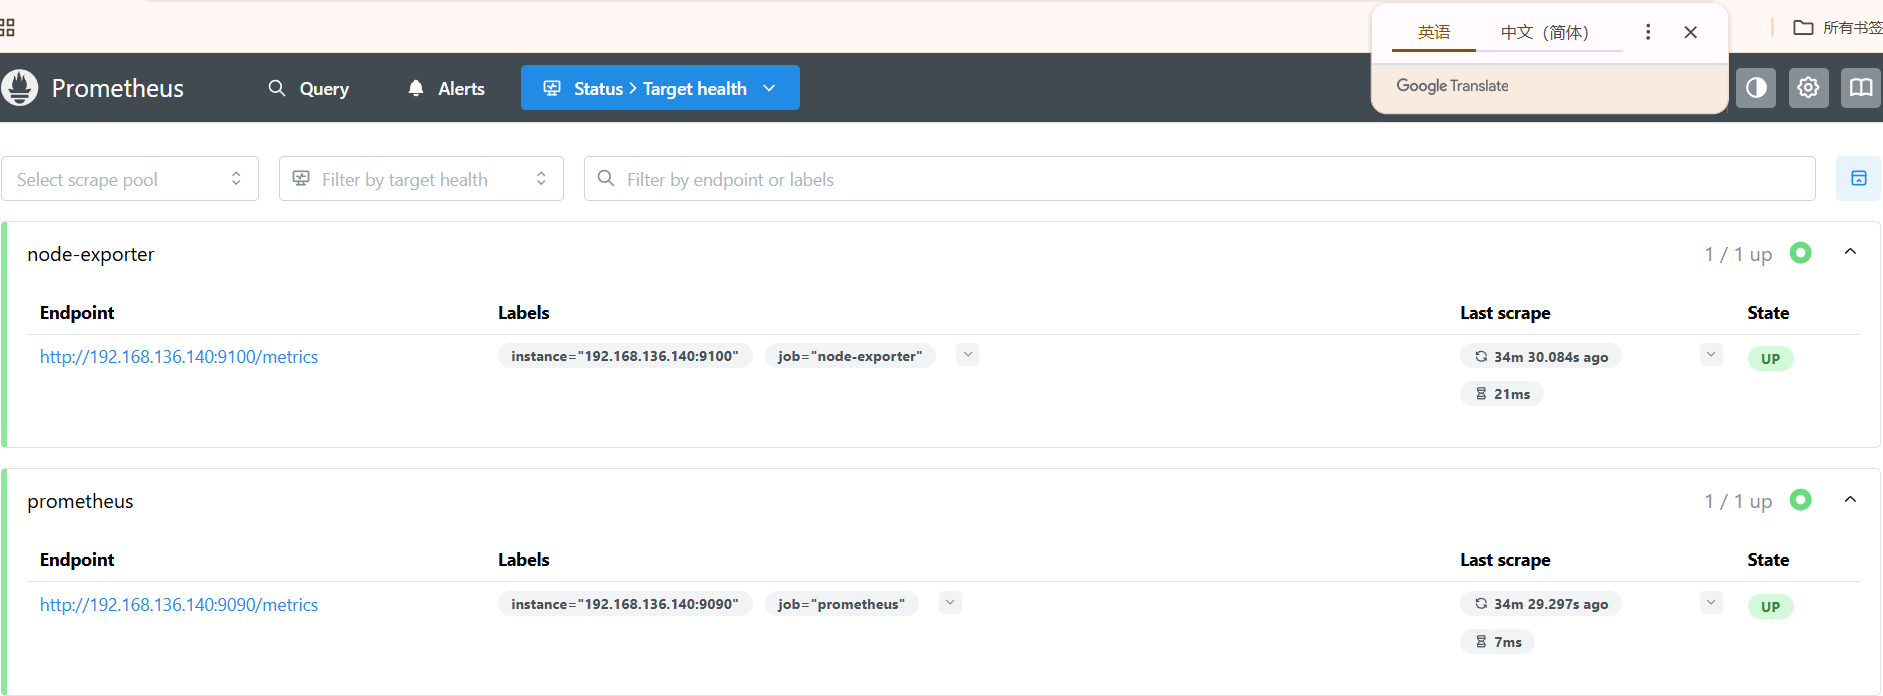
Prometheus 页面访问:http://localhost:9090
在 Status → Targets 中,你应该看到:
Grafana 页面访问:http://localhost:3000
登录账号:admin / admin
可以导入官方 Node Exporter dashboard(Dashboard ID: 1860),直接显示主机 CPU/内存/磁盘/网络图表。