需求
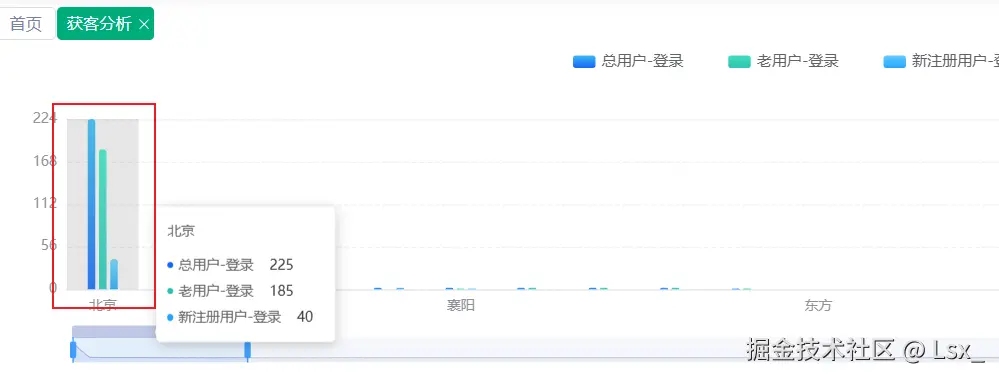
如图所示,由于图表联动需求,选中图表中某一列数据,可联动其它图表数据进行渲染。
对于柱状图 需要支持点击其背景区域也可触发点击事件;
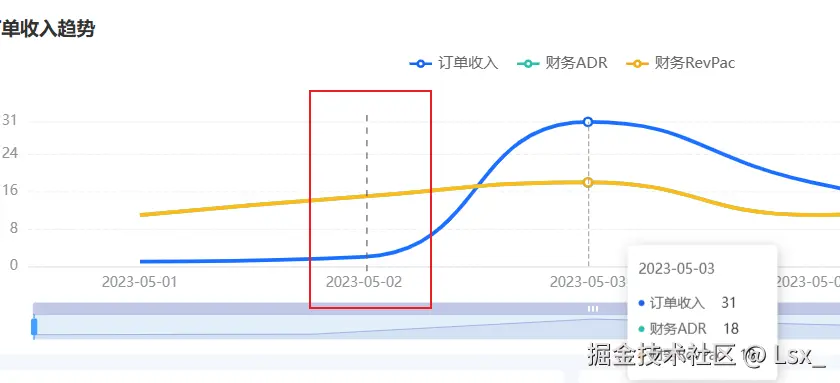
对于折线图,需要支持点击其坐标点左右范围的区间也可触发点击事件,并且点击后要保留竖线。
Echarts 点击处理事件,通过chartInstance.on可实现,但只能点击柱状图才能触发,点击label(即:坐标文本)、点击柱状图阴影区域无法触发;通过chartInstance.getZr().on可全局监听Echarts事件,但无法准确的获取当前点击柱状的index;解决办法如下:
解决方案
处理图表全局点击事件
js
  chartInstance?.getZr().on("click", (params: any) => {
    const pointInPixel = [params.offsetX, params.offsetY];
    const pointInGrid = chartInstance.convertFromPixel({ seriesIndex: 0 }, pointInPixel);
    // 柱状图-竖向(数据的索引值)
    const index = pointInGrid[0];

    console.log(index)
  });
🔍 一步步解析代码
第 1 行
js
chartInstance?.getZr().on("click", (params) => { ... })chartInstance是你通过echarts.init(...)得到的图表实例。.getZr()返回的是 ECharts 内部用的 ZRender 实例,它相当于一个底层的"画布层",能监听点击、鼠标移动等低级事件。.on("click", handler)表示注册一个画布点击事件,params是点击事件对象。
👉 所以这一行的作用是:
在整个 ECharts 图的画布上注册一个点击事件监听器。
第 2 行
js
const pointInPixel = [params.offsetX, params.offsetY];params.offsetX / offsetY是鼠标点击在画布中的像素坐标。- 即:你点击的位置在图表的画布上的绝对坐标点。
👉 这一步是把点击点的屏幕坐标保存成数组 ,例如 [x, y] = [320, 180]。
第 3 行
ini
const pointInGrid = chartInstance.convertFromPixel({ seriesIndex: 0 }, pointInPixel);-
convertFromPixel是 ECharts 提供的一个有用方法:可以反向计算:"像素坐标 → 对应到数据坐标(数据索引或坐标轴数值)"
-
第二个参数是刚才的
[x, y]像素坐标。 -
第一个参数
{ seriesIndex: 0 }表示使用第 0 个系列(在图表的第一个数据集)来定义转换规则。
👉 如果这是一个柱状图 或折线图,调用后得到的 pointInGrid 就是:
csharp
[x轴的索引, y轴的数值]例如点击了第 3 根柱子:
ini
pointInGrid = [3, 200]第 4-5 行
ini
const index = pointInGrid[0];
console.log(index);- 取得反算结果中的第一个值------即 x轴索引值(数据索引) 。
- 打印到控制台。
处理图表点击选中态
以上方案只是解决了图表的点击问题,有时候,比如折线图,点击后,需要留下一个选中态的竖线。解决方案如下
js
let permanentSelectedLine: echarts.graphic.Line | null = null; // 点击列后,选中的竖线
let lastSelectedIndex = -1; // 上次选中的列索引
const SELECTED_LINE_Z = 1000; // 选中竖线的层级

// 点击列并显示虚线
const handleColumnClick = (index: number) => {
  const chartInstance = chartRef.value?.getInstance();
  if (!chartInstance || !data.value?.dayList) return;

  const dayList = data.value.dayList;

  // 检查索引是否有效
  if (index < 0 || index >= dayList.length) return;

  // 获取选中列的日期和数据
  const selectedDate = dayList[index].statDay;
  const selectedData = {
    index,
    date: selectedDate,
    data: dayList[index]
  };

  // 触发事件,用于联动其它图表
  assetDashboardStore.setSelectedOrderIncomeTrendDate(selectedDate);

  // 删除旧的永久选中竖线
  if (permanentSelectedLine) {
    chartInstance.getZr().remove(permanentSelectedLine);
    permanentSelectedLine = null;
  }

  // 如果点击的是同一列,取消选中
  if (lastSelectedIndex === index) {
    lastSelectedIndex = -1;
    return;
  }

  lastSelectedIndex = index;

  // 计算竖线位置
  const xPixel = chartInstance.convertToPixel({ xAxisIndex: 0 }, selectedDate);

  // 获取图表高度,用于绘制竖线
  const chartHeight = chartRef.value?.$el?.clientHeight || 300;

  // 确定竖线的起始和结束位置
  const yStart = 60; // 顶部边距
  const yEnd = chartHeight - 90; // 底部边距

  // 画新竖线(永久选中线,样式对齐 trigger: "axis")
  permanentSelectedLine = new echarts.graphic.Line({
    z: SELECTED_LINE_Z, // 最高层级,确保始终显示在最上层
    shape: { x1: xPixel, y1: yStart, x2: xPixel, y2: yEnd },
    style: {
      stroke: "#666666",
      lineWidth: 1,
      lineDash: [5, 5]
    }
  });

  chartInstance.getZr().add(permanentSelectedLine);
};
🔍 解析代码
这段代码的函数叫 handleColumnClick,它允许在点击某个"列"(比如折线图或柱状图的指定 x 轴点)时执行额外操作:
- 在图表上绘制一条永久竖线(虚线)以表示选中项;
- 触发一个联动事件(更新状态给其他图表用);
- 支持再次点击同一列取消选中。
删除旧的竖线:
js
if (permanentSelectedLine) {
  chartInstance.getZr().remove(permanentSelectedLine);
  permanentSelectedLine = null;
}- 图上可能已经有一条虚线(上次点击生成)。
- 这一步从画布(ZRender 层)移除旧竖线。
- 清空变量,以便下一次重新画新的竖线。
计算竖线位置(像素坐标):
js
const xPixel = chartInstance.convertToPixel({ xAxisIndex: 0 }, selectedDate);selectedDate是 x 轴的数据值,比如'2024-10-02'convertToPixel()把 "坐标点" 转成 "画布像素位置"- 返回的是竖线绘制的 x 坐标
获取图表高度范围,确定线的起止点:
js
const chartHeight = chartRef.value?.$el?.clientHeight || 300;
const yStart = 60;
const yEnd = chartHeight - 90;- 计算竖线上下端在画布中的像素位置。
- 顶部留 60px,底部留 90px,让线看起来不贴边。
创建一条虚线对象:
js
permanentSelectedLine = new echarts.graphic.Line({
  z: SELECTED_LINE_Z,
  shape: { x1: xPixel, y1: yStart, x2: xPixel, y2: yEnd },
  style: {
    stroke: "#666666",
    lineWidth: 1,
    lineDash: [5, 5]
  }
});
📌 这块非常关键:
- 调用了
echarts.graphic.Line------直接使用 ECharts 底层的图形类; - 生成一条线段;
shape决定起点终点;style决定样式;lineDash: [5,5]表示虚线;z控制层级(保证线上浮)。
这条线就是真正的「永久选中虚线」。
将虚线添加到图表画布内:
js
chartInstance.getZr().add(permanentSelectedLine);- 调用了 ECharts 的底层绘图引擎(ZRender)的
add()方法; - 这条线直接绘制在图上,不受 tooltip 控制、不会消失;