import numpy as np
from numpy.linalg import solve, norm
import matplotlib.pyplot as plt
from mpl_toolkits.mplot3d import Axes3D
# 设置中文显示
plt.rcParams["font.family"] = ["SimHei", "WenQuanYi Micro Hei", "Heiti TC"]
plt.rcParams["axes.unicode_minus"] = False # 正确显示负号
def find_circular_arc(A, B, C, num_points=100):
"""
计算空间中经过三点A、B、C的圆弧轨迹
参数:
A, B, C: 三维空间中的点,格式为numpy数组或列表
num_points: 生成的圆弧上的点的数量(包括A和C)
返回:
arc_points: 圆弧上的点组成的数组,形状为(num_points, 3)
center: 圆弧所在圆的圆心
radius: 圆弧的半径
"""
# 转换为numpy数组
A = np.array(A, dtype=np.float64)
B = np.array(B, dtype=np.float64)
C = np.array(C, dtype=np.float64)
# 检查三点是否共线
AB = B - A
AC = C - A
cross = np.cross(AB, AC)
if norm(cross) < 1e-10:
raise ValueError("三点共线,无法确定圆弧")
# 计算平面法向量(AB × AC)
n = cross / norm(cross) # 单位法向量
# 求解外接圆圆心:解线性方程组得到s和t
AB_dot_AB = np.dot(AB, AB)
AB_dot_AC = np.dot(AB, AC)
AC_dot_AC = np.dot(AC, AC)
# 右边的常数项
rhs = np.array([0.5 * AB_dot_AB, 0.5 * AC_dot_AC])
# 系数矩阵
mat = np.array([[AB_dot_AB, AB_dot_AC], [AB_dot_AC, AC_dot_AC]])
# 求解s和t
s, t = solve(mat, rhs)
# 计算圆心
center = A + s * AB + t * AC
# 计算半径
radius = norm(A - center)
# 计算三点相对于圆心的向量
OA = A - center
OB = B - center
OC = C - center
# 计算平面内的两个正交单位向量(用于角度计算)
u = OA / radius
v = np.cross(n, u) # 垂直于u且在平面内的单位向量
# 计算三点对应的角度
theta_A = 0.0 # A点作为角度起点
theta_B = np.arctan2(np.dot(OB, v), np.dot(OB, u))
theta_C = np.arctan2(np.dot(OC, v), np.dot(OC, u))
# 确保角度顺序正确(经过B点)
delta1 = theta_B - theta_A
delta2 = theta_C - theta_B
# 处理角度跨0点的情况
if delta1 < -np.pi:
delta1 += 2 * np.pi
elif delta1 > np.pi:
delta1 -= 2 * np.pi
if delta2 < -np.pi:
delta2 += 2 * np.pi
elif delta2 > np.pi:
delta2 -= 2 * np.pi
# 确定总角度范围
total_delta = delta1 + delta2
thetas = np.linspace(theta_A, theta_A + total_delta, num_points)
# 生成圆弧上的点
arc_points = [center + radius * (np.cos(theta) * u + np.sin(theta) * v) for theta in thetas]
return np.array(arc_points), center, radius
def plot_arc(A, B, C, arc_points, center):
"""绘制三点、圆弧和相关信息"""
fig = plt.figure(figsize=(10, 8))
ax = fig.add_subplot(111, projection='3d')
# 绘制圆弧
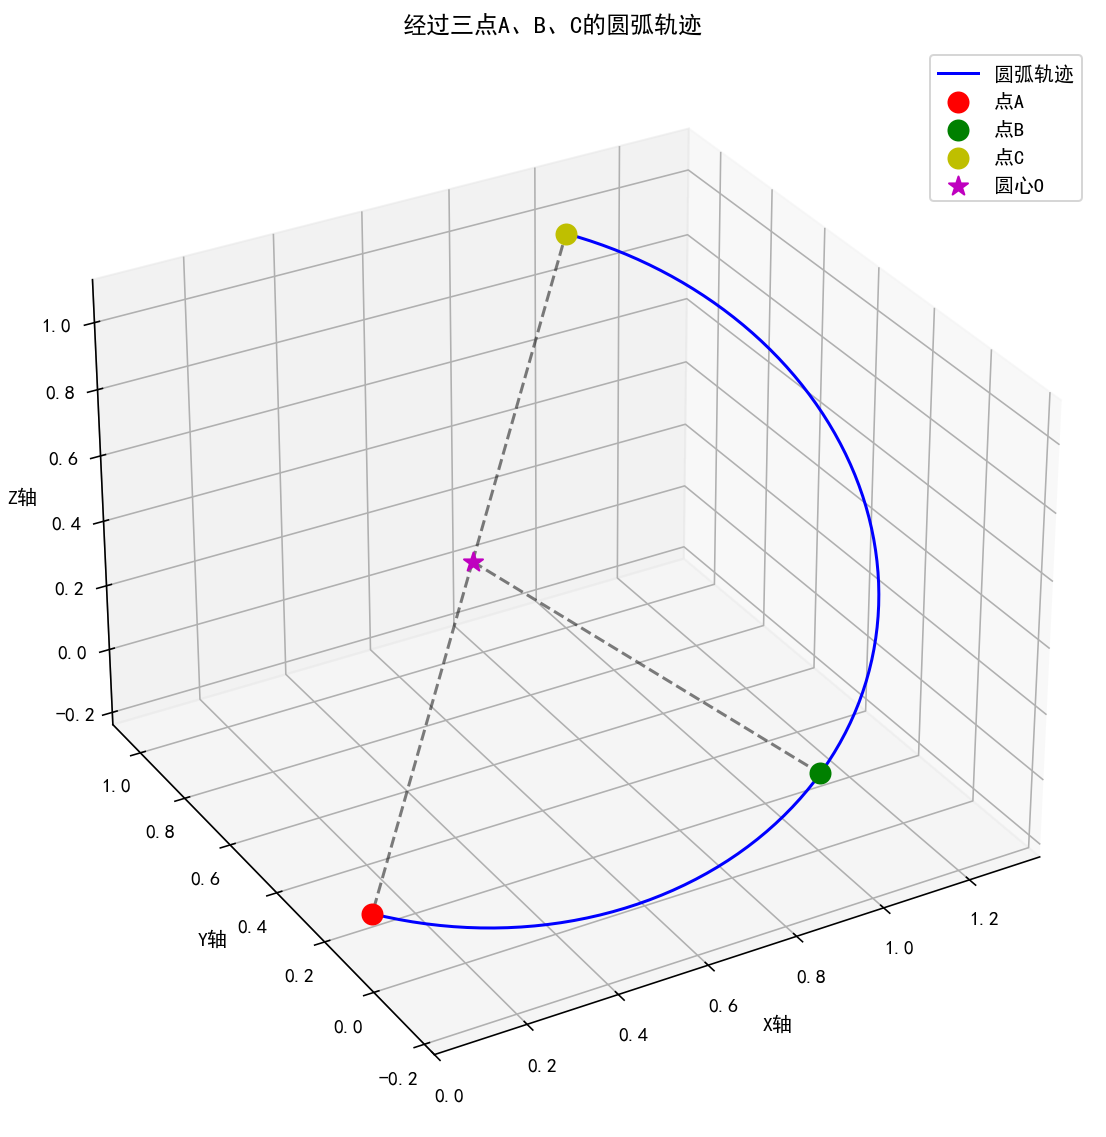
ax.plot(arc_points[:, 0], arc_points[:, 1], arc_points[:, 2], 'b-', label='圆弧轨迹')
# 绘制三点
ax.scatter(A[0], A[1], A[2], c='r', s=100, label='点A')
ax.scatter(B[0], B[1], B[2], c='g', s=100, label='点B')
ax.scatter(C[0], C[1], C[2], c='y', s=100, label='点C')
# 绘制圆心
ax.scatter(center[0], center[1], center[2], c='m', s=100, marker='*', label='圆心O')
# 绘制从圆心到三点的连线
ax.plot([center[0], A[0]], [center[1], A[1]], [center[2], A[2]], 'k--', alpha=0.5)
ax.plot([center[0], B[0]], [center[1], B[1]], [center[2], B[2]], 'k--', alpha=0.5)
ax.plot([center[0], C[0]], [center[1], C[1]], [center[2], C[2]], 'k--', alpha=0.5)
# 设置坐标轴标签
ax.set_xlabel('X轴')
ax.set_ylabel('Y轴')
ax.set_zlabel('Z轴')
# 添加标题和图例
ax.set_title('经过三点A、B、C的圆弧轨迹')
ax.legend()
# 调整视角
ax.view_init(elev=30, azim=-120)
# 使坐标轴比例一致
all_points = np.vstack([arc_points, A, B, C, center])
max_range = np.array([
all_points[:, 0].max() - all_points[:, 0].min(),
all_points[:, 1].max() - all_points[:, 1].min(),
all_points[:, 2].max() - all_points[:, 2].min()
]).max() / 2
mid_x = (all_points[:, 0].max() + all_points[:, 0].min()) / 2
mid_y = (all_points[:, 1].max() + all_points[:, 1].min()) / 2
mid_z = (all_points[:, 2].max() + all_points[:, 2].min()) / 2
ax.set_xlim(mid_x - max_range, mid_x + max_range)
ax.set_ylim(mid_y - max_range, mid_y + max_range)
ax.set_zlim(mid_z - max_range, mid_z + max_range)
plt.tight_layout()
plt.show()
# 示例用法
if __name__ == "__main__":
# 定义三个空间点(可修改为任意不共线的三维点)
A = [0, 0, 0]
B = [1, 0, 0]
C = [1, 1, 1] # 非平面示例,展示3D效果
try:
arc_points, center, radius = find_circular_arc(A, B, C, num_points=100)
print(f"圆心坐标: {center}")
print(f"圆弧半径: {radius:.6f}")
print(f"生成的圆弧点数量: {len(arc_points)}")
# 绘制图像
plot_arc(A, B, C, arc_points, center)
except ValueError as e:
print(e)