本文将分享一套基于Python的完整解决方案,通过模拟房子属性、天气变化和供暖能耗核心逻辑,生成数据集,并自动输出多维度可视化图表,助力居民供暖中暖气能耗数据算法开发和数据分析工作。
一、项目核心价值
本项目的核心价值在于:
- 高仿真度:基于物理散热原理和统计分布模拟数据,贴近真实场景
- 全流程自动化:从数据生成到可视化一键完成,无需人工干预
- 高度可配置:支持自定义房子数量、时间范围、随机种子等参数
- 中文友好:全程中文注释、中文图表标签,降低使用门槛
二、环境准备
首先安装项目依赖的Python库,推荐使用Python 3.8+版本:
bash
pip install numpy pandas matplotlib seaborn argparse pathlib核心依赖说明:
numpy:用于数值计算和随机数生成pandas:数据存储与处理matplotlib/seaborn:可视化图表生成argparse:命令行参数解析pathlib:文件路径管理
三、核心实现逻辑解析
整个项目代码按功能模块化设计,可分为「基础配置→数据模拟→可视化→主流程」四大模块,下面逐一拆解关键逻辑。
3.1 基础配置:绘图样式与中文支持
set_plot_style函数统一配置图表样式,解决中文显示乱码问题是关键:
python
def set_plot_style() -> None:
    """配置简洁的绘图样式,解决中文显示问题"""
    sns.set_theme(style="whitegrid", context="notebook", palette="deep")
    plt.rcParams["figure.figsize"] = (10, 6)  # 统一图表大小
    # 中文字体适配(兼容Windows/Linux/Mac)
    plt.rcParams['font.sans-serif'] = ['SimHei', 'Microsoft YaHei', 'DejaVu Sans']
    plt.rcParams['axes.unicode_minus'] = False  # 解决负号显示为方块的问题
3.2 数据模拟:三大核心模块
数据模拟是项目的核心,通过三个函数分别生成「房子属性数据」「天气数据」「供暖能耗数据」,确保各变量间的逻辑一致性。
3.2.1 房子属性模拟(simulate_households)
模拟每个房子的静态特征,基于真实统计规律设置参数:
- 建筑类型:公寓(55%)、独栋房屋(30%)、联排别墅(15%),符合城市住宅分布现状
- 房屋面积:按建筑类型设定均值和标准差(如公寓平均85㎡,标准差20㎡),确保数据合理分布
- 保温等级:1-5分随机分布(1分最差,5分最优)
- 供暖效率:公寓效率最高(0.85),独栋房屋最低(0.78),加入小幅随机波动
- 能源费率:围绕0.65元/kWh正态分布,限制在0.45-0.85元/kWh的合理区间
3.2.2 天气数据模拟(simulate_weather)
基于正弦曲线模拟季节性温度变化,贴近真实气候规律:
- 核心逻辑:用偏移正弦函数生成年度温度趋势(1月最冷,7月最热)
- 随机噪声:加入正态分布噪声(标准差3℃),模拟日常温度波动
- 输出:全年365天的每日室外温度数据
3.2.3 供暖能耗核心计算(simulate_heating_data)
这是整个项目的数学核心,基于热工原理计算能耗:
- 度日数(DD):当室外温度低于20℃(目标室内温度)时,才产生供暖需求
- 散热系数:由建筑类型和保温等级决定(独栋房屋散热快,保温越好散热越少)
- 能耗公式:
能耗 = 基线能耗 + (面积 × 散热系数 × 度日数) ÷ 供暖效率 - 行为噪声:加入随机波动,模拟用户使用习惯差异(如开窗、恒温器设定不同)
3.3 可视化模块:四大维度图表
自动生成4类专业图表,直观展示数据特征:
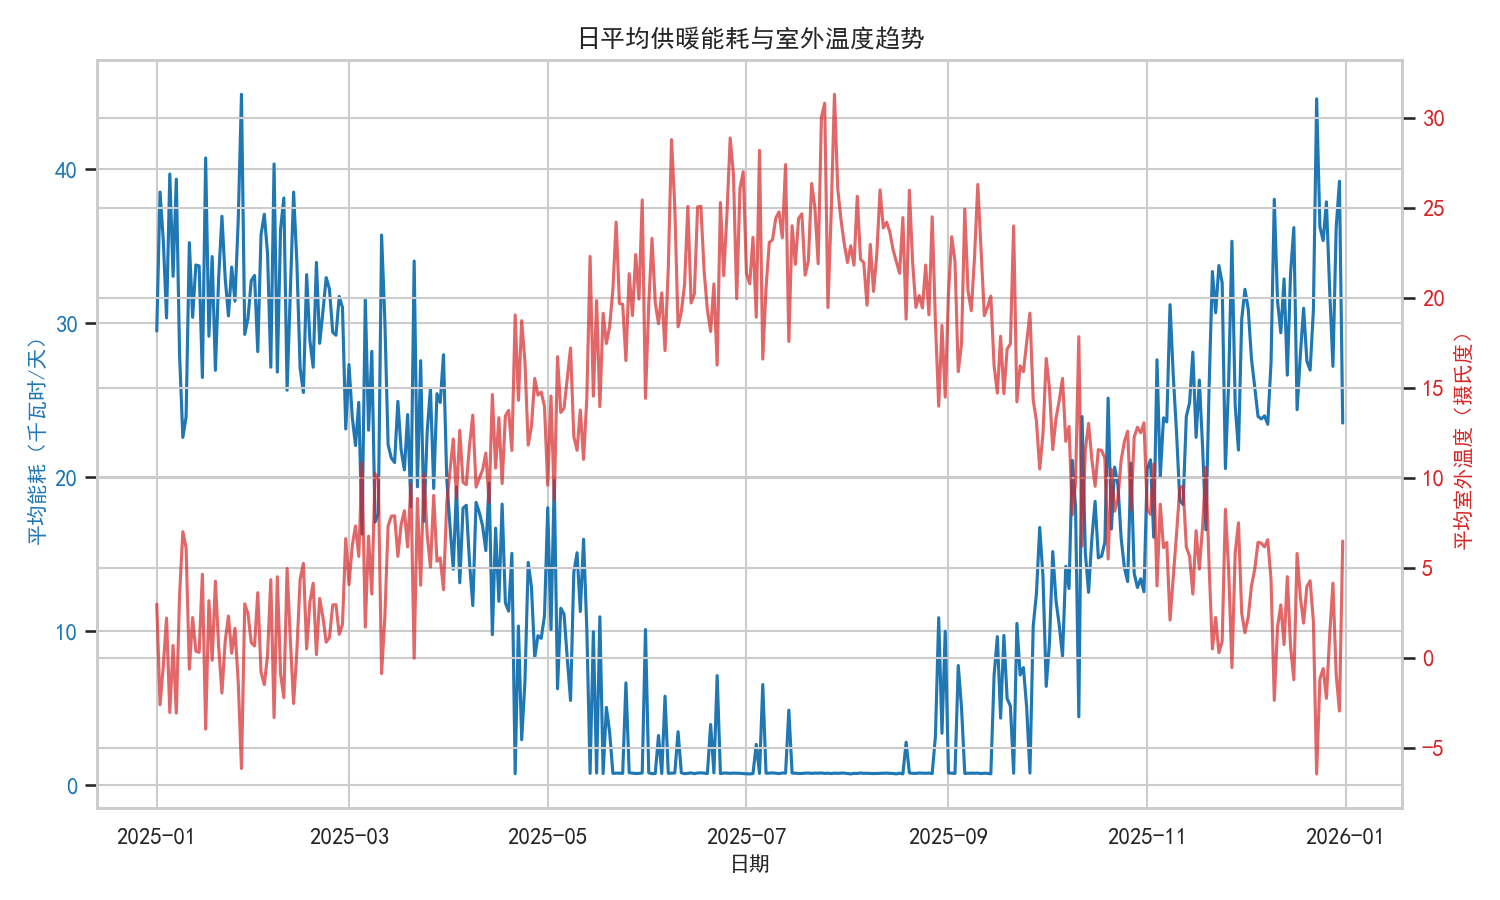
- 日平均能耗与温度趋势图:双轴图展示能耗随季节的变化规律
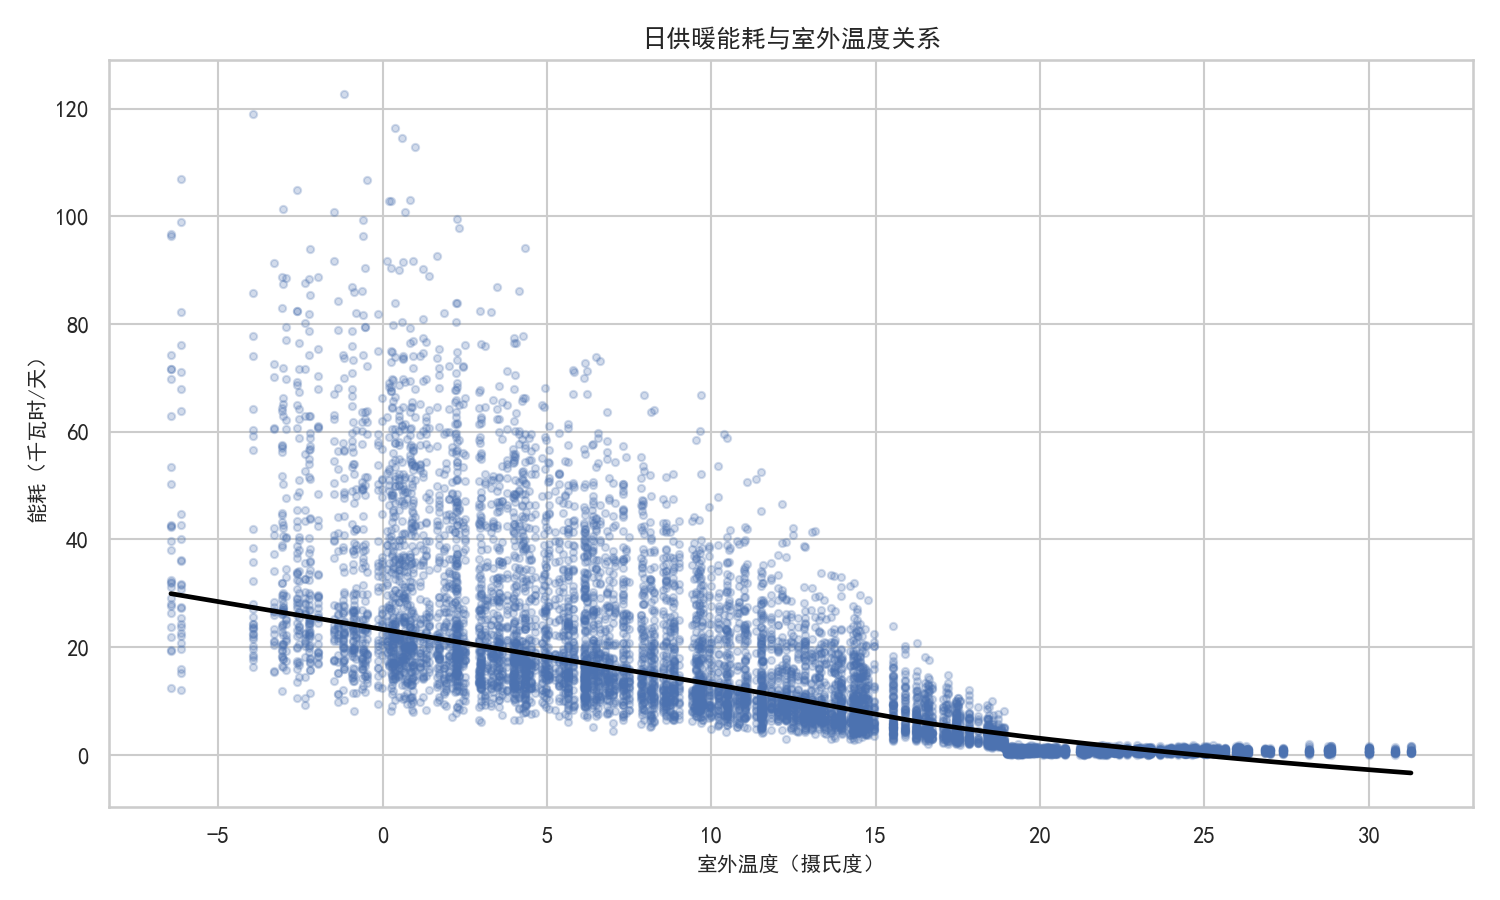
- 温度与能耗散点图:用LOWESS曲线拟合,清晰呈现二者负相关关系
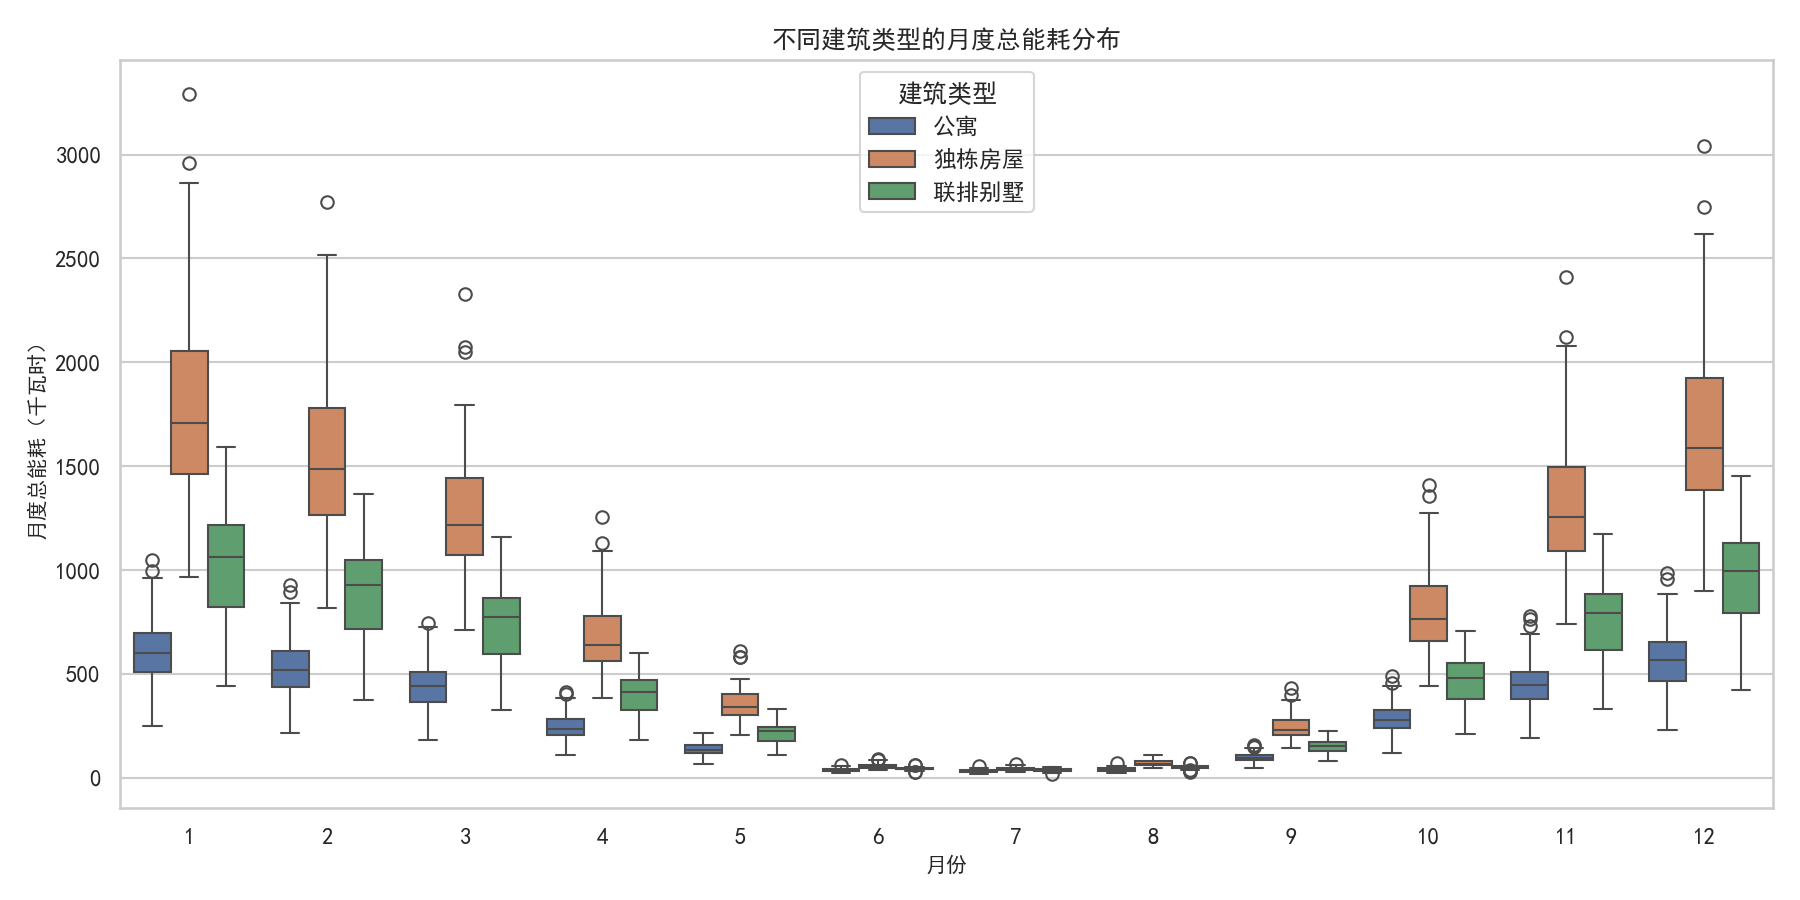
- 建筑类型月度能耗箱线图:对比不同户型的能耗分布差异
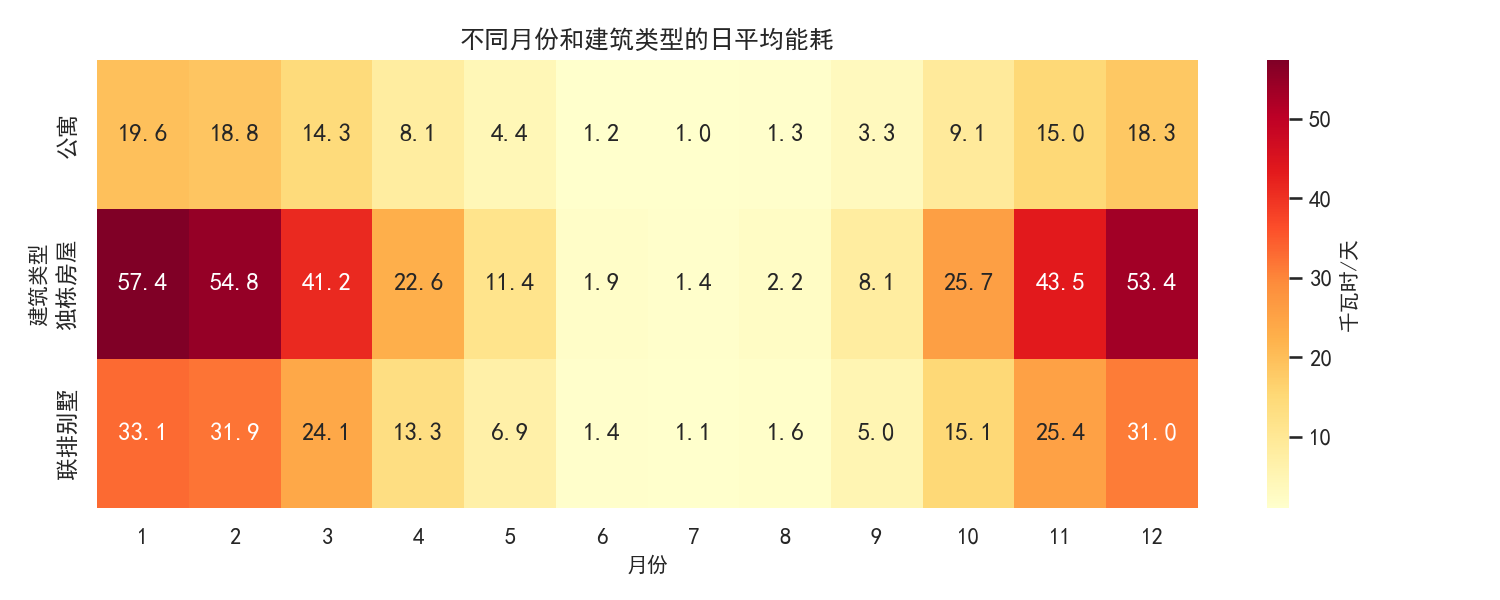
- 月份-建筑类型能耗热力图:热力图直观展示高能耗时段和户型
3.4 主流程:一键运行与参数配置
main函数整合所有模块,支持命令行参数配置:
--households:自定义模拟房子数量(默认200户)--seed:随机种子(默认7,确保结果可复现)--output:输出目录(默认output文件夹)--show:是否实时显示图表(默认不显示,仅保存文件)
四、使用教程
4.1 快速运行
将代码保存为heating_simulation.py,在终端执行:
bash
# 默认参数运行(200户,2025全年数据)
python heating_simulation.py

# 自定义参数:1000户房子,种子=42,显示图表
python heating_simulation.py --households 1000 --seed 42 --show
4.2 输出结果
运行成功后,输出目录将生成:
供暖数据.csv:包含73000+条记录(200户×365天),字段包括房子ID、建筑类型、面积、温度、能耗、费用等11个维度- 4张PNG格式图表:按编号排序,覆盖趋势、相关性、分布、热力图四大分析维度
五、数据示例与图表解读
5.1 数据集预览
| date | household_id | building_type | area_m2 | outdoor_temp_c | consumption_kwh | cost_cny |
|---|---|---|---|---|---|---|
| 2025-01-01 | 1 | 公寓 | 78.2 | -2.3 | 12.5 | 8.13 |
| 2025-01-01 | 2 | 独栋房屋 | 152.7 | -2.3 | 28.3 | 18.40 |
| 2025-01-02 | 1 | 公寓 | 78.2 | -1.8 | 11.9 | 7.74 |
5.2 关键图表解读
- 趋势图:冬季(1-2月、12月)能耗峰值明显,与温度变化完全反向
- 散点图:温度低于20℃后,能耗随温度降低呈指数增长
- 箱线图:独栋房屋月度能耗显著高于公寓,且波动更大
- 热力图:1月、12月的独栋房屋能耗最高(红色区域),7-8月各户型能耗均最低
五、完整代码(复制即可用)
python
from __future__ import annotations

import math
import random
from pathlib import Path
import argparse
from typing import List, Tuple

import numpy as np
import pandas as pd
import matplotlib.pyplot as plt
import seaborn as sns


def set_plot_style() -> None:
    """配置简洁的绘图样式。"""
    sns.set_theme(style="whitegrid", context="notebook", palette="deep")
    plt.rcParams["figure.figsize"] = (10, 6)
    plt.rcParams["axes.titlesize"] = 12
    plt.rcParams["axes.labelsize"] = 10
    plt.rcParams['font.sans-serif'] = ['SimHei', 'Microsoft YaHei', 'DejaVu Sans']
    plt.rcParams['axes.unicode_minus'] = False  # 解决负号'-'显示为方块


def simulate_households(num_households: int, rng: np.random.Generator) -> pd.DataFrame:
    """模拟房子静态属性数据。"""
    building_types = np.array(["公寓", "独栋房屋", "联排别墅"])
    building_probs = np.array([0.55, 0.30, 0.15])
    chosen_types = rng.choice(building_types, size=num_households, p=building_probs)

    # 按建筑类型划分的面积(平方米)
    area_means = {"公寓": 85, "独栋房屋": 160, "联排别墅": 120}
    area_stds = {"公寓": 20, "独栋房屋": 40, "联排别墅": 30}
    areas = np.array([
        max(35, rng.normal(area_means[bt], area_stds[bt]))
        for bt in chosen_types
    ])

    # 保温等级(1 差 - 5 优秀)
    insulation = rng.integers(1, 6, size=num_households)

    # 供暖系统效率(0-1)
    # 公寓效率较高,独栋房屋效率略低
    base_eff_by_type = {"公寓": 0.85, "独栋房屋": 0.78, "联排别墅": 0.82}
    efficiencies = np.array([
        min(0.97, max(0.6, base_eff_by_type[bt] + rng.normal(0.0, 0.05)))
        for bt in chosen_types
    ])

    # 电/气费率(元每千瓦时)
    tariffs = np.round(rng.normal(0.65, 0.07, size=num_households), 2)
    tariffs = np.clip(tariffs, 0.45, 0.85)

    return pd.DataFrame({
        "household_id": np.arange(1, num_households + 1),
        "building_type": chosen_types,
        "area_m2": areas,
        "insulation_rating": insulation,
        "efficiency": efficiencies,
        "tariff_cny_per_kwh": tariffs,
    })


def simulate_weather(dates: pd.DatetimeIndex, rng: np.random.Generator) -> pd.DataFrame:
    """模拟单个城市的季节性室外温度。"""
    day_of_year = dates.day_of_year.values
    # 季节性正弦曲线:最冷约在第15天,最热约在第200天(偏移正弦函数)
    seasonal = -12 * np.cos(2 * np.pi * (day_of_year - 15) / 365) + 12  # 温度范围大致在[-? , ?]
    noise = rng.normal(0, 3.0, size=len(dates))
    outdoor_temp_c = seasonal + noise
    return pd.DataFrame({"date": dates, "outdoor_temp_c": outdoor_temp_c})


def compute_heat_loss_factor(building_type: str, insulation_rating: int) -> float:
    """
    计算每平方米每摄氏度的散热系数(千瓦时/平方米/天/摄氏度)。
    独栋房屋散热更多,保温效果越好散热越少。
    """
    base_by_type = {"公寓": 0.18, "独栋房屋": 0.28, "联排别墅": 0.22}
    base = base_by_type.get(building_type, 0.22)
    insulation_adj = (6 - insulation_rating) * 0.02  # 保温越差 -> 散热越多
    return base + insulation_adj


def simulate_heating_data(
    start_date: str = "2025-01-01",
    end_date: str = "2025-12-31",
    num_households: int = 200,
    seed: int = 7,
) -> pd.DataFrame:
    """模拟多个房子的每日供暖能耗数据。"""
    rng = np.random.default_rng(seed)
    households = simulate_households(num_households, rng)
    dates = pd.date_range(start_date, end_date, freq="D")
    weather = simulate_weather(dates, rng)

    target_indoor_c = 20.0  # 目标室内温度(摄氏度)

    records: List[dict] = []
    for _, hh in households.iterrows():
        heat_loss_factor = compute_heat_loss_factor(
            str(hh["building_type"]), int(hh["insulation_rating"])
        )
        eff = float(hh["efficiency"])
        area = float(hh["area_m2"])
        tariff = float(hh["tariff_cny_per_kwh"])

        # 房子特定基线能耗(热水、循环、控制设备),单位:千瓦时/天
        baseline_kwh = max(0.4, rng.normal(0.8, 0.25))

        for _, w in weather.iterrows():
            outdoor = float(w["outdoor_temp_c"])

            # 供暖需求度日数(简化的日度日数计算)
            dd = max(0.0, target_indoor_c - outdoor)

            # 天气温暖时供暖需求时供暖需求极低或无
            if dd < 1.0:
                demand_kwh = baseline_kwh * rng.uniform(0.7, 1.2)
            else:
                # 能耗 ≈ 面积 × 散热系数 × 度日数 ÷ 系统效率
                structural_loss_kwh = area * heat_loss_factor * (dd / 24.0)
                demand_kwh = baseline_kwh + structural_loss_kwh / max(0.4, eff)
                # 行为差异调整(恒温器设定、开窗等因素)
                demand_kwh *= rng.normal(1.0, 0.08)

            # 限制噪声影响,确保能耗非负
            demand_kwh = max(0.0, demand_kwh + rng.normal(0.0, 0.2))

            records.append({
                "date": w["date"],
                "household_id": int(hh["household_id"]),
                "building_type": str(hh["building_type"]),
                "area_m2": area,
                "insulation_rating": int(hh["insulation_rating"]),
                "efficiency": eff,
                "tariff_cny_per_kwh": tariff,
                "outdoor_temp_c": outdoor,
                "consumption_kwh": demand_kwh,
                "cost_cny": demand_kwh * tariff,
            })

    df = pd.DataFrame.from_records(records)
    df["month"] = df["date"].dt.month
    return df


def ensure_output_dir(path: Path) -> None:
    """确保输出目录存在,不存在则创建。"""
    path.mkdir(parents=True, exist_ok=True)


def plot_daily_averages(df: pd.DataFrame, out_dir: Path, show: bool = False) -> Path:
    """绘制日平均能耗与温度趋势图。"""
    out_path = out_dir / "01_日平均值趋势图.png"
    daily = df.groupby("date", as_index=False).agg(
        avg_kwh=("consumption_kwh", "mean"),
        avg_temp=("outdoor_temp_c", "mean"),
    )
    fig, ax1 = plt.subplots()
    ax1.plot(daily["date"], daily["avg_kwh"], color="#1f77b4", label="平均能耗(千瓦时/天)")
    ax1.set_ylabel("平均能耗(千瓦时/天)", color="#1f77b4")
    ax1.tick_params(axis="y", labelcolor="#1f77b4")
    ax1.set_xlabel("日期")
    ax2 = ax1.twinx()
    ax2.plot(daily["date"], daily["avg_temp"], color="#d62728", alpha=0.7, label="平均温度(摄氏度)")
    ax2.set_ylabel("平均室外温度(摄氏度)", color="#d62728")
    ax2.tick_params(axis="y", labelcolor="#d62728")
    plt.title("日平均供暖能耗与室外温度趋势")
    fig.tight_layout()
    plt.savefig(out_path, dpi=150)
    if show:
        plt.show()
    plt.close(fig)
    return out_path


def plot_scatter_temp_vs_consumption(df: pd.DataFrame, out_dir: Path, show: bool = False) -> Path:
    """绘制温度与能耗散点图。"""
    out_path = out_dir / "02_温度与能耗散点图.png"
    # 采样以控制绘图规模
    if len(df) > 10000:
        df_plot = df.sample(10000, random_state=42)
    else:
        df_plot = df
    fig, ax = plt.subplots()
    sns.regplot(
        data=df_plot,
        x="outdoor_temp_c",
        y="consumption_kwh",
        lowess=True,
        scatter_kws={"alpha": 0.25, "s": 12},
        line_kws={"color": "black"},
        ax=ax,
    )
    ax.set_title("日供暖能耗与室外温度关系")
    ax.set_xlabel("室外温度(摄氏度)")
    ax.set_ylabel("能耗(千瓦时/天)")
    fig.tight_layout()
    plt.savefig(out_path, dpi=150)
    if show:
        plt.show()
    plt.close(fig)
    return out_path


def plot_box_monthly_by_building(df: pd.DataFrame, out_dir: Path, show: bool = False) -> Path:
    """绘制不同建筑类型的月度能耗箱线图。"""
    out_path = out_dir / "03_建筑类型月度能耗箱线图.png"
    monthly = df.groupby(["building_type", "month", "household_id"], as_index=False)["consumption_kwh"].sum()
    fig, ax = plt.subplots(figsize=(12, 6))
    sns.boxplot(
        data=monthly,
        x="month",
        y="consumption_kwh",
        hue="building_type",
        ax=ax,
    )
    ax.set_title("不同建筑类型的月度总能耗分布")
    ax.set_xlabel("月份")
    ax.set_ylabel("月度总能耗(千瓦时)")
    ax.legend(title="建筑类型")
    fig.tight_layout()
    plt.savefig(out_path, dpi=150)
    if show:
        plt.show()
    plt.close(fig)
    return out_path


def plot_heatmap_month_building(df: pd.DataFrame, out_dir: Path, show: bool = False) -> Path:
    """绘制月份-建筑类型能耗热力图。"""
    out_path = out_dir / "04_月份建筑类型能耗热力图.png"
    monthly_mean = df.groupby(["building_type", "month"], as_index=False)["consumption_kwh"].mean()
    pivot = monthly_mean.pivot(index="building_type", columns="month", values="consumption_kwh")
    fig, ax = plt.subplots(figsize=(10, 4))
    sns.heatmap(pivot, annot=True, fmt=".1f", cmap="YlOrRd", ax=ax, cbar_kws={"label": "千瓦时/天"})
    ax.set_title("不同月份和建筑类型的日平均能耗")
    ax.set_xlabel("月份")
    ax.set_ylabel("建筑类型")
    fig.tight_layout()
    plt.savefig(out_path, dpi=150)
    if show:
        plt.show()
    plt.close(fig)
    return out_path


def main() -> None:
    parser = argparse.ArgumentParser(description="模拟居民供暖数据并生成图表。")
    parser.add_argument("--households", type=int, default=200, help="要模拟的房子数量")
    parser.add_argument("--seed", type=int, default=7, help="随机种子")
    parser.add_argument("--output", type=str, default="output", help="CSV文件和图表的输出目录")
    parser.add_argument("--show", action="store_true", help="交互式显示图表")
    args = parser.parse_args()

    set_plot_style()
    print(f"正在模拟居民供暖数据... 房子数量={args.households}, 随机种子={args.seed}")
    df = simulate_heating_data(num_households=args.households, seed=args.seed)

    out_dir = Path(args.output)
    ensure_output_dir(out_dir)
    csv_path = out_dir / "供暖数据.csv"
    df.to_csv(csv_path, index=False, encoding="utf-8-sig")
    print(f"数据集已保存 -> {csv_path.resolve()}")

    print("正在生成图表...")
    paths = [
        plot_daily_averages(df, out_dir, show=args.show),
        plot_scatter_temp_vs_consumption(df, out_dir, show=args.show),
        plot_box_monthly_by_building(df, out_dir, show=args.show),
        plot_heatmap_month_building(df, out_dir, show=args.show),
    ]
    for p in paths:
        print(f"图表已保存 -> {p.resolve()}")
    print("完成。")


if __name__ == "__main__":
    main()