Prometheus+Grafana监控服务器及K8s集群资源
本文档详细介绍了如何在 Rocky Linux 8.5 系统上部署 Prometheus + Grafana,实现对服务器资源及 Kubernetes 集群组件可视化监控,内容包含环境准备、组件安装、配置优化、报警设置等。
一、环境信息概览
| IP | 主机名 | 内存/CPU | 安装软件 | 操作系统 | 架构 |
|---|---|---|---|---|---|
| 192.168.200.11 | k8s-master |
2C/2G/100G | node_exporter |
RockyLinux8.5 | X86 |
| 192.168.200.12 | k8s-node1 |
2C/2G/100G | node_exporter |
RockyLinux8.5 | X86 |
| 192.168.200.13 | k8s-node2 |
2C/2G/100G | node_exporter |
RockyLinux8.5 | X86 |
| 192.168.200.14 | prometheus |
2C/2G/100G | prometheus、pushgateway、prometheus、grafana-enterprise、node_exporter |
RockyLinux8.5 | X86 |
K8s部署参考:https://blog.csdn.net/weixin_45867513/article/details/144565165?spm=1011.2415.3001.5331
二、核心组件与端口说明
| 组件名称 | 软件包名称 | 版本 | 作用 | 默认端口 |
|---|---|---|---|---|
| Prometheus | prometheus-2.29.1.linux-amd64.tar.gz | v2.29.1 | 监控系统,负责拉取和存储数据 | 9090 |
| Node Exporter | node_exporter-1.2.2.linux-amd64.tar.gz | v1.2.2 | 收集服务器基础资源信息,比如 CPU 和内存 | 9100 |
| Pushgateway | pushgateway-1.4.1.linux-amd64.tar.gz | v1.4.1 | 提供"主动推送"监控数据的功能 | 9091 |
| Alertmanager | alertmanager-0.23.0.linux-amd64.tar.gz | v0.23.0 | 负责接收和发送告警通知,比如发邮件或钉钉 | 9093 |
| Grafana | grafana-enterprise-v12.0.0.linux-amd64.tar.gz | v12.0.0 | 图形化展示监控数据 | 3000 |
下载方式:
-
prometheus官网:https://prometheus.io/download/
-
grafana官网:https://grafana.com/grafana/download?pg=graf\&plcmt=deploy-box-1
-
百度网盘(含所有软件包):https://pan.baidu.com/s/18ekfed1AxZ8BmwO_bJHxNA 提取码: 4hzu
三、环境准备(104)
3.1 修改主机名 & 防火墙设置
shell
[root@localhost ~]# systemctl disable --now firewalld
[root@localhost ~]# hostnamectl set-hostname prometheus && bash
3.2 设置 Hosts 文件
bash
[root@prometheus ~]# cat >> /etc/hosts << EOF
192.168.200.11 k8s-master
192.168.200.12 k8s-node1
192.168.200.13 k8s-node2
192.168.200.14 prometheus
EOF
3.3 免密登录设置
bash
[root@prometheus ~]# ssh-keygen
[root@prometheus ~]# ssh-copy-id prometheus
[root@prometheus ~]# ssh-copy-id k8s-master01
[root@prometheus ~]# ssh-copy-id k8s-node01
[root@prometheus ~]# ssh-copy-id k8s-node02
3.4 时间同步配置
bash
yum install -y chrony
echo "server ntp.aliyun.com iburst" >> /etc/chrony.conf
systemctl enable --now chronyd
3.5 上传软件包
bash
mkdir -pv /data/software
cd /data/software
# 上传所有组件 tar.gz 包至该目录
四、安装 Prometheus 组件
4.1 Prometheus 安装
bash
[root@prometheus software]# tar -xf prometheus-2.29.1.linux-amd64.tar.gz -C /usr/local/配置文件:/usr/local/prometheus/prometheus.yml修改前备份文件
bash
    static_configs:                      #使用静态配置方式指定采集目标。
      - targets: ["localhost:9090"]      #Prometheus 自身的监控地址(默认端口 9090)
  - job_name: 'pushgateway'              #定义任务名称,用于标识该采集任务
    static_configs:
        - targets: ['192.168.200.14:9091']  # prometheus所在主机IP
          labels:
            instance: pushgateway
  - job_name: 'node exporter'
    static_configs:
        - targets: ['192.168.200.11:9100','192.168.200.12:9100','192.168.200.13:9100','192.168.200.14:9100']   #被采集的客户端ip,prometheus会从http://这这些ip/metrics拉取数据
这个配置文件主要定义了三类监控
Prometheus 自身:监控 Prometheus 服务的运行状态。
Push Gateway:接收短期作业推送的指标。
Node Exporter 集群:监控多台服务器的系统资源使用情况。
创建 systemd 服务:/etc/systemd/system/prometheus.service
bash
[Unit]
Description=Prometheus
After=network.target

[Service]
Type=simple
ExecStart=/usr/local/prometheus-2.29.1/prometheus --config.file=/usr/local/prometheus-2.29.1/prometheus.yml
WorkingDirectory=/usr/local/prometheus-2.29.1
Restart=always

[Install]
WantedBy=multi-user.target
启动服务:
bash
systemctl daemon-reload
systemctl enable --now prometheus
4.2 PushGateway安装
prometehes拉取数据是比较困难的,所以中间有一个中转站pushgateway,他更像是metric和prometehes的填充,prometehes会到pushgateway上去获取数据
shell
[root@prometheus prometheus-2.29.1]# cd /data/software/
[root@prometheus software]# tar -xf pushgateway-1.4.1.linux-amd64.tar.gz
[root@prometheus software]# mv pushgateway-1.4.1.linux-amd64 /usr/local/pushgateway-1.4.1创建服务:/etc/systemd/system/pushgateway.service
bash
[Unit]
Description=Pushgateway
After=network.target

[Service]
Type=simple
ExecStart=/usr/local/pushgateway-1.4.1/pushgateway --web.listen-address :9091
WorkingDirectory=/usr/local/pushgateway-1.4.1
Restart=always

[Install]
WantedBy=multi-user.target
启动服务:
bash
systemctl daemon-reload
systemctl enable --now pushgateway
4.3 Alermanager安装
这个软件主要用于报警
shell
[root@prometheus software]# tar -xf alertmanager-0.28.1.linux-amd64.tar.gz
[root@prometheus software]# mv alertmanager-0.28.1.linux-amd64 alertmanager-0.28.1创建服务:/etc/systemd/system/alertmanager.service
bash
[Unit]
Description=Alertmanager
After=network.target

[Service]
Type=simple
ExecStart=/usr/local/alertmanager-0.28.1/alertmanager --config.file=/usr/local/alertmanager-0.28.1/alertmanager.yml
WorkingDirectory=/usr/local/alertmanager-0.28.1
Restart=always

[Install]
WantedBy=multi-user.target
启动服务:
bash
systemctl daemon-reload
systemctl enable --now alertmanager
4.4 Node Exporter安装(所有节点)
安装到哪个node上就能获取哪个node的节点信息,prometheus通常会从暴露的HTTP服务地址(通常是/metrics)拉取监控样本数据,最终存放在自己时序数据库中
bash
[root@prometheus software]# tar -xf node_exporter-1.2.2.linux-amd64.tar.gz
[root@prometheus software]# mv node_exporter-1.2.2.linux-amd64 /usr/local/node_exporter-1.2.2
远程给其它主机
shell
[root@prometheus software]# cd /usr/local/
[root@prometheus local]# scp -r node_exporter-1.2.2/ k8s-master:/usr/local/
LICENSE                                    100%   11KB   6.3MB/s   00:00
NOTICE                                     100%  463   426.7KB/s   00:00
node_exporter                              100%   18MB  64.7MB/s   00:00
[root@prometheus local]# scp -r node_exporter-1.2.2/ k8s-node1:/usr/local/
LICENSE                                    100%   11KB   6.7MB/s   00:00
NOTICE                                     100%  463   211.1KB/s   00:00
node_exporter                              100%   18MB  66.2MB/s   00:00
[root@prometheus local]# scp -r node_exporter-1.2.2/ k8s-node2:/usr/local/
LICENSE                                    100%   11KB   5.9MB/s   00:00
NOTICE                                     100%  463   394.6KB/s   00:00
node_exporter 100% 18MB 83.0MB/s 00:00创建服务:/etc/systemd/system/node_exporter.service
bash
[root@prometheus local]# vim /etc/systemd/system/node_exporter.service

[Unit]
Description=node_export
Documentation=https://github.com/prometheus/node_exporter
After=network.target
[Service]
Type=simple
User=root
ExecStart= /usr/local/node_exporter-1.2.2/node_exporter
Restart=on-failure
[Install]
WantedBy=multi-user.target
远程给其它主机:
bash
#给其他主机传送
[root@prometheus local]# scp -r /etc/systemd/system/node_exporter.service k8s-master:/etc/systemd/system/
node_exporter.service                      100%  254   271.2KB/s   00:00
[root@prometheus local]# scp -r /etc/systemd/system/node_exporter.service k8s-node1:/etc/systemd/system/
node_exporter.service                      100%  254   199.4KB/s   00:00
[root@prometheus local]# scp -r /etc/systemd/system/node_exporter.service k8s-node2:/etc/systemd/system/
node_exporter.service                      100%  254   130.4KB/s   00:00
所有主机启动exporter服务
bash
[root@prometheus local]# systemctl enable --now node_exporter
[root@k8s-master ~]# systemctl enable --now node_exporter
[root@k8s-node1 ~]# systemctl enable --now node_exporter
[root@k8s-node2 ~]# systemctl enable --now node_exporter
所有主机访问9100端口:
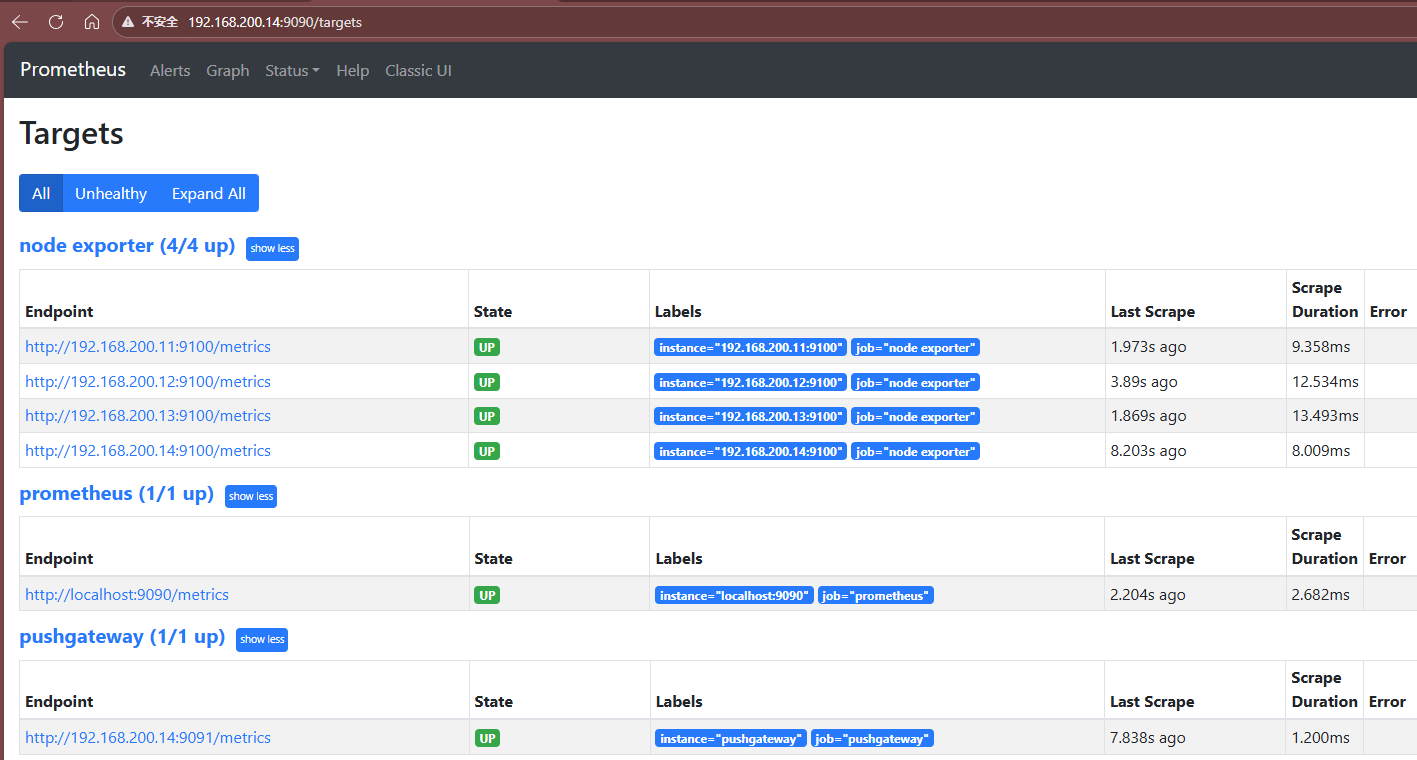
192.168.200.11:9100/metrics
192.168.200.12:9100/metrics
192.168.200.13:9100/metricss
192.168.200.14:9100/metrics
能访问该端口,表明目标主机上的 Node Exporter 服务已成功启动并正常监听 ,正在通过 http://IP:9100/metrics 提供数据供prometheus拉取。
启动prometheus和pushgateway
shell
systemctl daemon-reload
systemctl enable --now prometheus
systemctl enable --now pushgateway
访问prometheus服务端界面
五、Grafana 安装与使用
5.1 Grafana安装
shell
[root@prometheus software]# cd /data/software/
[root@prometheus software]# tar -xf grafana-enterprise-12.0.0.linux-amd64.tar.gz -C /usr/local/创建Granfana服务单元/etc/systemd/system/grafana.service
bash
[Unit]
Description=Grafana
After=network.target

[Service]
Type=simple
ExecStart=/usr/local/grafana-v12.0.0/bin/grafana-server web
WorkingDirectory=/usr/local/grafana-v12.0.0
Restart=always

[Install]
WantedBy=multi-user.target
bash
systemctl daemon-reload
systemctl enable --now grafana.service 访问地址:http://192.168.200.14:3000(默认账号密码:admin / admin) 首次登录需强制修改密码
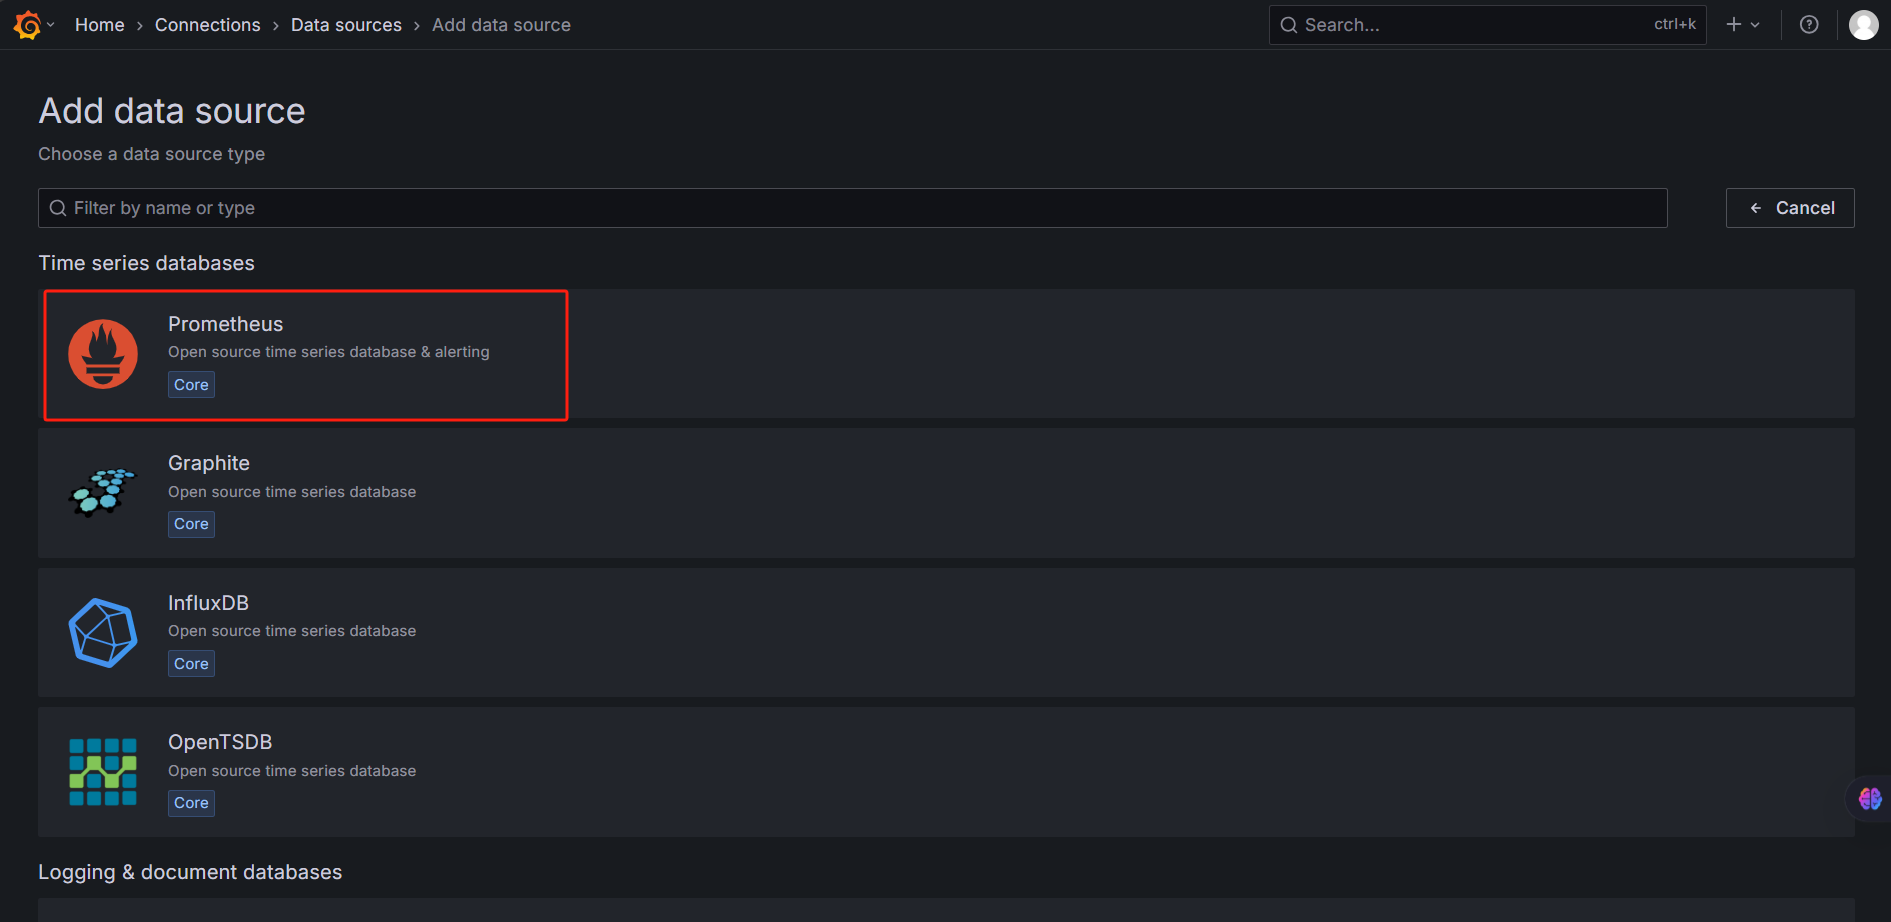
5.2 添加数据源
- 进入
Grafana→左侧菜单栏→Data sources - 添加 Prometheus 数据源,地址为:
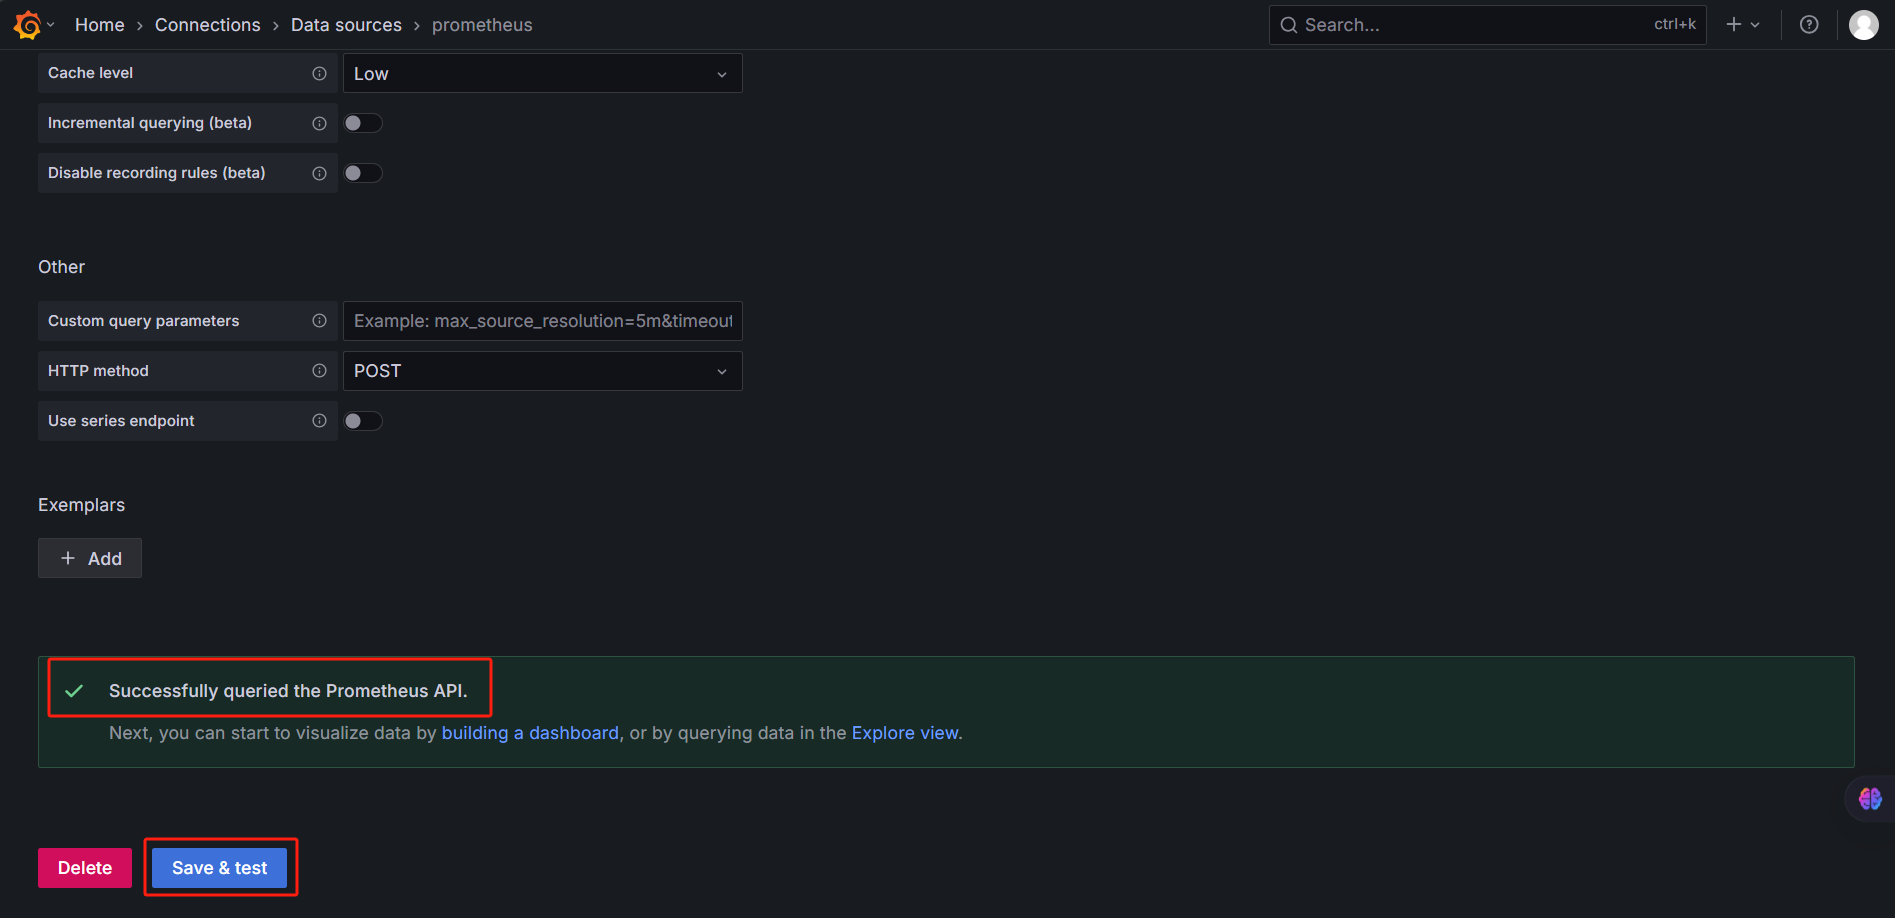
http://192.168.200.14:9090 - 点击 Save & Test 确认连接成功
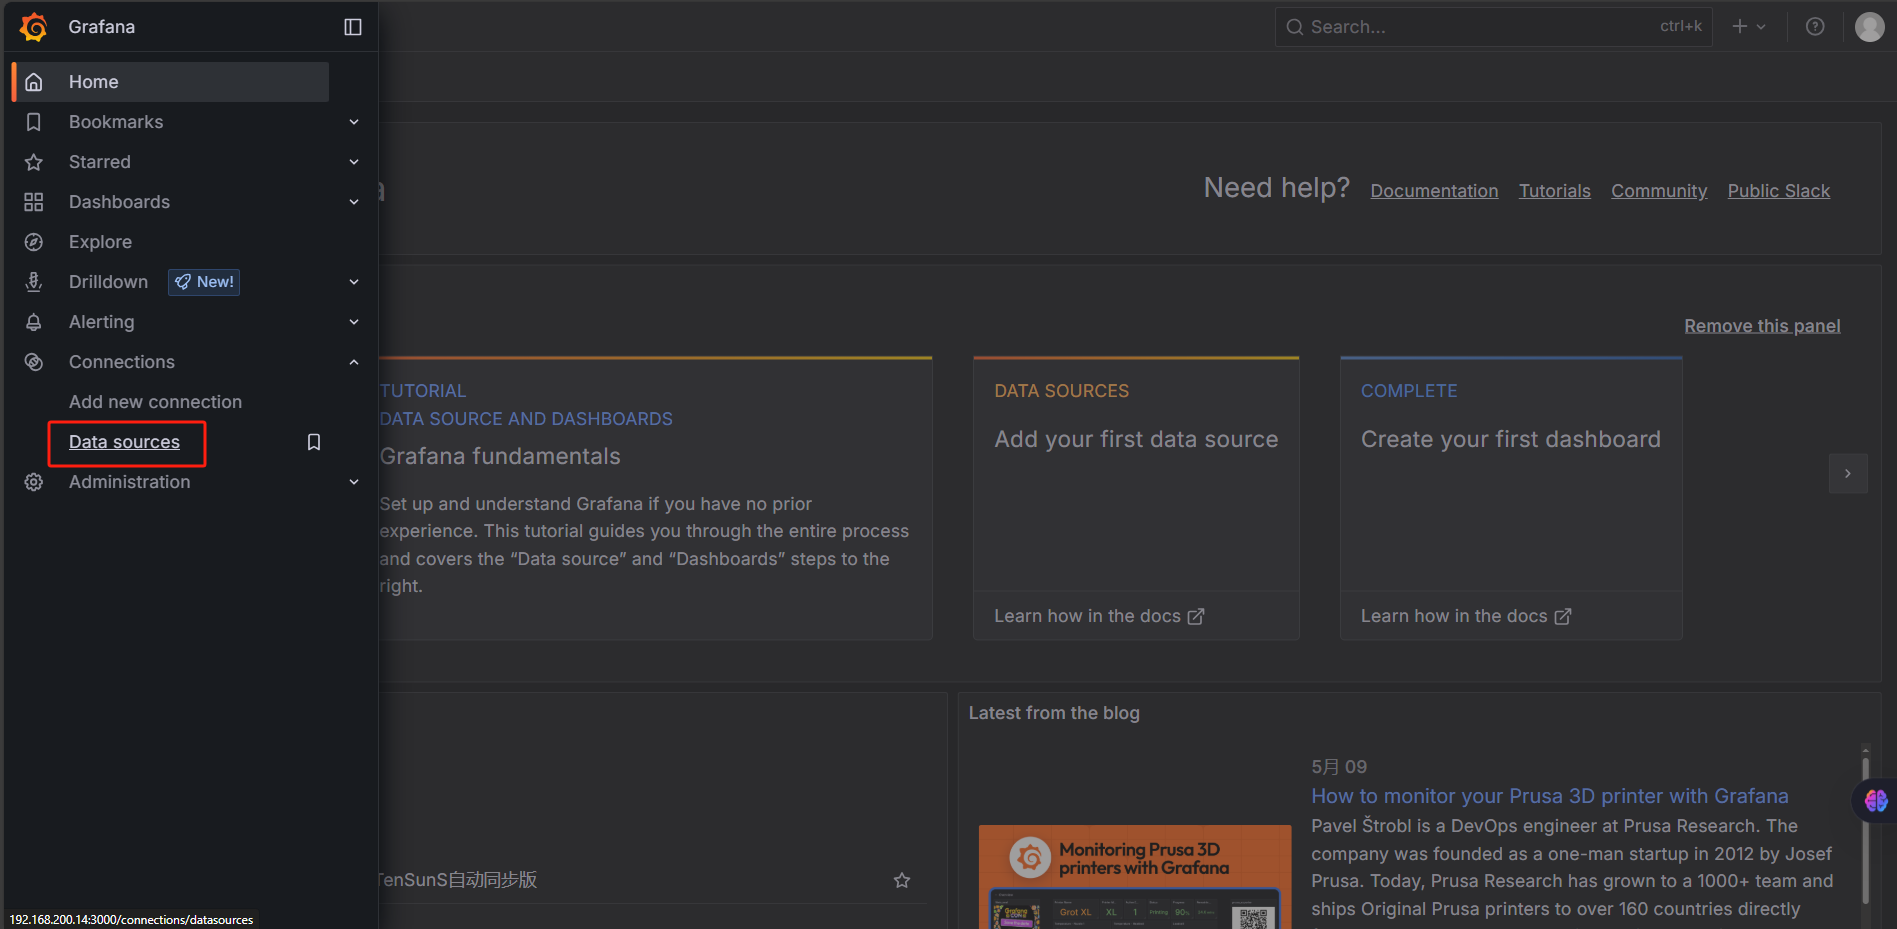
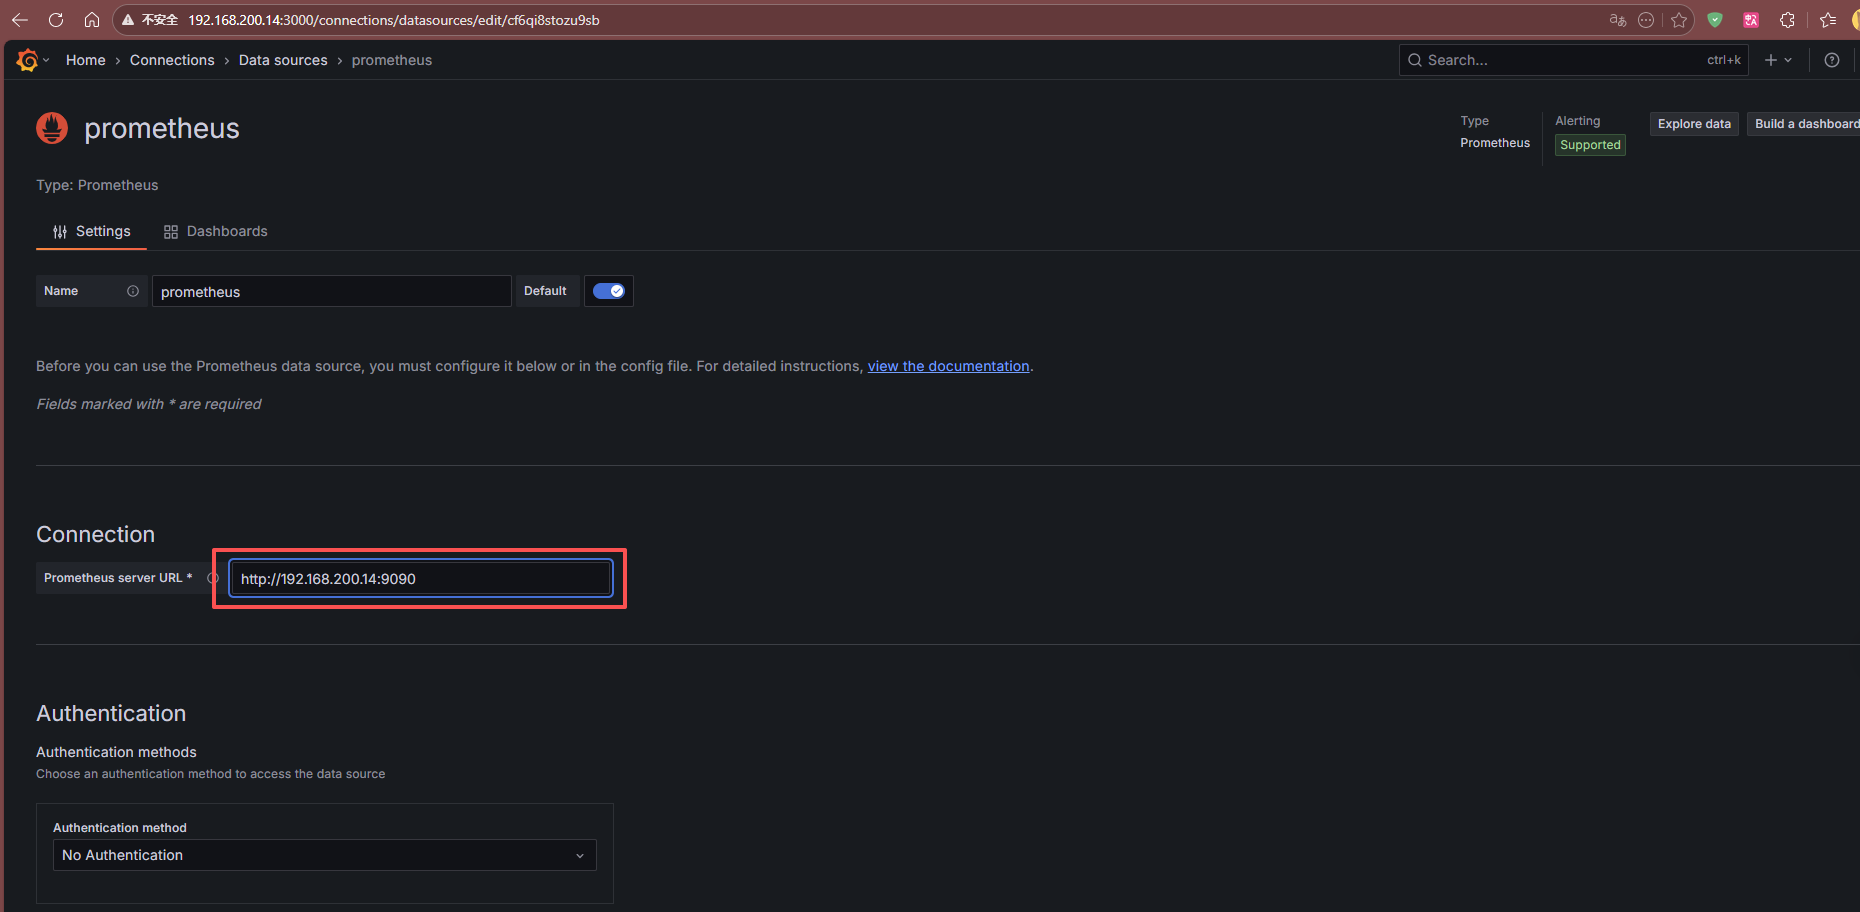
这个是prometheus服务器地址:http://192.168.200.14:9090 输入完成后点击下方的Save&test按钮
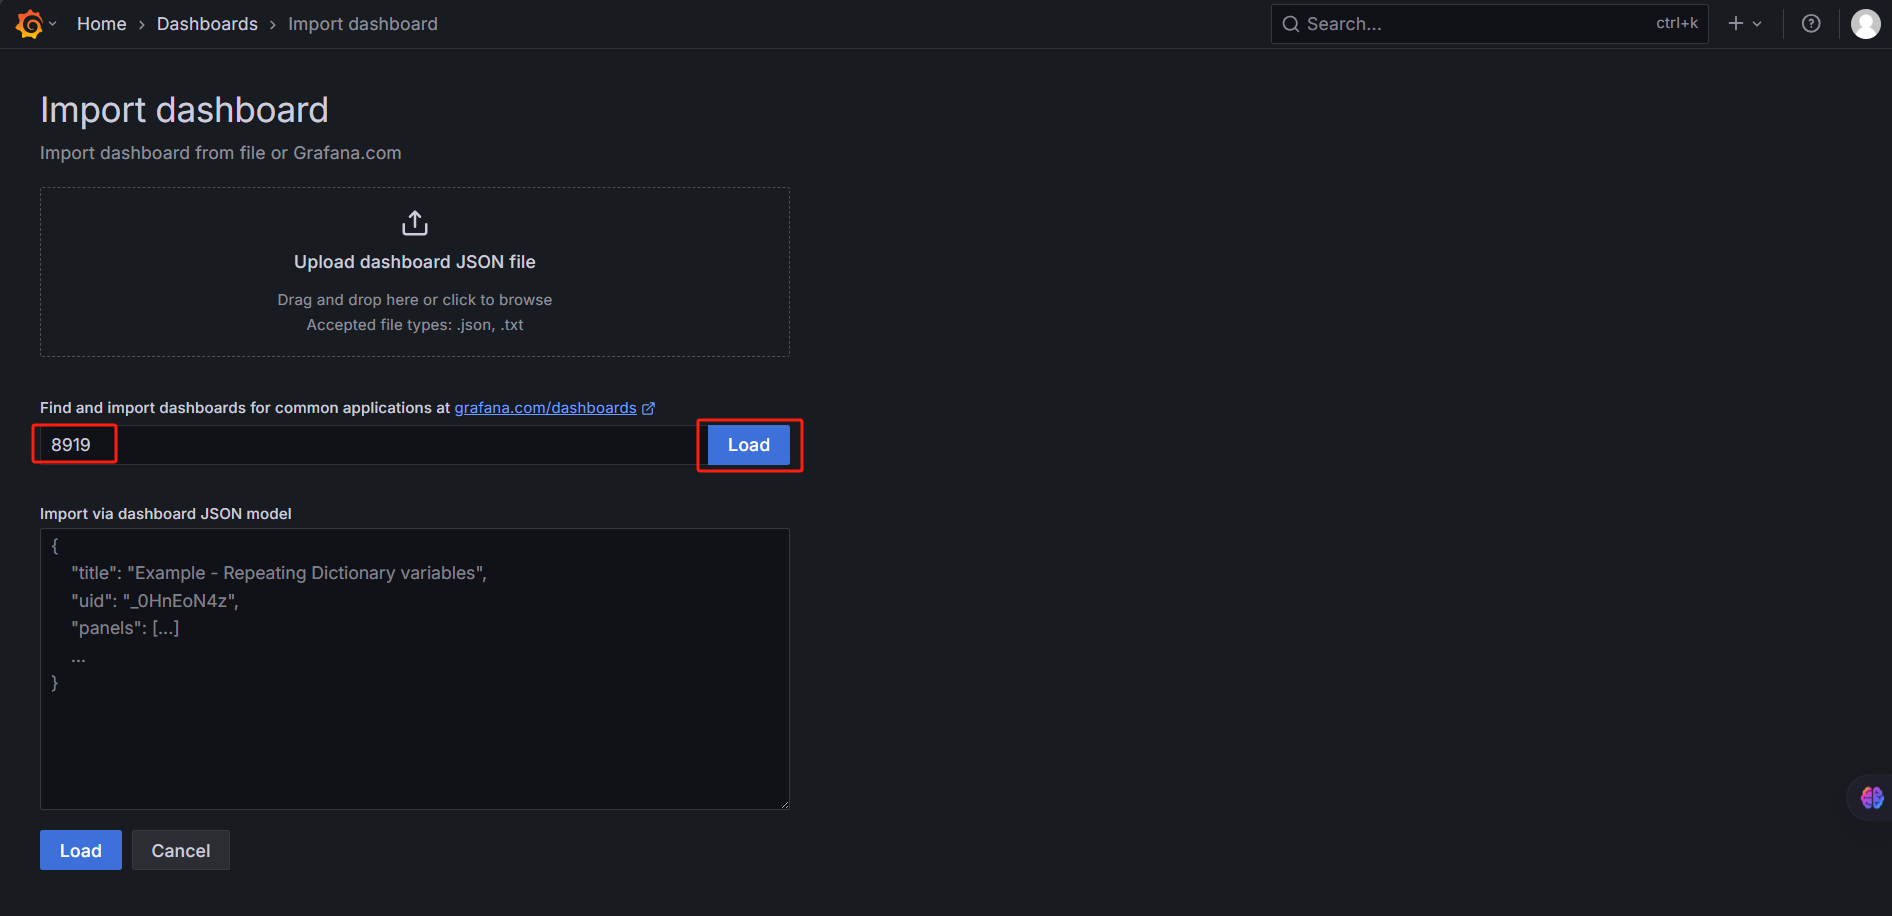
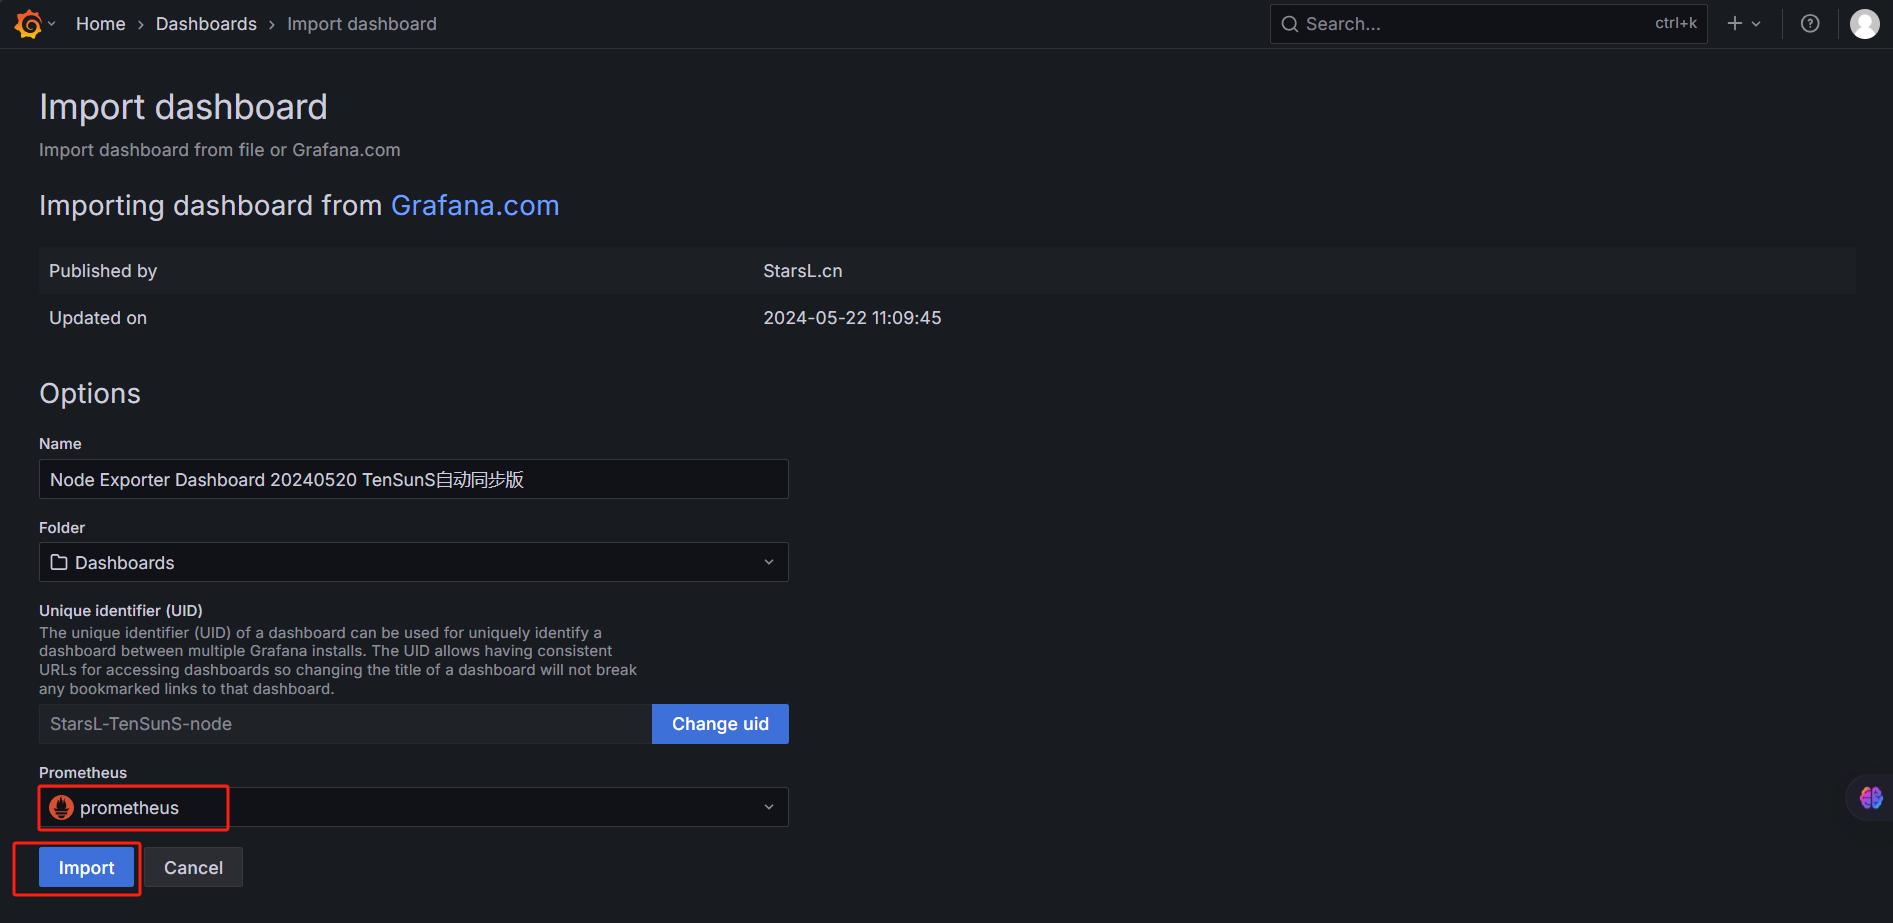
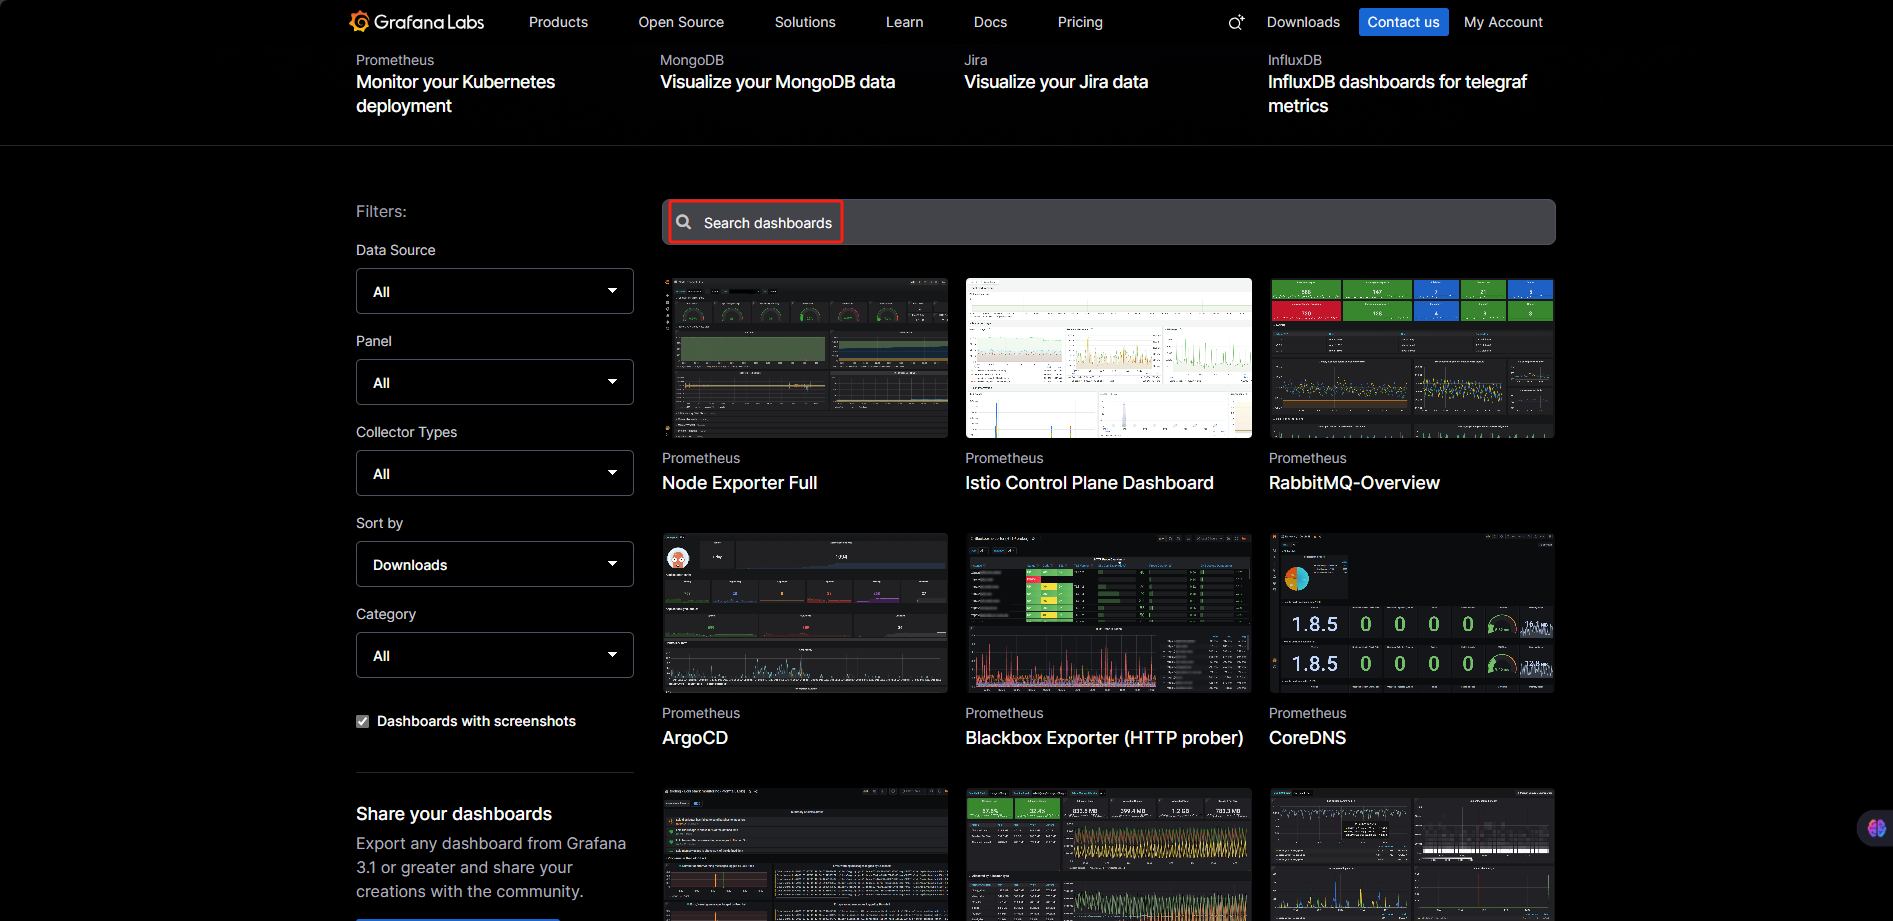
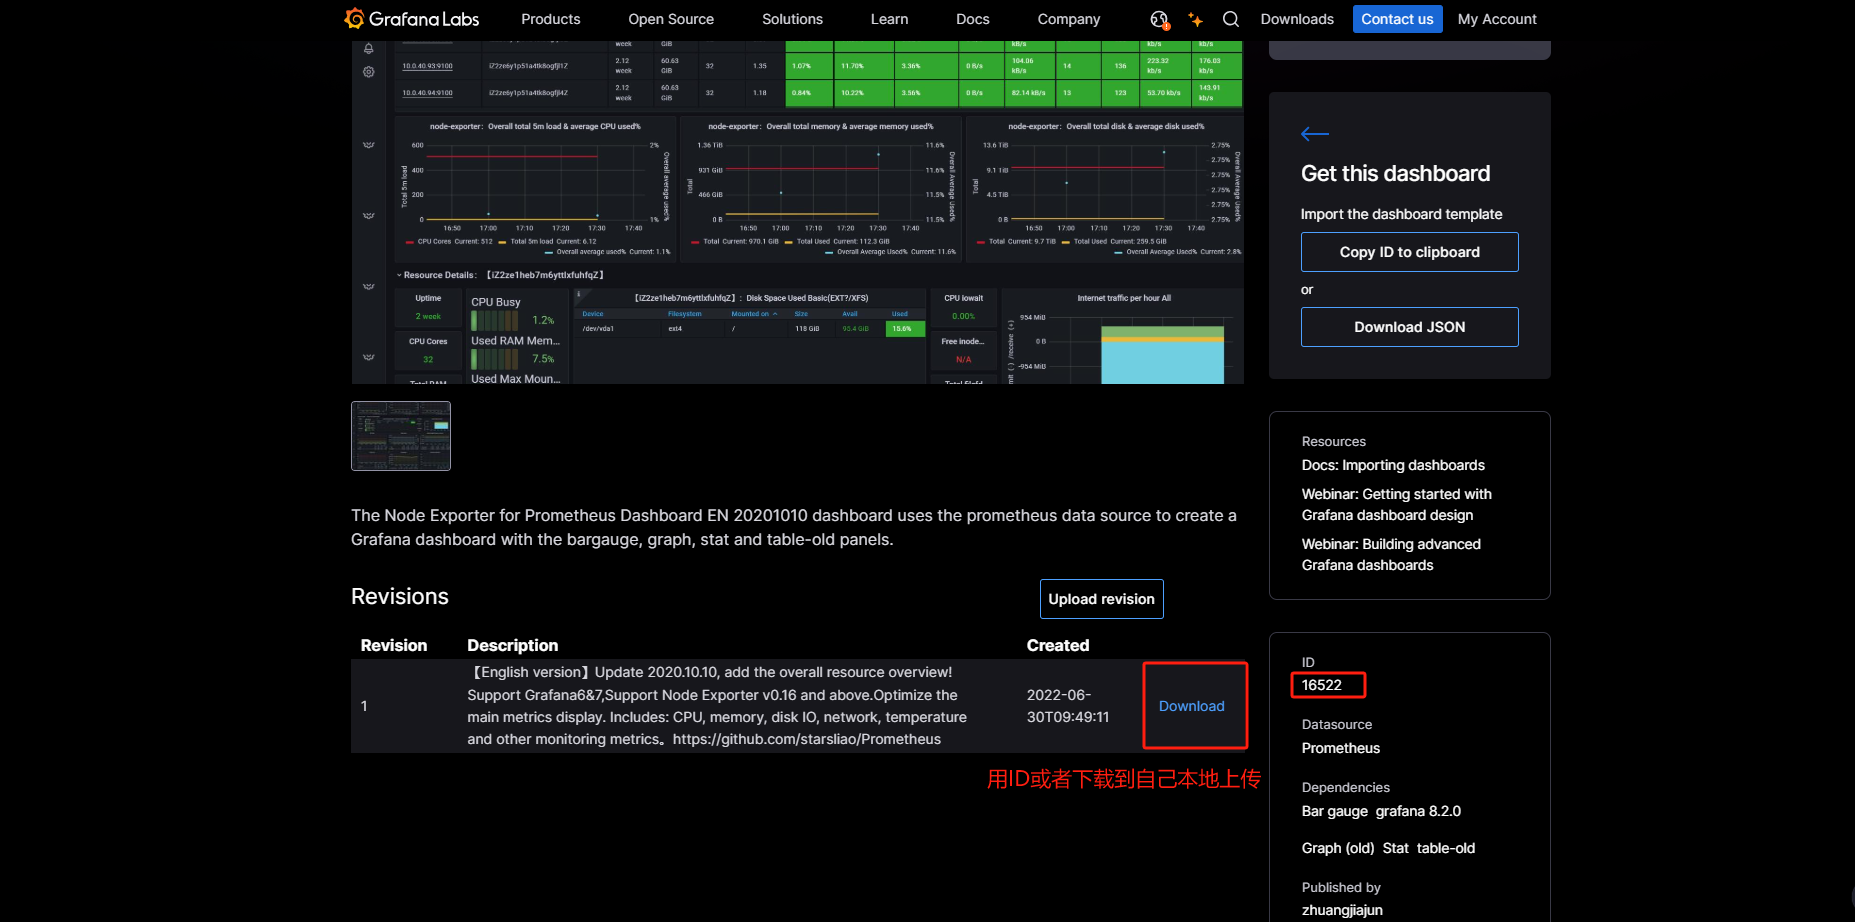
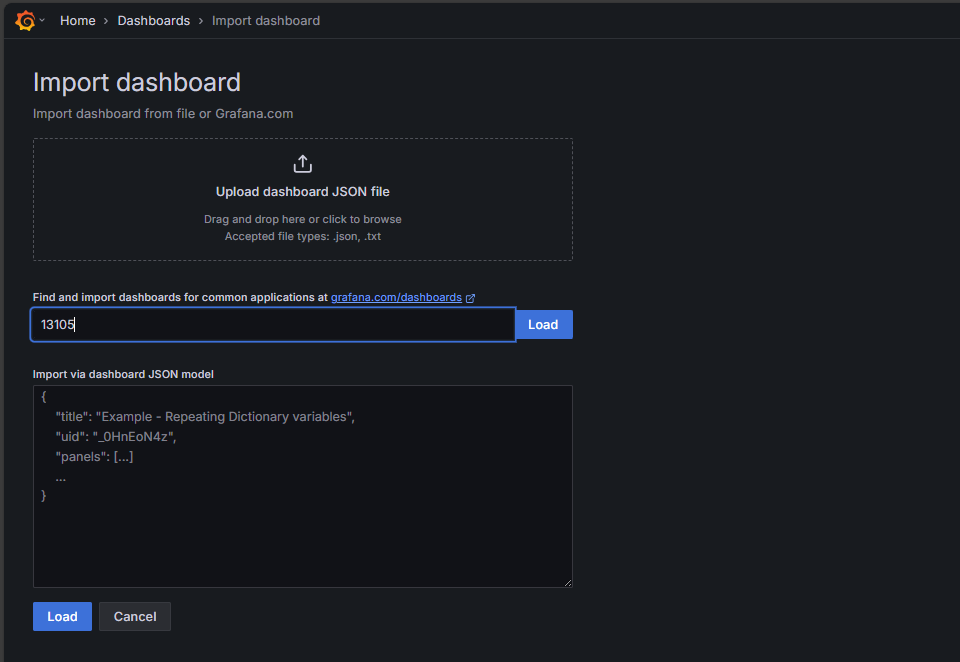
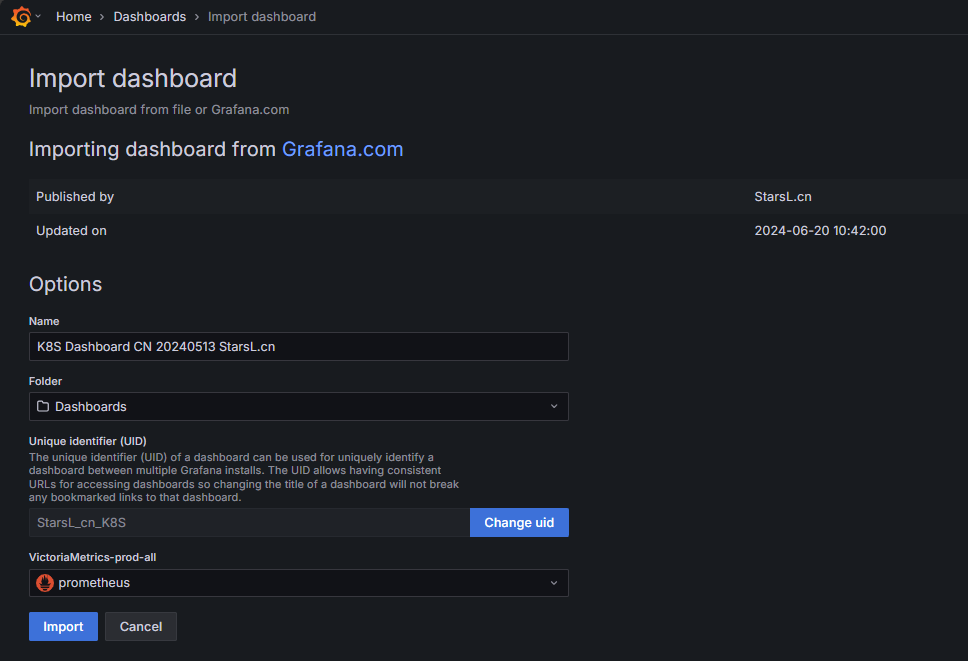
5.3 导入模板
点击右上角搜索按钮
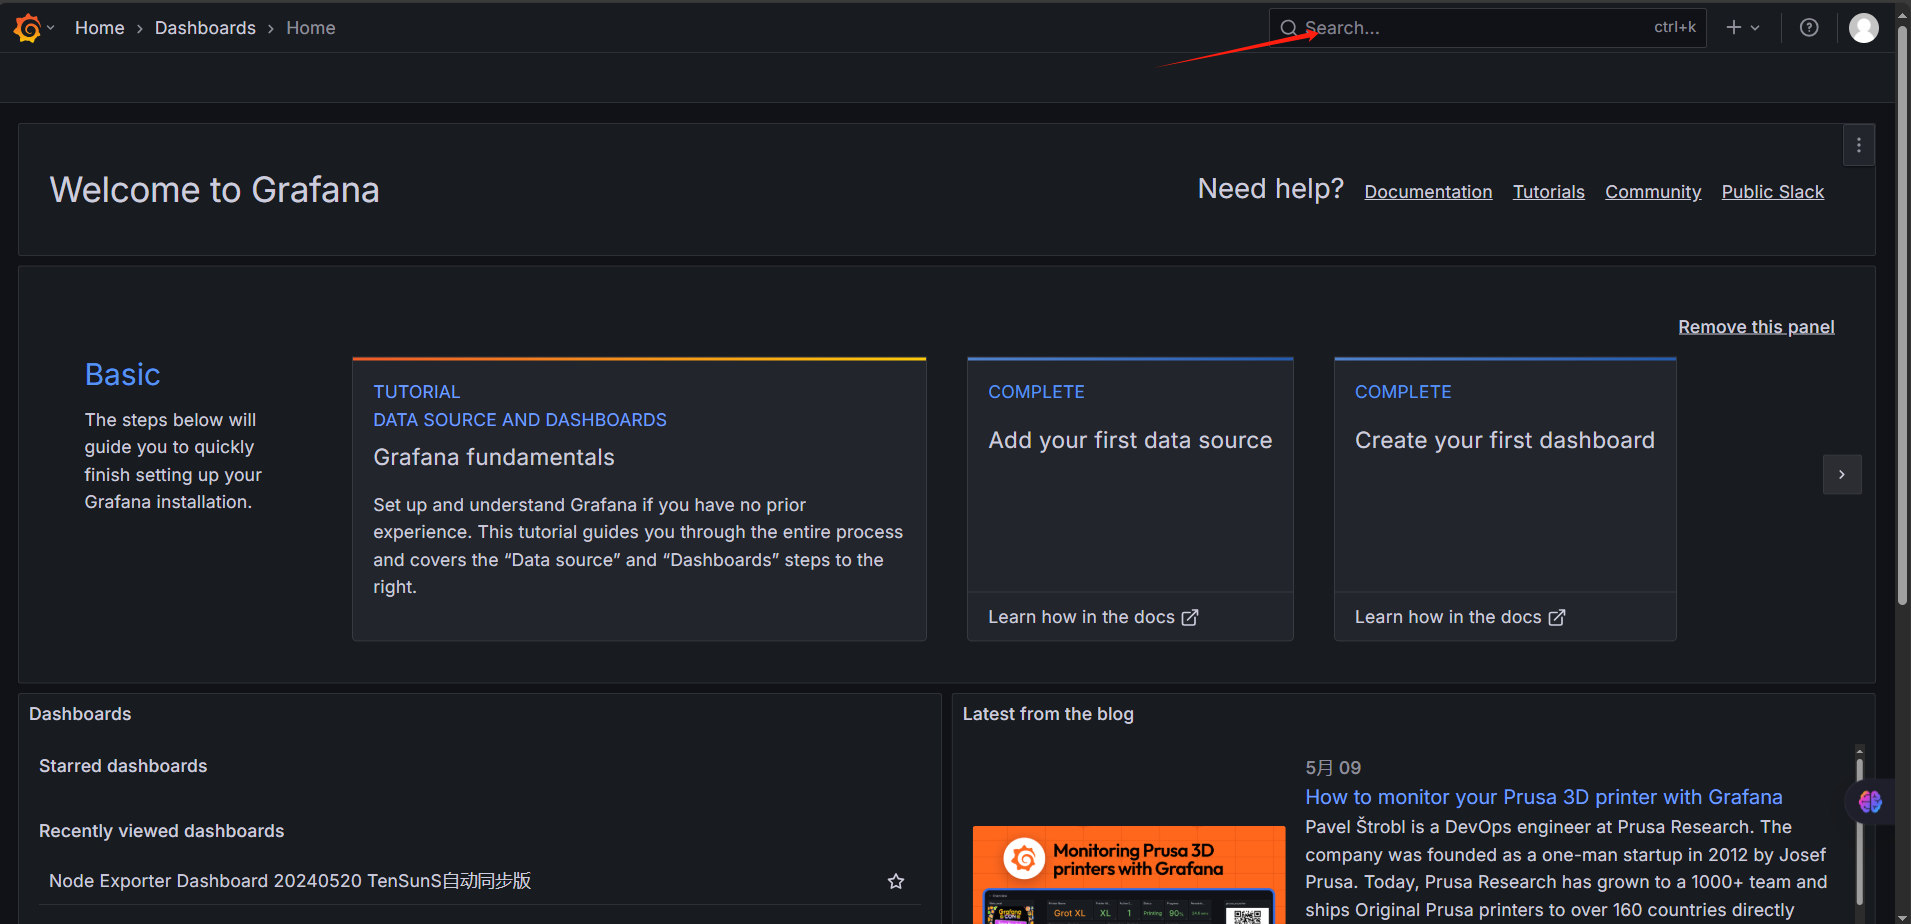
点击导入模板
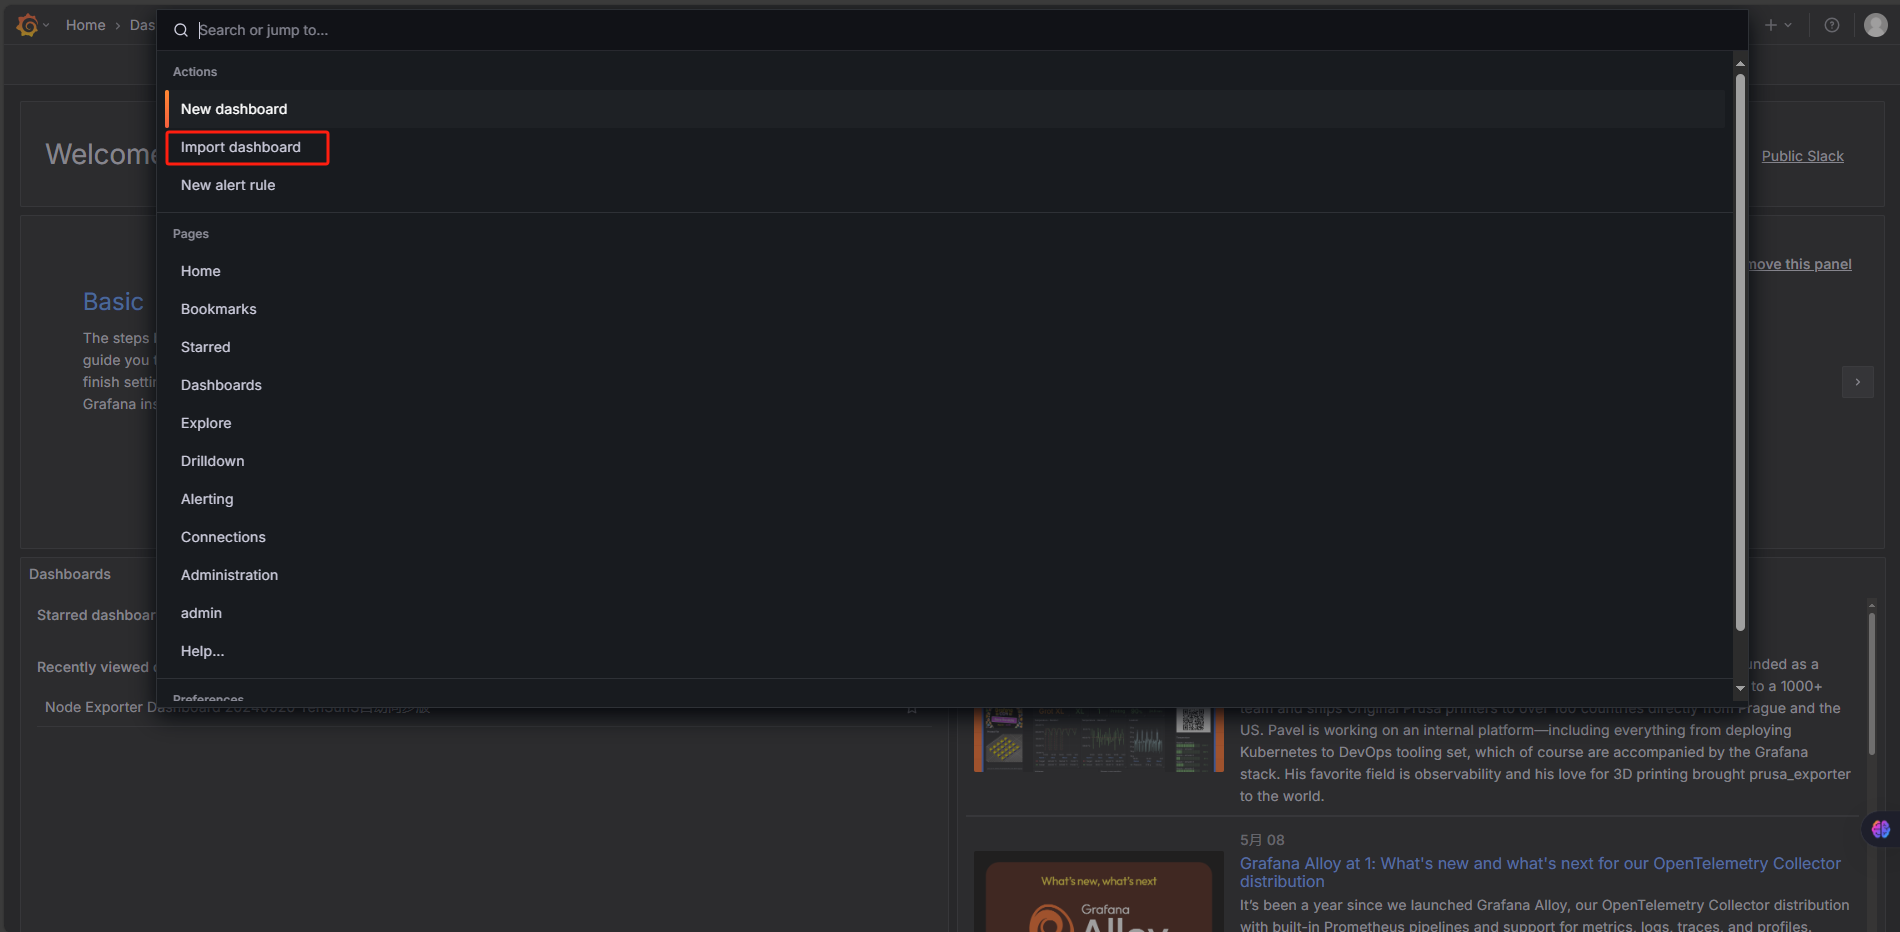
输入模板ID 8919 导入
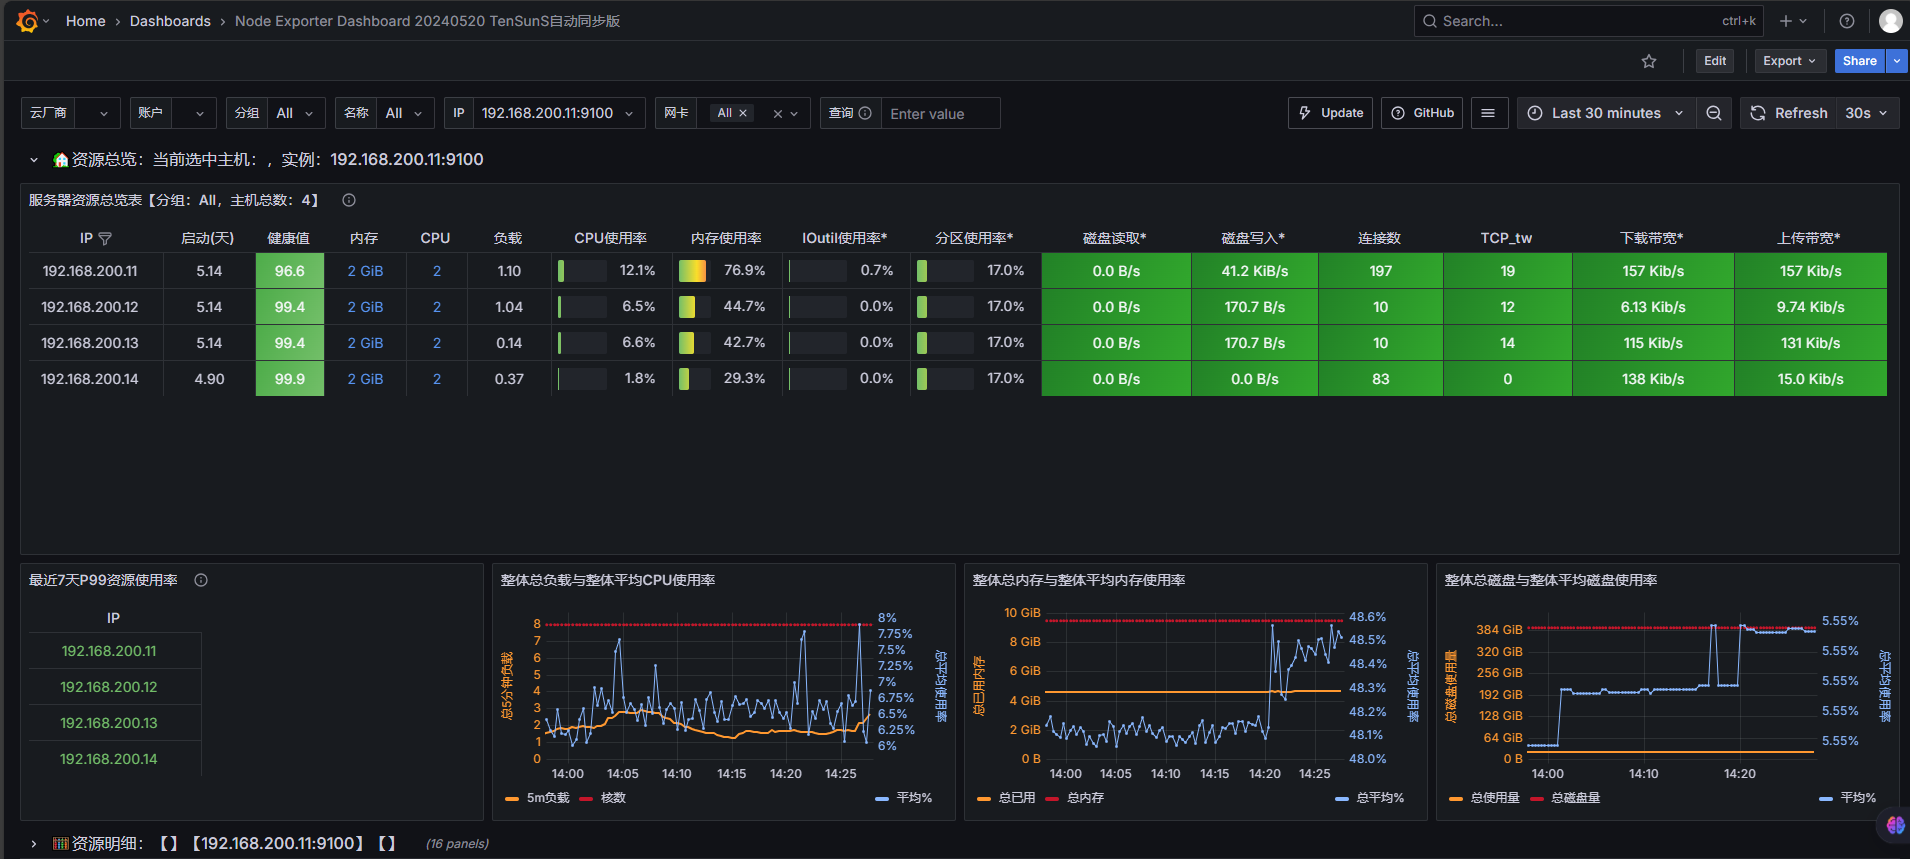
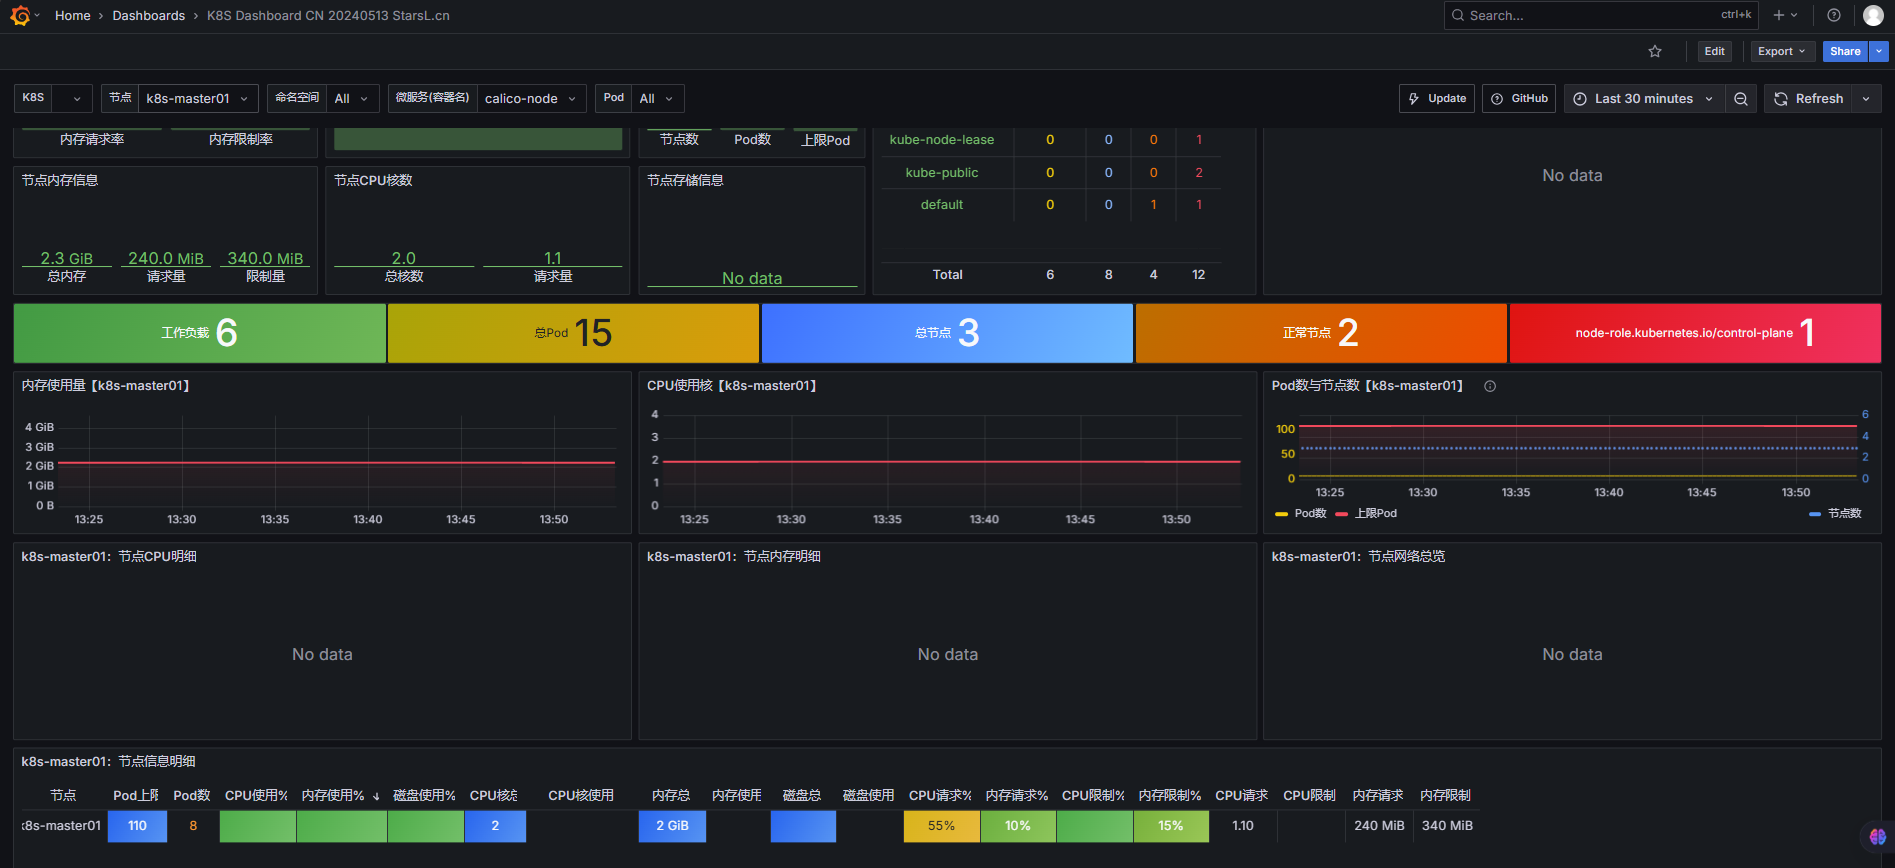
5.4 图形化数据展示
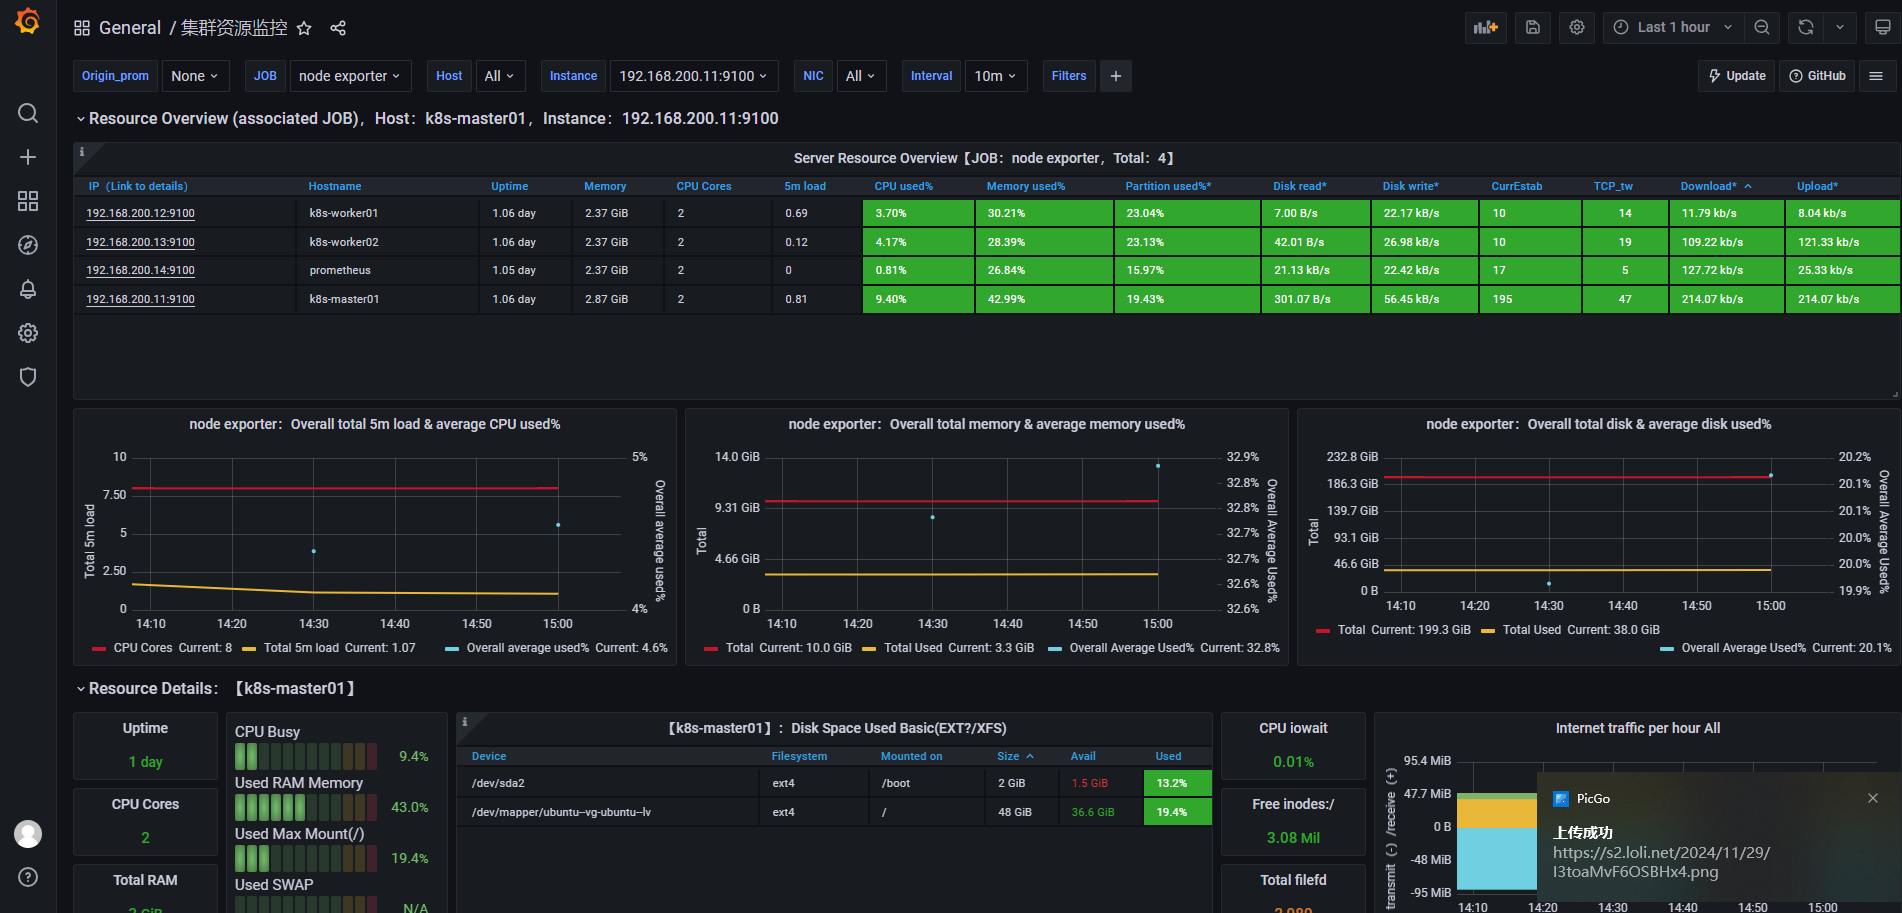
Grafana官网 https://grafana.com/grafana/dashboards/ 多个模板可供选择
六、Kubernetes 集群监控(kube-state-metrics 安装)
6.1 安装Kube-state-metrics服务
- 作用 :
通过监听 Kubernetes API Server,将集群内资源对象(Pod、Deployment、Service、Namespace、ConfigMap等)的状态转换为 Prometheus 可采集的时间序列指标。
yaml文件创建kube-state-metrics.yaml
yaml
apiVersion: rbac.authorization.k8s.io/v1
kind: ClusterRole
metadata:
  labels:
    app.kubernetes.io/component: exporter
    app.kubernetes.io/name: kube-state-metrics
    app.kubernetes.io/version: 1.9.0
  name: kube-state-metrics
rules:
- apiGroups:
  - ""
  resources:
  - configmaps
  - secrets
  - nodes
  - pods
  - services
  - serviceaccounts
  - resourcequotas
  - replicationcontrollers
  - limitranges
  - persistentvolumeclaims
  - persistentvolumes
  - namespaces
  - endpoints
  verbs:
  - list
  - watch
- apiGroups:
  - apps
  resources:
  - statefulsets
  - daemonsets
  - deployments
  - replicasets
  verbs:
  - list
  - watch
- apiGroups:
  - batch
  resources:
  - cronjobs
  - jobs
  verbs:
  - list
  - watch
- apiGroups:
  - autoscaling
  resources:
  - horizontalpodautoscalers
  verbs:
  - list
  - watch
- apiGroups:
  - authentication.k8s.io
  resources:
  - tokenreviews
  verbs:
  - create
- apiGroups:
  - authorization.k8s.io
  resources:
  - subjectaccessreviews
  verbs:
  - create
- apiGroups:
  - policy
  resources:
  - poddisruptionbudgets
  verbs:
  - list
  - watch
- apiGroups:
  - certificates.k8s.io
  resources:
  - certificatesigningrequests
  verbs:
  - list
  - watch
- apiGroups:
  - discovery.k8s.io
  resources:
  - endpointslices
  verbs:
  - list
  - watch
- apiGroups:
  - storage.k8s.io
  resources:
  - storageclasses
  - volumeattachments
  verbs:
  - list
  - watch
- apiGroups:
  - admissionregistration.k8s.io
  resources:
  - mutatingwebhookconfigurations
  - validatingwebhookconfigurations
  verbs:
  - list
  - watch
- apiGroups:
  - networking.k8s.io
  resources:
  - networkpolicies
  - ingressclasses
  - ingresses
  verbs:
  - list
  - watch
- apiGroups:
  - coordination.k8s.io
  resources:
  - leases
  verbs:
  - list
  - watch
- apiGroups:
  - rbac.authorization.k8s.io
  resources:
  - clusterrolebindings
  - clusterroles
  - rolebindings
  - roles
  verbs:
  - list
  - watch
---
apiVersion: rbac.authorization.k8s.io/v1
kind: ClusterRoleBinding
metadata:
  labels:
    app.kubernetes.io/component: exporter
    app.kubernetes.io/name: kube-state-metrics
    app.kubernetes.io/version: 1.9.0
  name: kube-state-metrics
roleRef:
  apiGroup: rbac.authorization.k8s.io
  kind: ClusterRole
  name: kube-state-metrics
subjects:
- kind: ServiceAccount
  name: kube-state-metrics
  namespace: kube-system
---
apiVersion: apps/v1
kind: Deployment
metadata:
  labels:
    app.kubernetes.io/component: exporter
    app.kubernetes.io/name: kube-state-metrics
    app.kubernetes.io/version: 1.9.0
  name: kube-state-metrics
  namespace: kube-system
spec:
  replicas: 1
  selector:
    matchLabels:
      app.kubernetes.io/name: kube-state-metrics
  template:
    metadata:
      labels:
        app.kubernetes.io/component: exporter
        app.kubernetes.io/name: kube-state-metrics
        app.kubernetes.io/version: 1.9.0
    spec:
      automountServiceAccountToken: true
      containers:
      - image: swr.cn-north-4.myhuaweicloud.com/ddn-k8s/registry.k8s.io/kube-state-metrics/kube-state-metrics:v2.9.2
        livenessProbe:
          httpGet:
            path: /healthz
            port: 8080
          initialDelaySeconds: 5
          timeoutSeconds: 5
        name: kube-state-metrics
        ports:
        - containerPort: 8080
          name: http-metrics
        - containerPort: 8081
          name: telemetry
        readinessProbe:
          httpGet:
            path: /
            port: 8081
          initialDelaySeconds: 5
          timeoutSeconds: 5
        securityContext:
          allowPrivilegeEscalation: false
          capabilities:
            drop:
            - ALL
          readOnlyRootFilesystem: true
          runAsNonRoot: true
          runAsUser: 65534
          seccompProfile:
            type: RuntimeDefault
      nodeSelector:
        kubernetes.io/os: linux
      serviceAccountName: kube-state-metrics
---
apiVersion: v1
automountServiceAccountToken: false
kind: ServiceAccount
metadata:
  labels:
    app.kubernetes.io/component: exporter
    app.kubernetes.io/name: kube-state-metrics
    app.kubernetes.io/version: 1.9.0
  name: kube-state-metrics
  namespace: kube-system
---
apiVersion: v1
kind: Service
metadata:
  labels:
    app.kubernetes.io/component: exporter
    app.kubernetes.io/name: kube-state-metrics
    app.kubernetes.io/version: 1.9.0
  name: kube-state-metrics
  namespace: kube-system
spec:
  type: NodePort
  ports:
  - name: http-metrics
    port: 9090
    protocol: TCP
    targetPort: http-metrics
    nodePort: 31031
  - name: telemetry
    port: 9091
    protocol: TCP
    targetPort: telemetry
    nodePort: 31032
  selector:
    app.kubernetes.io/name: kube-state-metrics
bash
kubectl apply -f kube-state-metrics.yaml
bash
#查看pod运行状态
[root@k8s-master01 ~]# kubectl get pod -A |grep kube-state-metrics
kube-system   kube-state-metrics-cc7d6998c-kjj4b        1/1     Running   0              20h

[root@k8s-master01 ~]# kubectl get svc -A |grep kube-state-metrics
kube-system   kube-state-metrics   NodePort    10.100.7.78     <none>        9090:31031/TCP,9091:31032/TCP   20h
bash
#修改prometheus.yml文件添加
 - job_name: "kube-state-metrics"
    static_configs:
            - targets: ['192.168.200.11:31031']

#重启prometheus
systemctl restart prometheus
6.2 模板导入
七、邮箱报警
7.1 Alertmanager邮箱配置
bash
cp /usr/local/alertmanager-0.28.1/alertmanager.yml{,.bak}

vim
编辑 /usr/local/alertmanager-0.28.1/alertmanager.yml
这个文档使用163邮箱报警
yaml
global:
smtp_smarthost: 'smtp.163.com:465'
smtp_from: 'jin1205577136@163.com'
smtp_auth_username: 'jin1205577136@163.com'
smtp_auth_password: 'PTbz4G4WEstghuh7'
smtp_require_tls: false
templates:
- '/usr/local/alertmanager-0.28.1/custom.tmpl'
route:
receiver: '邮件接收人'
group_wait: 0s
group_interval: 30s
repeat_interval: 300s
receivers:
- name: '邮件接收人'
email_configs:
- to: 'jin1205577136@163.com' #多个收件人用逗号分隔
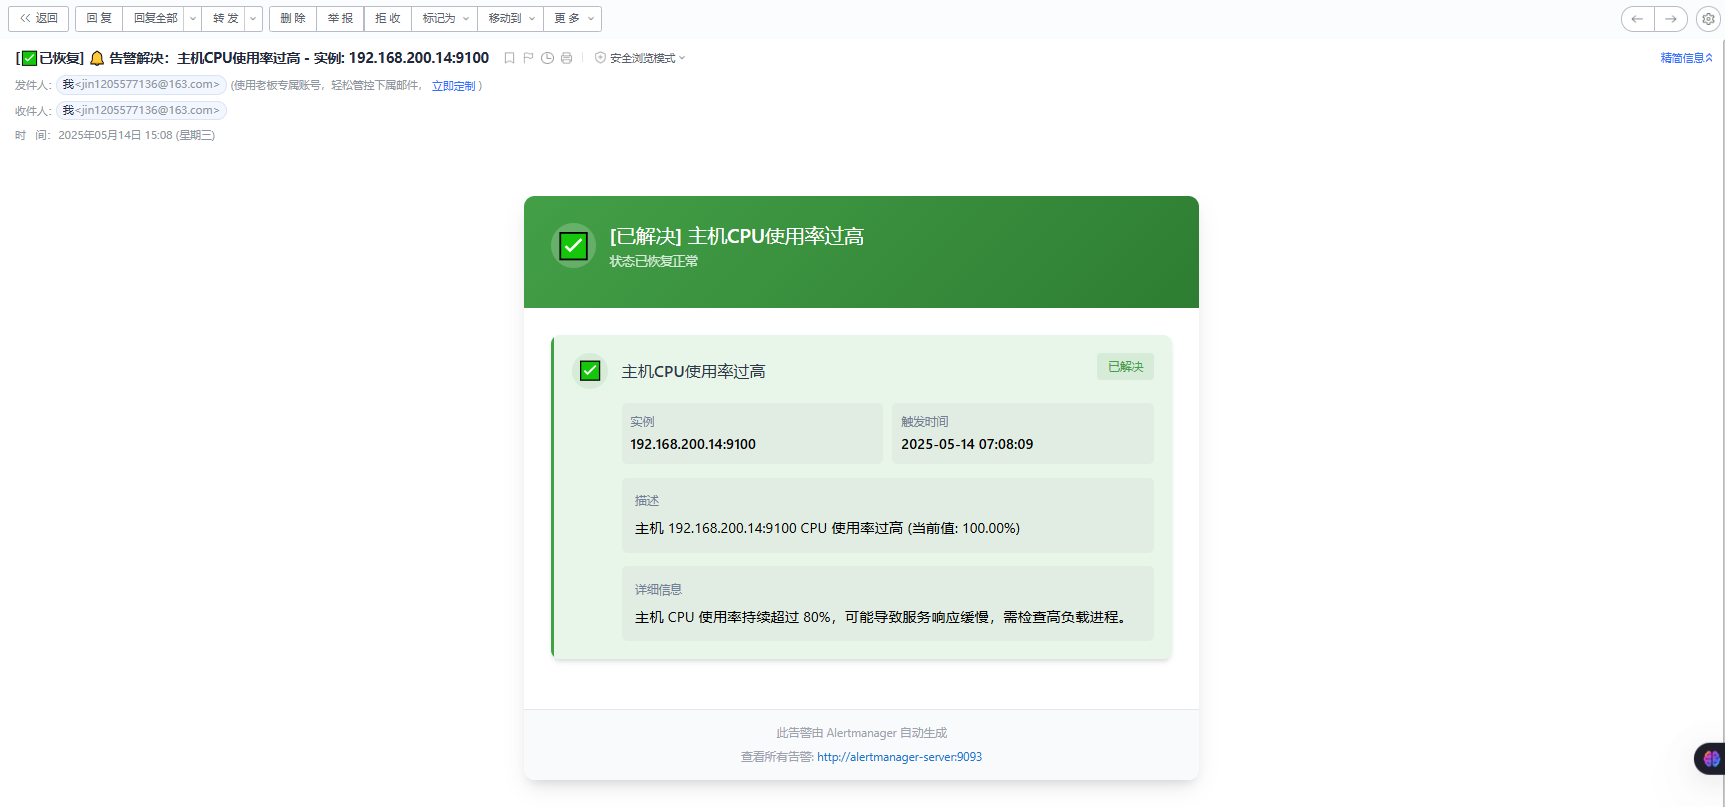
send_resolved: true
html: '{{ template "custom_alert_template" . }}'
headers:
Subject: |
{{- if eq .Status "firing" -}}
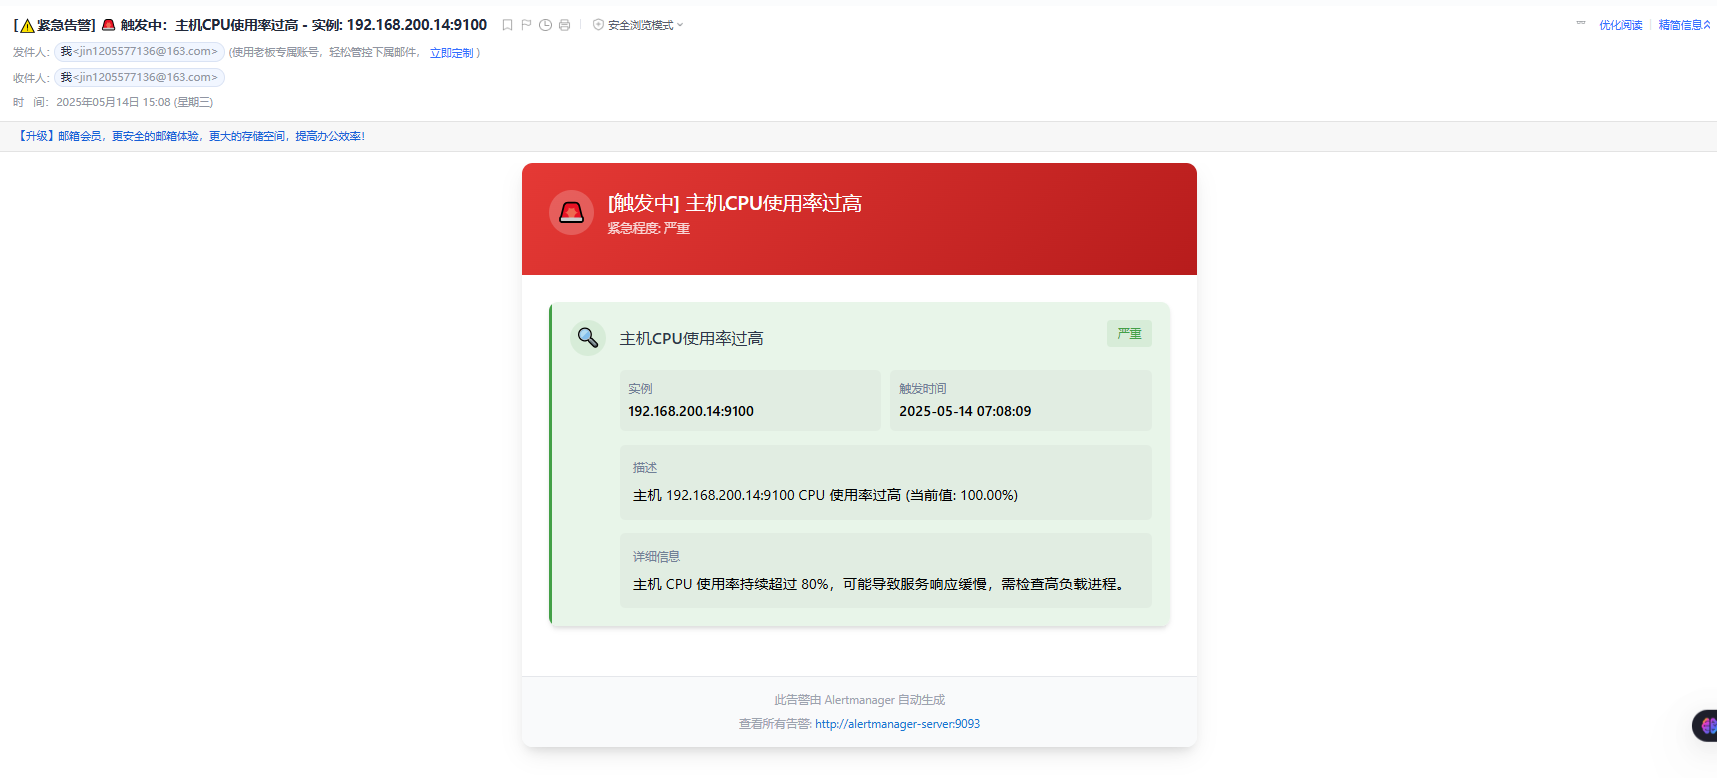
[⚠️紧急告警] 🚨 触发中:{{ .CommonLabels.alertname }} - 实例: {{ .CommonLabels.instance }}
{{- else -}}
[✅已恢复] 🔔 告警解决:{{ .CommonLabels.alertname }} - 实例: {{ .CommonLabels.instance }}
{{- end -}}这个文档使用钉钉报警
bash
global:
  # 移除 SMTP 相关配置(如果不再使用邮箱)

templates:
  - '/usr/local/alertmanager-0.28.1/custom.tmpl'  # 只需包含钉钉模板

route:
  receiver: 'dingtalk-notification'  # 默认接收器改为钉钉
  group_wait: 0s
  group_interval: 30s
  repeat_interval: 300s

receivers:
- name: 'dingtalk-notification'
  webhook_configs:
  - url: 'https://oapi.dingtalk.com/robot/send?access_token=xxx'  # 替换为你的钉钉 Webhook
    send_resolved: true
    http_config:
      tls_config:
        insecure_skip_verify: true
    headers:
      Content-Type: 'application/json'
    body: '{{ template "dingtalk_alert_template" . }}'  # 引用钉钉模板
7.2 邮箱模板配置
**注意:**以下为邮箱和钉钉两种方案,选择其中一个即可。
**方案一:**邮箱配置
bash
#创建模板
 cd /usr/local/alertmanager-0.28.1/
 vim custom.tmpl
html
{{ define "custom_alert_template" }}
{{- if eq .Status "firing" -}}
<div style="max-width:750px; margin:0 auto; font-family:'Inter',-apple-system,BlinkMacSystemFont,'Segoe UI',Roboto,'Helvetica Neue',Arial,sans-serif; background-color:#f9fafb; border-radius:12px; overflow:hidden; box-shadow:0 10px 25px -5px rgba(0,0,0,0.1),0 8px 10px -6px rgba(0,0,0,0.1);">
  <div style="background:linear-gradient(135deg, #e53935 0%, #b71c1c 100%); color:white; padding:25px 30px; position:relative; overflow:hidden;">
    <div style="position:absolute; top:0; right:0; width:100px; height:100px; opacity:0.1;">
      <svg xmlns="http://www.w3.org/2000/svg" viewBox="0 0 100 100" width="100" height="100">
        <path d="M50,10 C80,10 100,30 100,50 C100,80 80,100 50,100 C20,100 0,80 0,50 C0,30 20,10 50,10 Z" fill="white"></path>
        <path d="M50,30 C66.57,30 80,43.43 80,60 C80,76.57 66.57,90 50,90 C33.43,90 20,76.57 20,60 C20,43.43 33.43,30 50,30 Z" fill="none" stroke="white" stroke-width="5"></path>
        <circle cx="50" cy="60" r="10" fill="white"></circle>
      </svg>
    </div>
    <div style="position:relative; z-index:1;">
      <div style="display:flex; align-items:center; margin-bottom:15px;">
        <div style="width:50px; height:50px; border-radius:50%; background-color:rgba(255,255,255,0.2); display:flex; align-items:center; justify-content:center; margin-right:15px; animation:pulse 2s infinite;">
          <span style="font-size:28px;">🚨</span>
        </div>
        <div>
          <h2 style="margin:0; font-weight:500; font-size:22px;">[触发中] {{ .CommonLabels.alertname }}</h2>
          <p style="margin:0; font-size:14px; opacity:0.8;">紧急程度: {{ .CommonLabels.severity | title }}</p>
        </div>
      </div>
    </div>
  </div>
{{- else -}}
<div style="max-width:750px; margin:0 auto; font-family:'Inter',-apple-system,BlinkMacSystemFont,'Segoe UI',Roboto,'Helvetica Neue',Arial,sans-serif; background-color:#f9fafb; border-radius:12px; overflow:hidden; box-shadow:0 10px 25px -5px rgba(0,0,0,0.1),0 8px 10px -6px rgba(0,0,0,0.1);">
  <div style="background:linear-gradient(135deg, #43a047 0%, #2e7d32 100%); color:white; padding:25px 30px; position:relative; overflow:hidden;">
    <div style="position:absolute; top:0; right:0; width:100px; height:100px; opacity:0.1;">
      <svg xmlns="http://www.w3.org/2000/svg" viewBox="0 0 100 100" width="100" height="100">
        <path d="M50,10 C80,10 100,30 100,50 C100,80 80,100 50,100 C20,100 0,80 0,50 C0,30 20,10 50,10 Z" fill="white"></path>
        <path d="M30,50 L50,70 L75,35" fill="none" stroke="white" stroke-width="8" stroke-linecap="round"></path>
      </svg>
    </div>
    <div style="position:relative; z-index:1;">
      <div style="display:flex; align-items:center; margin-bottom:15px;">
        <div style="width:50px; height:50px; border-radius:50%; background-color:rgba(255,255,255,0.2); display:flex; align-items:center; justify-content:center; margin-right:15px;">
          <span style="font-size:28px;">✅</span>
        </div>
        <div>
          <h2 style="margin:0; font-weight:500; font-size:22px;">[已解决] {{ .CommonLabels.alertname }}</h2>
          <p style="margin:0; font-size:14px; opacity:0.8;">状态已恢复正常</p>
        </div>
      </div>
    </div>
  </div>
{{- end }}

  <div style="padding:30px; background-color:white;">
    {{- if .Alerts -}}
      {{- range .Alerts }}
        <div style="margin-bottom:25px; border-radius:10px; overflow:hidden; box-shadow:0 4px 6px -1px rgba(0,0,0,0.1),0 2px 4px -1px rgba(0,0,0,0.06); transition:transform 0.3s ease, box-shadow 0.3s ease;">
          <div style="padding:20px; background-color:
            {{- if eq $.Status "firing" -}}
              {{- if eq .Labels.severity "critical" }}#ffebee{{ else if eq .Labels.severity "warning" }}#fff3e0{{ else }}#e8f5e9{{ end -}}
            {{- else -}}
              #e8f5e9
            {{- end -}};
            border-left:4px solid;
            border-left-color:
            {{- if eq $.Status "firing" -}}
              {{- if eq .Labels.severity "critical" }}#e53935{{ else if eq .Labels.severity "warning" }}#fb8c00{{ else }}#43a047{{ end -}}
            {{- else -}}
              #43a047
            {{- end -}};">

            <div style="display:flex; justify-content:space-between; align-items:flex-start;">
              <div style="display:flex; align-items:center;">
                <div style="width:40px; height:40px; border-radius:50%; background-color:
                  {{- if eq $.Status "firing" -}}
                    {{- if eq .Labels.severity "critical" }}rgba(229,57,53,0.1){{ else if eq .Labels.severity "warning" }}rgba(251,140,0,0.1){{ else }}rgba(67,160,71,0.1){{ end -}}
                  {{- else -}}
                    rgba(67,160,71,0.1)
                  {{- end -}};
                  display:flex; align-items:center; justify-content:center; margin-right:15px;">
                  <span style="font-size:20px; color:
                    {{- if eq $.Status "firing" -}}
                      {{- if eq .Labels.severity "critical" }}#e53935{{ else if eq .Labels.severity "warning" }}#fb8c00{{ else }}#43a047{{ end -}}
                    {{- else -}}
                      #43a047
                    {{- end -}};">
                    {{- if eq $.Status "firing" -}}
                      {{- if eq .Labels.severity "critical" }}🔥{{ else if eq .Labels.severity "warning" }}⚠️{{ else }}🔍{{ end -}}
                    {{- else -}}
                      ✅
                    {{- end -}}
                  </span>
                </div>
                <h3 style="margin:0; color:#2d3748; font-weight:500; font-size:18px;">{{ .Labels.alertname }}</h3>
              </div>
              <div style="padding:4px 12px; border-radius:4px; background-color:
                {{- if eq $.Status "firing" -}}
                  {{- if eq .Labels.severity "critical" }}rgba(229,57,53,0.1){{ else if eq .Labels.severity "warning" }}rgba(251,140,0,0.1){{ else }}rgba(67,160,71,0.1){{ end -}}
                {{- else -}}
                  rgba(67,160,71,0.1)
                {{- end -}};
                color:
                {{- if eq $.Status "firing" -}}
                  {{- if eq .Labels.severity "critical" }}#e53935{{ else if eq .Labels.severity "warning" }}#fb8c00{{ else }}#43a047{{ end -}}
                {{- else -}}
                  #43a047
                {{- end -}};
                font-size:13px; font-weight:500;">
                {{- if eq $.Status "firing" -}}
                  {{ .Labels.severity | title }}
                {{- else -}}
                  已解决
                {{- end -}}
              </div>
            </div>

            <div style="margin-top:15px; padding-left:55px;">
              <div style="display:grid; grid-template-columns:1fr 1fr; gap:10px;">
                <div style="padding:10px; background-color:rgba(0,0,0,0.03); border-radius:6px;">
                  <p style="margin:0; font-size:13px; color:#718096;">实例</p>
                  <p style="margin:0; font-size:16px; font-weight:500;">{{ .Labels.instance }}</p>
                </div>
                <div style="padding:10px; background-color:rgba(0,0,0,0.03); border-radius:6px;">
                  <p style="margin:0; font-size:13px; color:#718096;">触发时间</p>
                  <p style="margin:0; font-size:16px; font-weight:500;">{{ .StartsAt.Format "2006-01-02 15:04:05" }}</p>
                </div>
              </div>

              <div style="margin-top:15px; padding:15px; background-color:rgba(0,0,0,0.03); border-radius:6px;">
                <p style="margin:0 0 5px 0; font-size:13px; color:#718096;">描述</p>
                <p style="margin:0; font-size:16px;">{{ .Annotations.summary }}</p>
              </div>

              {{- if .Annotations.description -}}
              <div style="margin-top:15px; padding:15px; background-color:rgba(0,0,0,0.03); border-radius:6px;">
                <p style="margin:0 0 5px 0; font-size:13px; color:#718096;">详细信息</p>
                <p style="margin:0; font-size:16px;">{{ .Annotations.description }}</p>
              </div>
              {{- end -}}

              {{- if .Annotations.runbook_url -}}
              <div style="margin-top:15px;">
                <a href="{{ .Annotations.runbook_url }}" style="display:inline-flex; align-items:center; padding:8px 16px; background-color:#1976d2; color:white; border-radius:6px; text-decoration:none; font-weight:500; transition:background-color 0.3s ease;">
                  <span style="margin-right:8px;">📖</span>
                  查看操作手册
                </a>
              </div>
              {{- end -}}
            </div>
          </div>
        </div>
      {{- end -}}
    {{- else -}}
      <div style="text-align:center; padding:40px 0; color:#6b7280;">
        <div style="font-size:64px; color:#e5e7eb; margin-bottom:20px;">✅</div>
        <h3 style="margin:0 0 10px 0; font-weight:400; color:#374151;">一切正常</h3>
        <p style="margin:0; max-width:300px; margin:0 auto;">没有活跃的告警需要处理</p>
      </div>
    {{- end -}}
  </div>

  <div style="padding:15px 30px; background-color:#f9fafb; border-top:1px solid #e5e7eb; text-align:center; font-size:13px; color:#9ca3af;">
    <p style="margin:0;">此告警由 Alertmanager 自动生成</p>
    <p style="margin:5px 0 0 0;">查看所有告警: <a href="http://alertmanager-server:9093" style="color:#1976d2; text-decoration:none;">http://alertmanager-server:9093</a></p>
  </div>
</div>

<style>
  @keyframes pulse {
    0% { transform: scale(1); box-shadow: 0 0 0 0 rgba(239, 83, 80, 0.7); }
    70% { transform: scale(1.05); box-shadow: 0 0 0 10px rgba(239, 83, 80, 0); }
    100% { transform: scale(1); box-shadow: 0 0 0 0 rgba(239, 83, 80, 0); }
  }
</style>
{{ end }}
bash
#启动alertmanager服务
systemctl start alertmanager.service
**方案二:**钉钉配置
bash
vim alertmanager.yml
bash
global:
  # 移除 SMTP 相关配置(如果不再使用邮箱)

templates:
  - '/usr/local/alertmanager-0.28.1/custom.tmpl'  #钉钉模板

route:
  receiver: 'dingtalk-notification'  # 默认接收器改为钉钉
  group_wait: 0s
  group_interval: 30s
  repeat_interval: 300s

receivers:
- name: 'dingtalk-notification'
  webhook_configs:
  - url: 'https://oapi.dingtalk.com/robot/send?access_token'  #钉钉的Webhook
    send_resolved: true
    http_config:
      tls_config:
        insecure_skip_verify: true
    headers:
      Content-Type: 'application/json'
    body: '{{ template "dingtalk_alert_template" . }}'  # 引用钉钉模板
bash
vim custom.tmpl
bash
{{/* 钉钉模板(JSON Markdown 格式) */}}
{{ define "dingtalk_alert_template" }}
{
  "msgtype": "markdown",
  "markdown": {
    "title": "[{{ if eq .Status \"firing\" }}🔥告警触发{{ else }}✅告警恢复{{ end }}] {{ .CommonLabels.alertname }}",
    "text": "### {{ if eq .Status \"firing\" }}🔥告警触发(级别:{{ .CommonLabels.severity | toUpper }}){{ else }}✅告警恢复{{ end }}\n" +
            "**告警名称**: {{ .CommonLabels.alertname }}\n" +
            "**实例**: {{ .CommonLabels.instance }}\n" +
            "**描述**: {{ .CommonAnnotations.description }}\n\n" +
            "{{ range .Alerts }}\n" +
            "- **详情**: {{ .Annotations.summary }}\n" +
            "- **时间**: {{ .StartsAt.Format \"2006-01-02 15:04:05\" }}\n" +
            "{{ end }}"
  }
}
{{ end }}
两者可以同时使用,文档这里不做配置
7.3 触发报警规则配置
bash
#创建规则文件
vim /usr/local/prometheus-2.29.1/alert-rules.yml
yaml
groups:
# 主机资源监控规则(基础架构稳定性)
- name: host-resource-rules
  rules:
    # 节点 CPU 使用率过高(系统负载)
    - alert: 主机CPU使用率过高
      expr: (100 - avg by(instance)(irate(node_cpu_seconds_total{mode="idle"}[5m])) * 100) > 80
      for: 20s
      labels:
        severity: 严重
      annotations:
        summary: "主机 {{ $labels.instance }} CPU 使用率过高 (当前值: {{ $value | printf \"%.2f\" }}%)"
        description: "主机 CPU 使用率持续超过 80%,可能导致服务响应缓慢,需检查高负载进程。"

    # 节点内存使用率过高(防止 OOM)
    - alert: 主机内存使用率过高
      expr: (node_memory_MemTotal_bytes - node_memory_MemAvailable_bytes) / node_memory_MemTotal_bytes * 100 > 85
      for: 20s
      labels:
        severity: 严重
      annotations:
        summary: "主机 {{ $labels.instance }} 内存使用率过高 (当前值: {{ $value | printf \"%.2f\" }}%)"
        description: "主机内存使用率持续超过 85%,可能触发 OOM Killer,导致服务异常终止。"

    # 节点磁盘空间不足(避免系统崩溃)
    - alert: 磁盘空间不足
      expr: (1 - node_filesystem_free_bytes{fstype=~"ext4|xfs|btrfs"} / node_filesystem_size_bytes{fstype=~"ext4|xfs|btrfs"}) * 100 > 80
      for: 20s
      labels:
        severity: 警告
      annotations:
        summary: "主机 {{ $labels.instance }} 磁盘分区 {{ $labels.mountpoint }} 空间不足 (当前值: {{ $value | printf \"%.2f\" }}%)"
        description: "磁盘空间使用率超过 80%,可能导致日志写入失败、应用无法启动,需清理或扩容。"

    # 节点磁盘 IO 延迟过高(影响读写性能)
    - alert: 磁盘IO延迟过高
      expr: avg by(instance, device)(irate(node_disk_io_time_seconds_total[5m])) > 100
      for: 20s
      labels:
        severity: 警告
      annotations:
        summary: "主机 {{ $labels.instance }} 磁盘 {{ $labels.device }} IO 延迟过高 (当前值: {{ $value | printf \"%.2f\" }}ms)"
        description: "磁盘 IO 延迟持续超过 100ms,可能由磁盘故障、碎片过多或负载过高导致。"

    # 节点网络带宽利用率过高(网络瓶颈)
    - alert: 网络带宽利用率过高
      expr: sum by(instance, device)(rate(node_network_receive_bytes_total[5m]) + rate(node_network_transmit_bytes_total[5m])) / node_network_speed_bytes * 100 > 80
      for: 20s
      labels:
        severity: 警告
      annotations:
        summary: "主机 {{ $labels.instance }} 网络接口 {{ $labels.device }} 带宽利用率过高 (当前值: {{ $value | printf \"%.2f\" }}%)"
        description: "网络带宽利用率持续超过 80%,可能导致数据包丢失、服务响应超时。"

    # 节点负载过高(系统整体压力)
    - alert: 系统负载过高
      expr: node_load1 > on (instance) node_cpu_seconds_total{mode="idle"} * 0.8
      for: 20s
      labels:
        severity: 警告
      annotations:
        summary: "主机 {{ $labels.instance }} 系统负载过高 (当前值: {{ $value | printf \"%.2f\" }})"
        description: "系统 1 分钟负载超过 CPU 核心数的 80%,可能由进程泄漏或资源竞争导致。"

    # 节点不可达(基础设施可用性)
    - alert: 节点不可达
      expr: up{job="node-exporter"} == 0
      for: 20s
      labels:
        severity: 严重
      annotations:
        summary: "主机 {{ $labels.instance }} 不可达"
        description: "Node Exporter 无法访问,可能由主机崩溃、网络中断或服务异常导致。"

# Kubernetes 资源监控规则(容器平台稳定性)
- name: kubernetes-resource-rules
  rules:
    # Pod CPU 使用率过高(容器资源)
    - alert: PodCPU使用率过高
      expr: sum by(namespace, pod)(rate(container_cpu_usage_seconds_total{container!="POD", container!=""}[5m])) / sum by(namespace, pod)(container_spec_cpu_quota{container!="POD", container!=""}) * 100 > 80
      for: 5m
      labels:
        severity: 警告
      annotations:
        summary: "Pod {{ $labels.namespace }}/{{ $labels.pod }} CPU 使用率过高 (当前值: {{ $value | printf \"%.2f\" }}%)"
        description: "Pod CPU 使用率持续超过 80%,可能导致容器被限流(throttled),影响服务性能。"

    # Pod 内存使用率过高(容器资源)
    - alert: Pod内存使用率过高
      expr: sum by(namespace, pod)(container_memory_usage_bytes{container!="POD", container!=""}) / sum by(namespace, pod)(container_spec_memory_limit_bytes{container!="POD", container!=""}) * 100 > 90
      for: 5m
      labels:
        severity: 警告
      annotations:
        summary: "Pod {{ $labels.namespace }}/{{ $labels.pod }} 内存使用率过高 (当前值: {{ $value | printf \"%.2f\" }}%)"
        description: "Pod 内存使用率持续超过 90%,可能触发 OOM Kill,导致容器重启。"

    # Deployment 副本不足(服务可用性)
    - alert: Deployment副本不足
      expr: kube_deployment_spec_replicas != kube_deployment_status_available_replicas
      for: 10m
      labels:
        severity: 严重
      annotations:
        summary: "Deployment {{ $labels.namespace }}/{{ $labels.deployment }} 副本不足"
        description: "期望 {{ $value | printf \"%.0f\" }} 个副本,但只有 {{ $labels.available_replicas }} 个可用,可能影响服务可用性。"

    # PVC 容量不足(存储资源)
    - alert: PVCCapacity不足
      expr: (1 - kubelet_volume_stats_available_bytes / kubelet_volume_stats_capacity_bytes) * 100 > 80
      for: 24h
      labels:
        severity: 警告
      annotations:
        summary: "PVC {{ $labels.namespace }}/{{ $labels.persistentvolumeclaim }} 容量不足 (当前值: {{ $value | printf \"%.2f\" }}%)"
        description: "PVC 容量使用率超过 80%,建议在 24 小时内扩容,避免影响数据写入。"

# 应用程序监控规则(直接关联业务)
- name: application-rules
  rules:
    # HTTP 请求错误率过高(业务可用性)
    - alert: HTTP请求错误率过高
      expr: sum by(job)(rate(http_requests_total{status=~"5.."}[5m])) / sum by(job)(rate(http_requests_total[5m])) * 100 > 5
      for: 10m
      labels:
        severity: 警告
      annotations:
        summary: "服务 {{ $labels.job }} HTTP 请求错误率过高 (当前值: {{ $value | printf \"%.2f\" }}%)"
        description: "HTTP 5xx 错误率持续超过 5%,可能由服务崩溃、依赖故障或资源不足导致。"

    # 数据库连接池耗尽(数据访问)
    - alert: 数据库连接池耗尽
      expr: database_connections_active / database_connections_max * 100 > 90
      for: 5m
      labels:
        severity: 严重
      annotations:
        summary: "数据库 {{ $labels.instance }} 连接池耗尽 (当前值: {{ $value | printf \"%.2f\" }}%)"
        description: "数据库连接池使用率超过 90%,新请求可能无法获取连接,导致服务无响应。"

    # 消息队列堆积(异步处理)
    - alert: 消息队列堆积
      expr: sum by(queue)(rabbitmq_queue_messages_ready) > 10000
      for: 10m
      labels:
        severity: 警告
      annotations:
        summary: "消息队列 {{ $labels.queue }} 堆积严重 (当前值: {{ $value | printf \"%.0f\" }} 条)"
        description: "消息队列中待处理消息超过 10000 条,消费者可能存在瓶颈,需检查消费逻辑或扩容。"
7.4 Prometheus连接配置
bash
vim /usr/local/prometheus-2.29.1/prometheus.yml
yaml
alerting:
  alertmanagers:
  - static_configs:
    - targets: ["192.168.200.14:9093"]  #Alertmanager服务地址(默认端口9093)

rule_files:
  - "/usr/local/prometheus-2.29.1/alert-rules.yml"  #报警规则文件路径
bash
#重启启动prometheus服务
systemctl restart prometheus.service
7.5 CPU触发报警测试
测试192.168.200.14主机cpu达到阈值触发报警
bash
#在200.104编写测试脚本
vim cpu-test.sh
bash
#!/usr/bin/env bash
# 文件名:cpu_stress.sh
# 用法:chmod +x cpu_stress.sh && ./cpu_stress.sh [持续时长秒]
# 默认持续 60 秒,如果传入参数则按参数秒数运行。

# 运行时长(秒)
DURATION=${1:-60}

# 计算结束时间
END_TIME=$((SECONDS + DURATION))

# 启动与 CPU 核数相同的子进程,每个子进程都在忙循环
CPU_CORES=$(nproc)
echo ">> 启动 $CPU_CORES 个 busy-loop,压满所有 CPU 核心,共运行 $DURATION 秒"

for ((i=1; i<=CPU_CORES; i++)); do
  (
    # 子进程忙循环直到超时
    while [ $SECONDS -lt $END_TIME ]; do
      :  # 空操作,占用 CPU
    done
  ) &
done

# 等待所有子进程结束
wait
echo ">> CPU 压力测试结束。"
bash
#执行脚本(执行脚本前使用   journalctl -u alertmanager.service -f    查看日志)
journalctl -u alertmanager.service -f

bash cpu-test.sh
bash
#日志
5月 14 03:01:39 prometheus alertmanager[7188]: time=2025-05-14T07:01:39.747Z level=DEBUG source=dispatch.go:165 msg="Received alert" component=dispatcher alert=主机CPU使用率过高[c57a700][resolved]
5月 14 03:01:54 prometheus alertmanager[7188]: time=2025-05-14T07:01:54.746Z level=DEBUG source=dispatch.go:165 msg="Received alert" component=dispatcher alert=主机CPU使用率过高[8ccbb6e][resolved]
5月 14 03:01:54 prometheus alertmanager[7188]: time=2025-05-14T07:01:54.752Z level=DEBUG source=dispatch.go:530 msg=flushing component=dispatcher aggrGroup={}:{} alerts="[主机CPU使用率过高[c57a700][resolved] 主机CPU使用率过高[8ccbb6e][resolved]]"
5月 14 03:01:56 prometheus alertmanager[7188]: time=2025-05-14T07:01:56.043Z level=DEBUG source=notify.go:876 msg="Notify success" component=dispatcher receiver=邮件接收人 integration=email[0] aggrGroup={}:{} attempts=1 duration=1.291165694s alerts="[主机CPU使用率过高[c57a700][resolved] 主机CPU使用率过高[8ccbb6e][resolved]]"
7.6 查看邮箱邮件