书籍:Matlab实用教程
工具:Matlab2021a
电脑信息:Intel® Xeon® CPU E5-2603 v3 @ 1.60GHz
系统类型:64位操作系统,基于X64的处理器 windows10 专业版
第4章 Matlab的符号计算计算的可视化和GUI设计
4.3 Matlab的特殊图形绘制
4.3.1 条形图
x=3:6;
y=[5.3 13.0 0.4
5.1 11.8 -1.7
3.7 8.1 0.6
1.5 7.7 -4.5];
bar(x,y)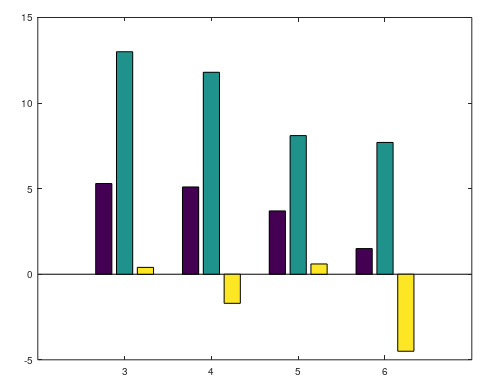
4.3.2 面积图和实心图
x=3:6;
y=[5.3 13.0 0.4
5.1 11.8 -1.7
3.7 8.1 0.6
1.5 7.7 -4.5];
area(x,y)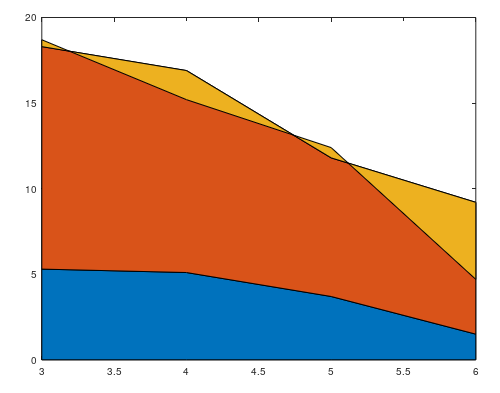
x=3:6
y=[5.3 13.0 0.4 5.1];
fill(x,y,'r')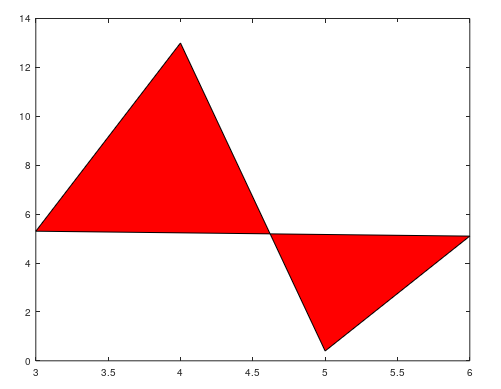
4.3.3 直方图
x=-2:0.5:2;
y=randn(10,2);
hist(y,x)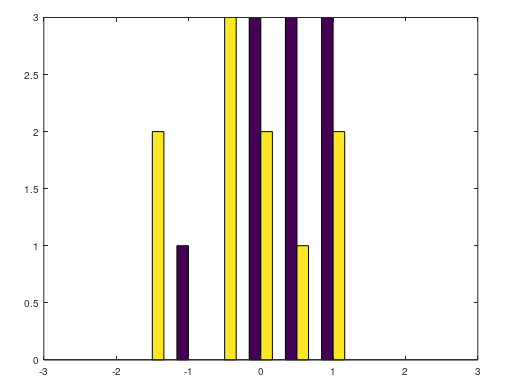
4.3.4 饼形图
x=[0 0 1 0];
y=[200 100 250 400];
pie(y,x,{'A','B','C','D'})
x=[0 0 1 0];
y=[200 100 250 400];
pie3(y,x,{'A','B','C','D'})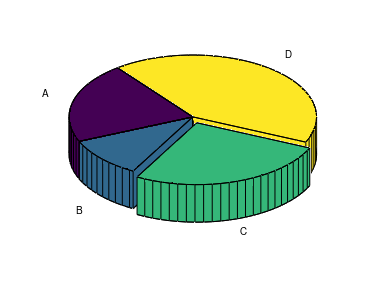
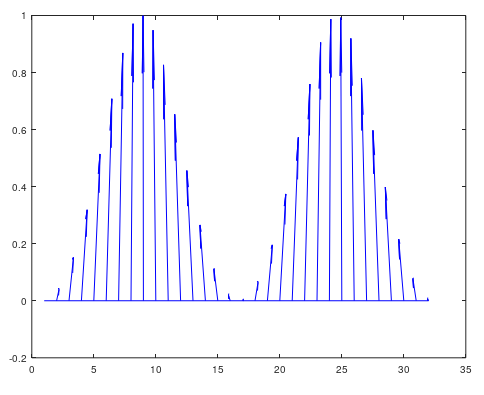
4.3.5 离散数据图
x=0:0.1:2*pi;
y=sin(x).*exp(-2*x);
subplot(3,1,1)
stem(x,y,'filled')
subplot(3,1,2)
stairs(x,y)
subplot(3,1,3)
scatter(x,y)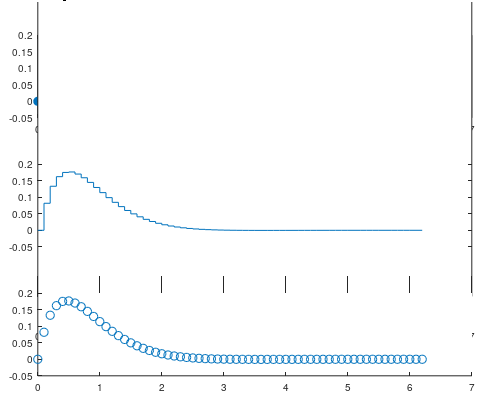
4.3.6 对数坐标和极坐标图
w=logspace(-2,3,20);
Aw=1./(w.*sqrt((0.5*w).^2+1));
Lw=20*log10(Aw);
semilogx(w,Lw)
title('对数幅频特性曲线')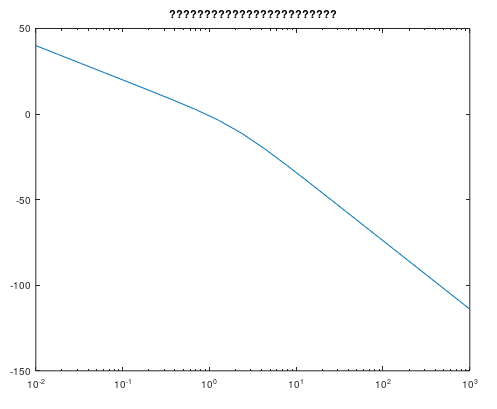
w=logspace(-2,3,20);
Aw=1./(w.*sqrt((0.5*w).^2+1));
Lw=20*log10(Aw);
Fw=-90-atan(0.5*w);
polar(Fw,Aw)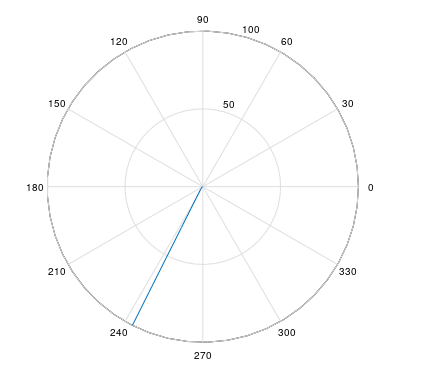
4.3.7 等高线图
[x,y,z]=peaks;
contour(x,y,z)
4.3.8 复向量图
theta=0:0.2:2*pi;
z=sin(theta).*exp(j*theta);
compass(z)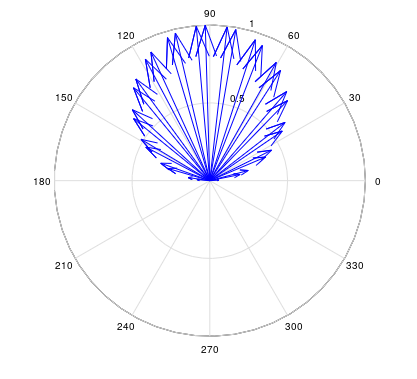
theta=0:0.2:2*pi;
z=sin(theta).*exp(j*theta);
feather(z)