我们在公司运营跨境电商平台的过程中,服务器负载、I/O、网络吞吐等指标直接影响业务稳定性。传统的Zabbix/Web监控已无法满足高并发、高指标维度的数据分析需求,因此我们引入Prometheus + Grafana打造下一代Linux运维监控平台,实现:
✔ 实时采集指标、长周期存储
✔ 多维度告警(申请工单、短信、钉钉/企业微信推送)
✔ 自定义可视化看板与业务指标联动
✔ 支持海量节点(>200台)稳定监控
一、监控平台架构设计
整体架构如下:
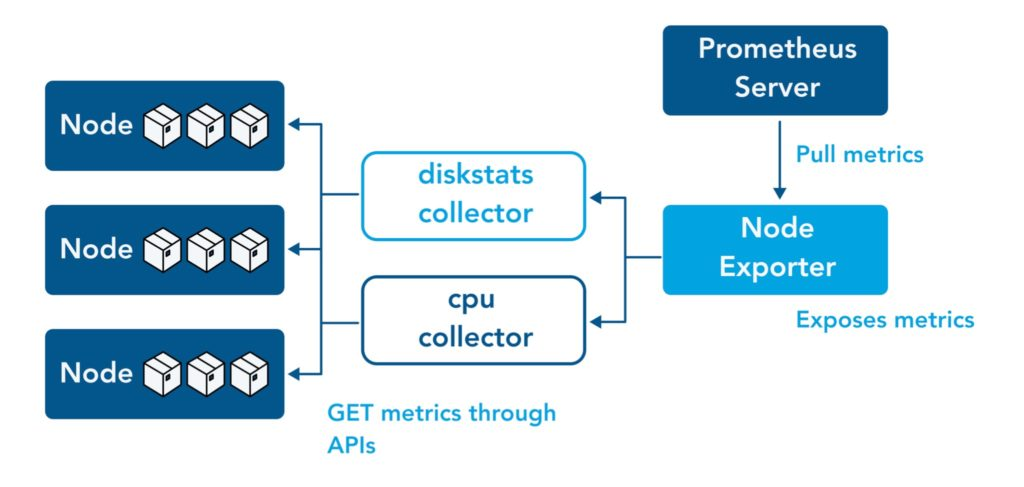
| 组件 | 作用 |
|---|---|
| Prometheus Server | 核心采集引擎,周期性拉取指标 |
| node_exporter | 采集Linux主机指标 |
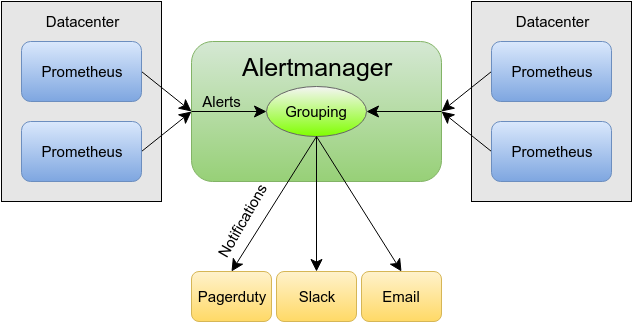
| Alertmanager | 告警管理与路由 |
| Grafana | 数据可视化与看板呈现 |
| Pushgateway | 短期批任务指标接入(可选) |
| Alert Hooks | 钉钉/企业微信/SMS 告警 |
二、基础环境与硬件参数
我们在真实生产机房中香港服务器www.a5idc.com部署如下硬件用于监控平台:
| 部署节点 | CPU | 内存 | 存储 | 网络 | 系统 |
|---|---|---|---|---|---|
| Prometheus 主库 | E5-2620 | 32GB | 1TB SSD RAID1 | 1Gbps 内网专线 | Ubuntu 22.04 |
| Grafana Server | E5-2620 | 16GB | 512GB SSD | 1Gbps 内网专线 | Ubuntu 22.04 |
| Alertmanager | 4核 | 8GB | 256GB SSD | 1Gbps 内网专线 | Ubuntu 22.04 |
| 被监控 Linux主机 | 多种 | 多种 | - | 1Gbps / 10Gbps | CentOS/Ubuntu |
说明 :Prometheus数据量随监控主机增多线性增长,因此主库的内存、存储与网络IO是性能瓶颈,需优先保证。
三、核心产品版本及参数
| 组件 | 推荐版本 | 关键参数说明 |
|---|---|---|
| Prometheus | 2.48.0 | TSDB压缩、chunk存储、Retention 15d |
| Grafana | 10.x | 多租户、数据源插件扩展 |
| node_exporter | 1.6.1 | 默认采集 ~200+ Linux指标 |
| Alertmanager | 0.25.0 | 支持路由、抑制、分组告警 |
四、Prometheus安装与配置
4.1 下载与安装
bash
# 创建用户
sudo useradd --no-create-home --shell /bin/false prometheus

# 下载二进制
wget https://github.com/prometheus/prometheus/releases/download/v2.48.0/prometheus-2.48.0.linux-amd64.tar.gz
tar -xzvf prometheus-2.48.0.linux-amd64.tar.gz
cd prometheus-2.48.0.linux-amd64

# 安装到标准目录
sudo cp prometheus /usr/local/bin/
sudo cp promtool /usr/local/bin/
sudo mkdir /etc/prometheus && sudo cp -r consoles/ console_libraries/ /etc/prometheus/
sudo cp prometheus.yml /etc/prometheus/
4.2 prometheus.yml 核心配置
这是核心配置文件,我做了常用注释:
yaml
global:
  scrape_interval: 15s     # 全局采集间隔
  evaluation_interval: 15s # 规则评估间隔

scrape_configs:
  - job_name: 'prometheus'
    static_configs:
      - targets: ['localhost:9090']

  - job_name: 'node_exporters'
    static_configs:
      - targets: ['10.0.0.11:9100','10.0.0.12:9100']
    metrics_path: '/metrics'
4.3 启动服务
bash
# systemd
cat << EOF | sudo tee /etc/systemd/system/prometheus.service
[Unit]
Description=Prometheus Server
After=network.target

[Service]
User=prometheus
ExecStart=/usr/local/bin/prometheus \
  --config.file=/etc/prometheus/prometheus.yml \
  --storage.tsdb.path=/var/lib/prometheus/ \
  --storage.tsdb.retention.time=15d
Restart=always

[Install]
WantedBy=multi-user.target
EOF

sudo systemctl daemon-reload
sudo systemctl enable --now prometheus
五、部署 node_exporter
5.1 下载与启动
在每台被监控主机上:
bash
wget https://github.com/prometheus/node_exporter/releases/download/v1.6.1/node_exporter-1.6.1.linux-amd64.tar.gz
tar -xzvf node_exporter-1.6.1.linux-amd64.tar.gz
sudo cp node_exporter /usr/local/bin/

# systemd
cat << EOF | sudo tee /etc/systemd/system/node_exporter.service
[Unit]
Description=Node Exporter
After=network.target

[Service]
User=root
ExecStart=/usr/local/bin/node_exporter

[Install]
WantedBy=default.target
EOF

sudo systemctl daemon-reload
sudo systemctl enable --now node_exporter
5.2 验证
bash
curl http://localhost:9100/metrics | head -n 20六、Alertmanager 告警机制
6.1 配置 alertmanager.yml
用于接收Prometheus告警并转发:
yaml
global:
  resolve_timeout: 5m

route:
  receiver: 'weixin'

receivers:
- name: 'weixin'
  webhook_configs:
  - url: 'https://qyapi.weixin.qq.com/cgi-bin/webhook/send?key=你的WebhookKey'
6.2 Prometheus 关联 Alertmanager
在 prometheus.yml 添加:
yaml
alerting:
  alertmanagers:
    - static_configs:
        - targets: ['localhost:9093']
6.3 编写告警规则
新建文件 alert_rules.yml:
yaml
groups:
- name: linux.rules
  rules:
  - alert: InstanceDown
    expr: up == 0
    for: 3m
    labels:
      severity: critical
    annotations:
      summary: "服务器 {{ $labels.instance }} 无响应"
      description: "检查服务器是否宕机或网络断连"
并在 prometheus.yml 引入:
yaml
rule_files:
  - "alert_rules.yml"
七、Grafana 安装与看板
7.1 安装
bash
sudo apt install -y grafana
sudo systemctl enable --now grafana
7.2 配置数据源
进入 Grafana UI:http://监控服务器:3000
默认账号:admin/admin
添加 Prometheus 数据源:
| 字段 | 值 |
|---|---|
| Name | Prometheus |
| URL | http://localhost:9090 |
| Access | Server |
7.3 创建标准看板
我整理了一套Linux常用指标看板(CPU/Memory/Disk/Network):
| 指标 | PromQL 代码示例 |
|---|---|
| CPU 使用率 | 100 - avg by (instance) (irate(node_cpu_seconds_total{mode="idle"}[5m])) * 100 |
| 内存使用 | node_memory_MemAvailable_bytes / node_memory_MemTotal_bytes * 100 |
| 磁盘利用率 | node_filesystem_avail_bytes / node_filesystem_size_bytes * 100 |
| 网络吞吐 | irate(node_network_receive_bytes_total[5m]) / irate(node_network_transmit_bytes_total[5m]) |
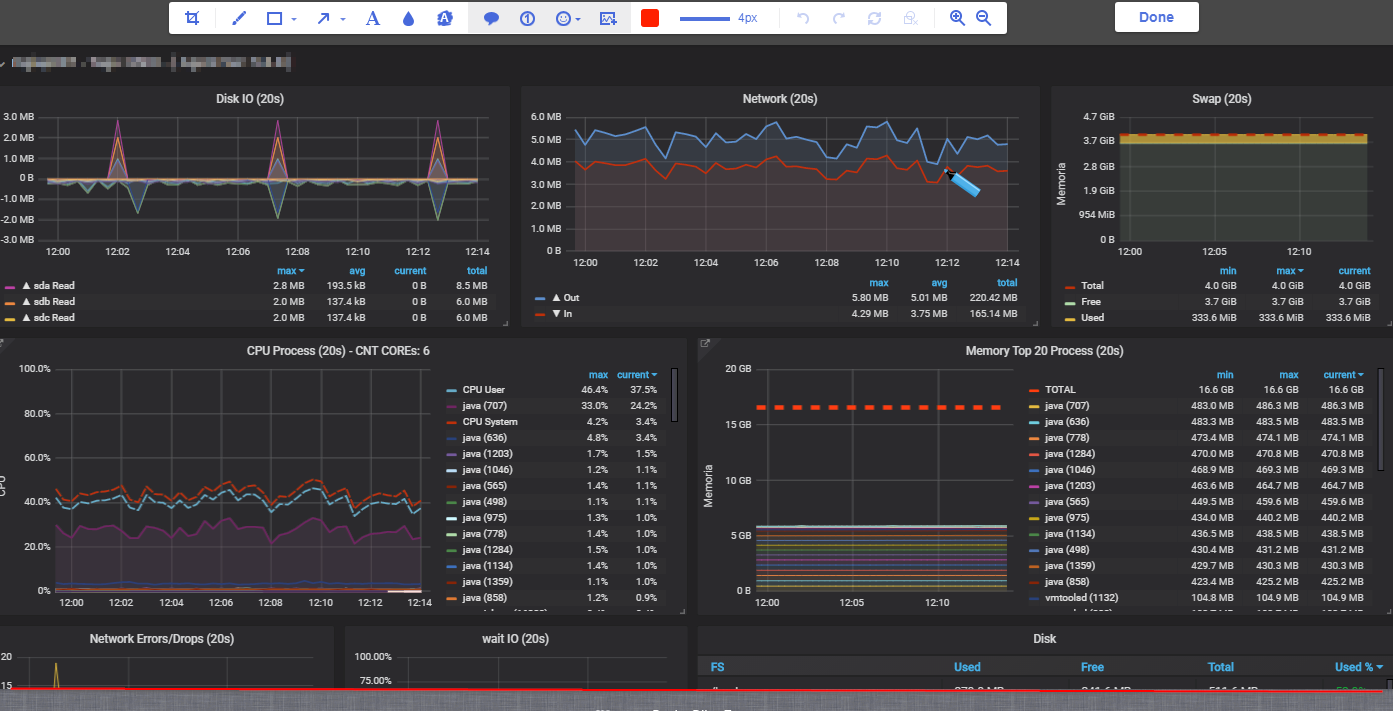
八、数据展示与评测
8.1 基准场景
我们对比了Prometheus + Grafana监控平台与传统Zabbix的指标采集延迟、存储效率:
| 指标 | Zabbix (1min) | Prometheus (15s) |
|---|---|---|
| 采集延迟 | ~1min | ~15s |
| 存储占用 | 低 | 中 (更细颗粒数据) |
| 可视化自定义 | 中 | 高 |
| 规则复杂度 | 中 | 高 |
结论:Prometheus 提供更细粒度监控,适合云原生与业务趋势分析。
8.2 存储调优示例
为了降低磁盘写放大,我们在 prometheus.yml 加入:
yaml
storage:
  tsdb:
    min-block-duration: 2h
max-block-duration: 6h实际效果:压缩率提升约 30%。
九、告警策略与故障处理
常见生产级告警策略示例:
| 告警名称 | 表达式 | 持续时间 | 备注 | |
|---|---|---|---|---|
| CPU长期高负载 | avg(rate(node_cpu_seconds_total{mode!="idle"}[5m])) > 0.85 |
5m | 业务节点高负载预警 | |
| 磁盘告急 | `node_filesystem_avail_bytes{fstype!~"tmpfs | rootfs"} / node_filesystem_size_bytes < 0.10` | 1m | 剩余 <10% |
十、常见问题与优化建议
Q1. Prometheus OOM?
增加内存,缩短
retention.time,减小采集粒度 Interval。
Q2. Alert 告警泛滥?
配置抑制策略、分组、延迟触发(
for:参数)。
Q3. Grafana 面板刷新卡顿?
降低单面板查询跨度,开启 Grafana cache。
十一、总结
通过本文实战,我们完成了:
✅ 构建 Prometheus + Grafana Linux监控平台
✅ 实现高精度指标采集与自定义看板
✅ 配置告警系统并支持企业微信推送
✅ 提供生产优化建议与调优策略