1. 什么是Prometheus
- 官网:https://prometheus.io/docs/introduction/overview/
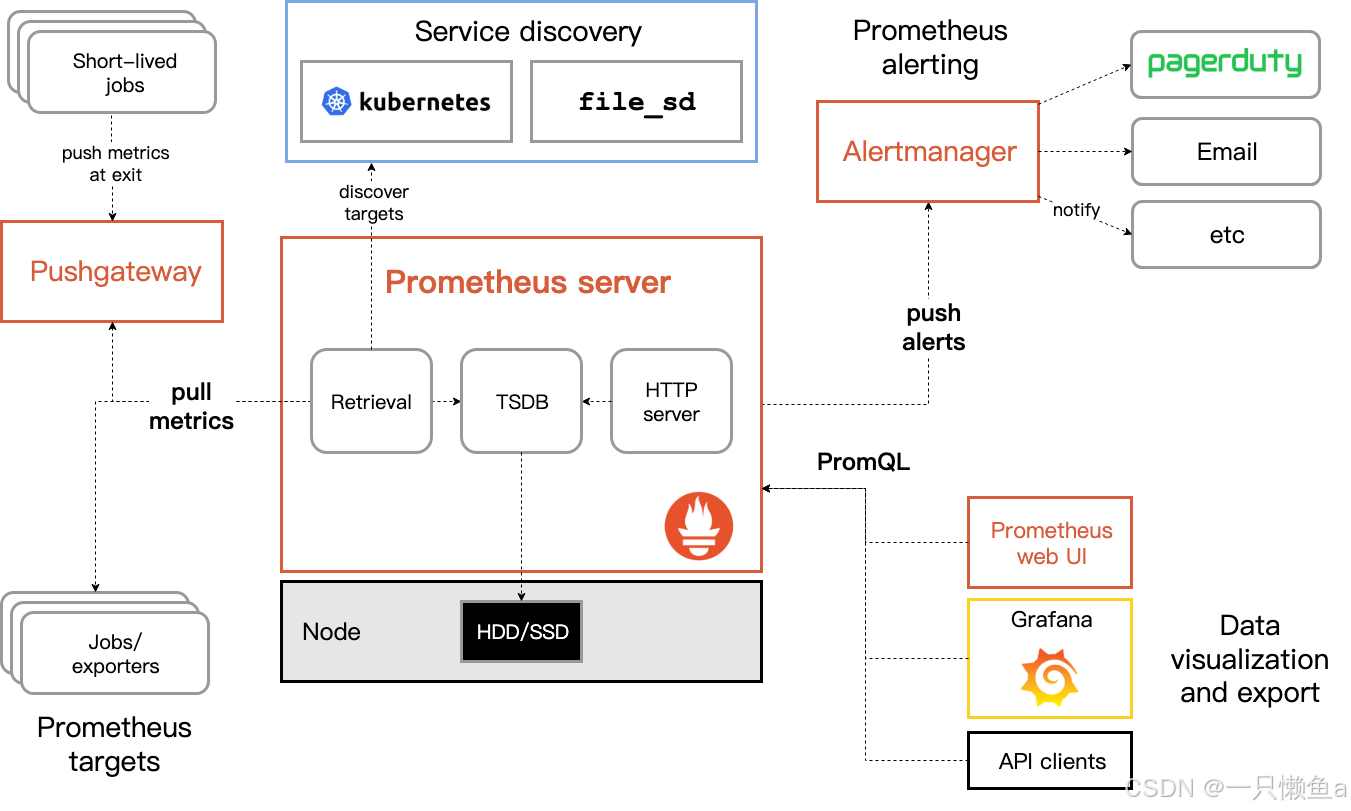
- 是一个开源的系统监控和警报工具,多数Prometheus组件是Go语言写的
- 为用户提供可视化仪表板、警报、告警等功能,以帮助用户快速定位和解决问题
- 现在已经成为一个独立于企业级的开源项目和一个独立的基金会(Cloud Native Computing Foundation)的一部分
2. 配置go环境变量
# 下载安装包
wget https://dl.google.com/go/go1.17.6.linux-amd64.tar.gz

# 创建文件夹
mkdir -p /usr/local/software

# 移动安装包
mv go1.17.6.linux-amd64.tar.gz /usr/local/software && cd /usr/local/software

# 解压
tar -zxvf go1.17.6.linux-amd64.tar.gz

# 配置环境变量
echo "export PATH=$PATH:/usr/local/software/go/bin" >> /etc/profile

# 立刻生效
source /etc/profile

# 测试
go version
3. 安装Prometheus
# 下载安装包
wget https://github.com/prometheus/prometheus/releases/download/v2.43.0/prometheus-2.43.0.linux-amd64.tar.gz

# 创建文件夹
mkdir -p /usr/local/software/prometheus

# 移动安装包
mv prometheus-2.43.0.linux-amd64.tar.gz /usr/local/software/prometheus && cd /usr/local/software/prometheus

# 解压
tar -zxvf prometheus-2.43.0.linux-amd64.tar.gz

# 重命名
mv prometheus-2.43.0.linux-amd64 prometheus

# 进入目录启动
./prometheus --config.file=./prometheus.yml

# 查看是否启动成功,默认端口9090
lsof -i:9090

# 图界面
http://IP:9090

# 指标数据
http://IP:9090/metrics
3.1 使用技巧
prometheus里面经常需要修改配置,可以利用动态更新启动时,在参数中加入**--web.enable-lifecycle** (该参数默认关闭)
# 以守护方式启动
./prometheus --config.file=./prometheus.yml --web.enable-lifecycle &

# 动态更新配置
curl -X POST http://localhost:9090/-/reload
3.2 Prometheus的目录结构
- console_libraries:用于存储用于在Prometheus控制台上显示的JavaScript库。
- consoles:用于存储用于在Prometheus控制台上显示的控制台文件,其中包括查询和图形定义。
- data:用于存储Prometheus的磁盘持久化数据。
- LICENSE:Prometheus的许可证文件。
- NOTICE:版权声明文件。
- prometheus:存储Prometheus二进制文件及其相关文件的目录。
- prometheus.yml:Prometheus的配置文件。
- promtool:Prometheus的命令行工具,用于检查配置文件是否正确以及生成表达式的值。
3.3 配置文件prometheus.yml介绍
# 全局配置,默认,可以被覆盖
global:
  scrape_interval: 15s  # 全局的抓取间隔
  scrape_timeout: 10s  # 抓取超时时间
  evaluation_interval: 15s  # 评估间隔

# 告警配置
alerting:
  alertmanagers: # 告警管理器
  - follow_redirects: true # 是否启用重定向
    enable_http2: true # 是否启用HTTP2
    scheme: http
    timeout: 10s
    api_version: v2 # 指定Alertmanager的API版本,此处为v2
    static_configs: # 告诉Prometheus哪些目标是静态的(即不会更改),如果有多个目标,则可以在targets中指定多个地址。
    - targets: []

# 抓取配置
# 此处抓取了一个名为prometheus的任务,每隔15秒抓取一次localhost:9090上的/metrics路径,超时时间为10秒
scrape_configs:
- job_name: prometheus # 任务名称
  honor_timestamps: true # 指标的时间戳应该由服务器提供,而不是客户端在发送指标时提供的时间戳
  scrape_interval: 15s # 抓取任务的时间间隔,即每15秒抓取一次。
  scrape_timeout: 10s  # 抓取任务的超时时间,单位为秒,即每个目标最多等待10秒钟
  metrics_path: /metrics  # 抓取指标的路径
  scheme: http # 指定抓取时使用的协议,默认为http
  follow_redirects: true  # 是否启用重定向。在此处启用
  enable_http2: true  # 是否启用HTTP2
  static_configs:
    - targets:
      - 127.0.0.1:9090 #目标配置,告诉Prometheus哪些目标需要抓取,如果有多个目标,则可以在targets中指定多个地址
4. 什么是Prometheus的Exporter
- 向Prometheus提供监控样本数据的程序都可以被称为一个Exporter
- 是一种用于将不同数据源的指标提供给Prometheus进行收集和监控的工具。
- 运行在应用程序、计算机、网络设备或者其他系统上的代码,它可以将系统的指标信息以一种标准格式公开
- 将指标数据公开为HTTP端点或者指定的格式(如Redis、JMX等),Prometheus然后可以通过轮询或指定的抓取器
- 总结
- Exporter是Prometheus的指标数据收集组件,负责从目标Jobs收集数据
- 并把收集到的数据转换为Prometheus支持的时序数据格式
- 只负责收集,并不向Server端发送数据,而是等待Prometheus Server 主动抓取
4.1 安装MySQL Exporter
Prometheus社区以及其他团队开发了大量的Exporter,覆盖了许多不同类型的系统和服务,包括: Node Exporter、MySQL Exporter、Redis Exporter、MongoDB Exporter、Nginx Exporter等等,这里主要演示一下MySQL Exporter的安装
4.1.1 安装docker
# 安装依赖
sudo yum install -y yum-utils device-mapper-persistent-data lvm2
sudo yum-config-manager --add-repo https://mirrors.aliyun.com/docker-ce/linux/centos/docker-ce.repo
sudo yum install -y docker-ce docker-ce-cli containerd.io

# docker镜像加速并启动docker
([ -f /etc/docker/daemon.json ] || mkdir -p /etc/docker) && echo '{ "registry-mirrors" : [
"https://docker.1ms.run","https://docker.1panel.live","https://docker.xuanyuan.me","https://registry-1.docker.io"]}' > /etc/docker/daemon.json && sudo systemctl restart docker && sleep 1 && docker info | grep -A 4 "Registry Mirrors"
4.1.2 docker安装mysql
# 创建文件夹
mkdir -p /usr/local/software/mysql/{data,logs,conf,mysql-files}

# 编辑配置文件
vim /usr/local/software/mysql/conf/my.cnf

[mysqld]
server-id=1
log-bin=mysql-bin
binlog_format=ROW

# 运行docker
docker run \
-p 3306:3306 \
--name mysql_master \
-v /usr/local/software/mysql/data:/var/lib/mysql \
-v /usr/local/software/mysql/logs:/var/log/mysql \
-v /usr/local/software/mysql/conf/my.cnf:/etc/mysql/my.cnf \
-v /usr/local/software/mysql/mysql-files:/var/lib/mysql-files \
-e MYSQL_ROOT_PASSWORD=123456 \
--restart=always \
--privileged=true \
-d mysql:8.0
4.1.3 docker安装export
# 创建文件夹
mkdir -p /usr/local/software/exports/mysql-export && cd /usr/local/software/exports/mysql-export

# 编辑配置文件文件,内容如下
vim my.cnf

[client]
user=root
password=123456
host=172.19.146.151
port=3306

# 运行docker
docker run -d \
-p 9104:9104 \
--name mysql-exporter \
-v /usr/local/software/exports/mysql-export/my.cnf:/etc/mysql-exporter/my.cnf \
prom/mysqld-exporter \
--config.my-cnf=/etc/mysql-exporter/my.cnf
4.1.4 Prometheus修改配置文件prometheus.yml
4.1.4.1 在配置文件里面追加如下内容:
- job_name: 'mysql-export'
  static_configs:
    - targets:
      - 172.19.146.151:9104
4.1.4.2 动态更新配置
curl -X POST http://localhost:9090/-/reload5. Grafana的安装和使用
5.1 什么是Grafana
- 官网地址:https://grafana.com/
- 用Go语言开发的开源数据可视化工具,可以做数据监控和数据统计,带有告警功能。
- 可视化:支持快速灵活的客户端图表,面板插件有许多不同方式的可视化指标和日志,官方库中具有丰富的仪表盘插件,比如热图、折线图、图表等多种展示方
- 数据源广: Graphite,InfluxDB,OpenTSDB,Prometheus,Elasticsearch,CloudWatch和KairosDB等。支持混合数据源,在同一个图中混合不同的数据源,可以根据每个查询指定数据源,甚至适用于自定义数据源。
- 报警:支持可视方式定义最重要指标的警报规则,Grafana将不断计算并发送通知,在数据达到阈值时进行告警
- 过滤器:过滤器允许动态创建新的键/值过滤器,这些过滤器将自动应用于使用该数据源的所有查询。
5.2 docker安装Grafana
docker run -d -p 3000:3000 --name=my-grafana grafana/grafana:8.1.55.3 Grafana页面介绍和使用
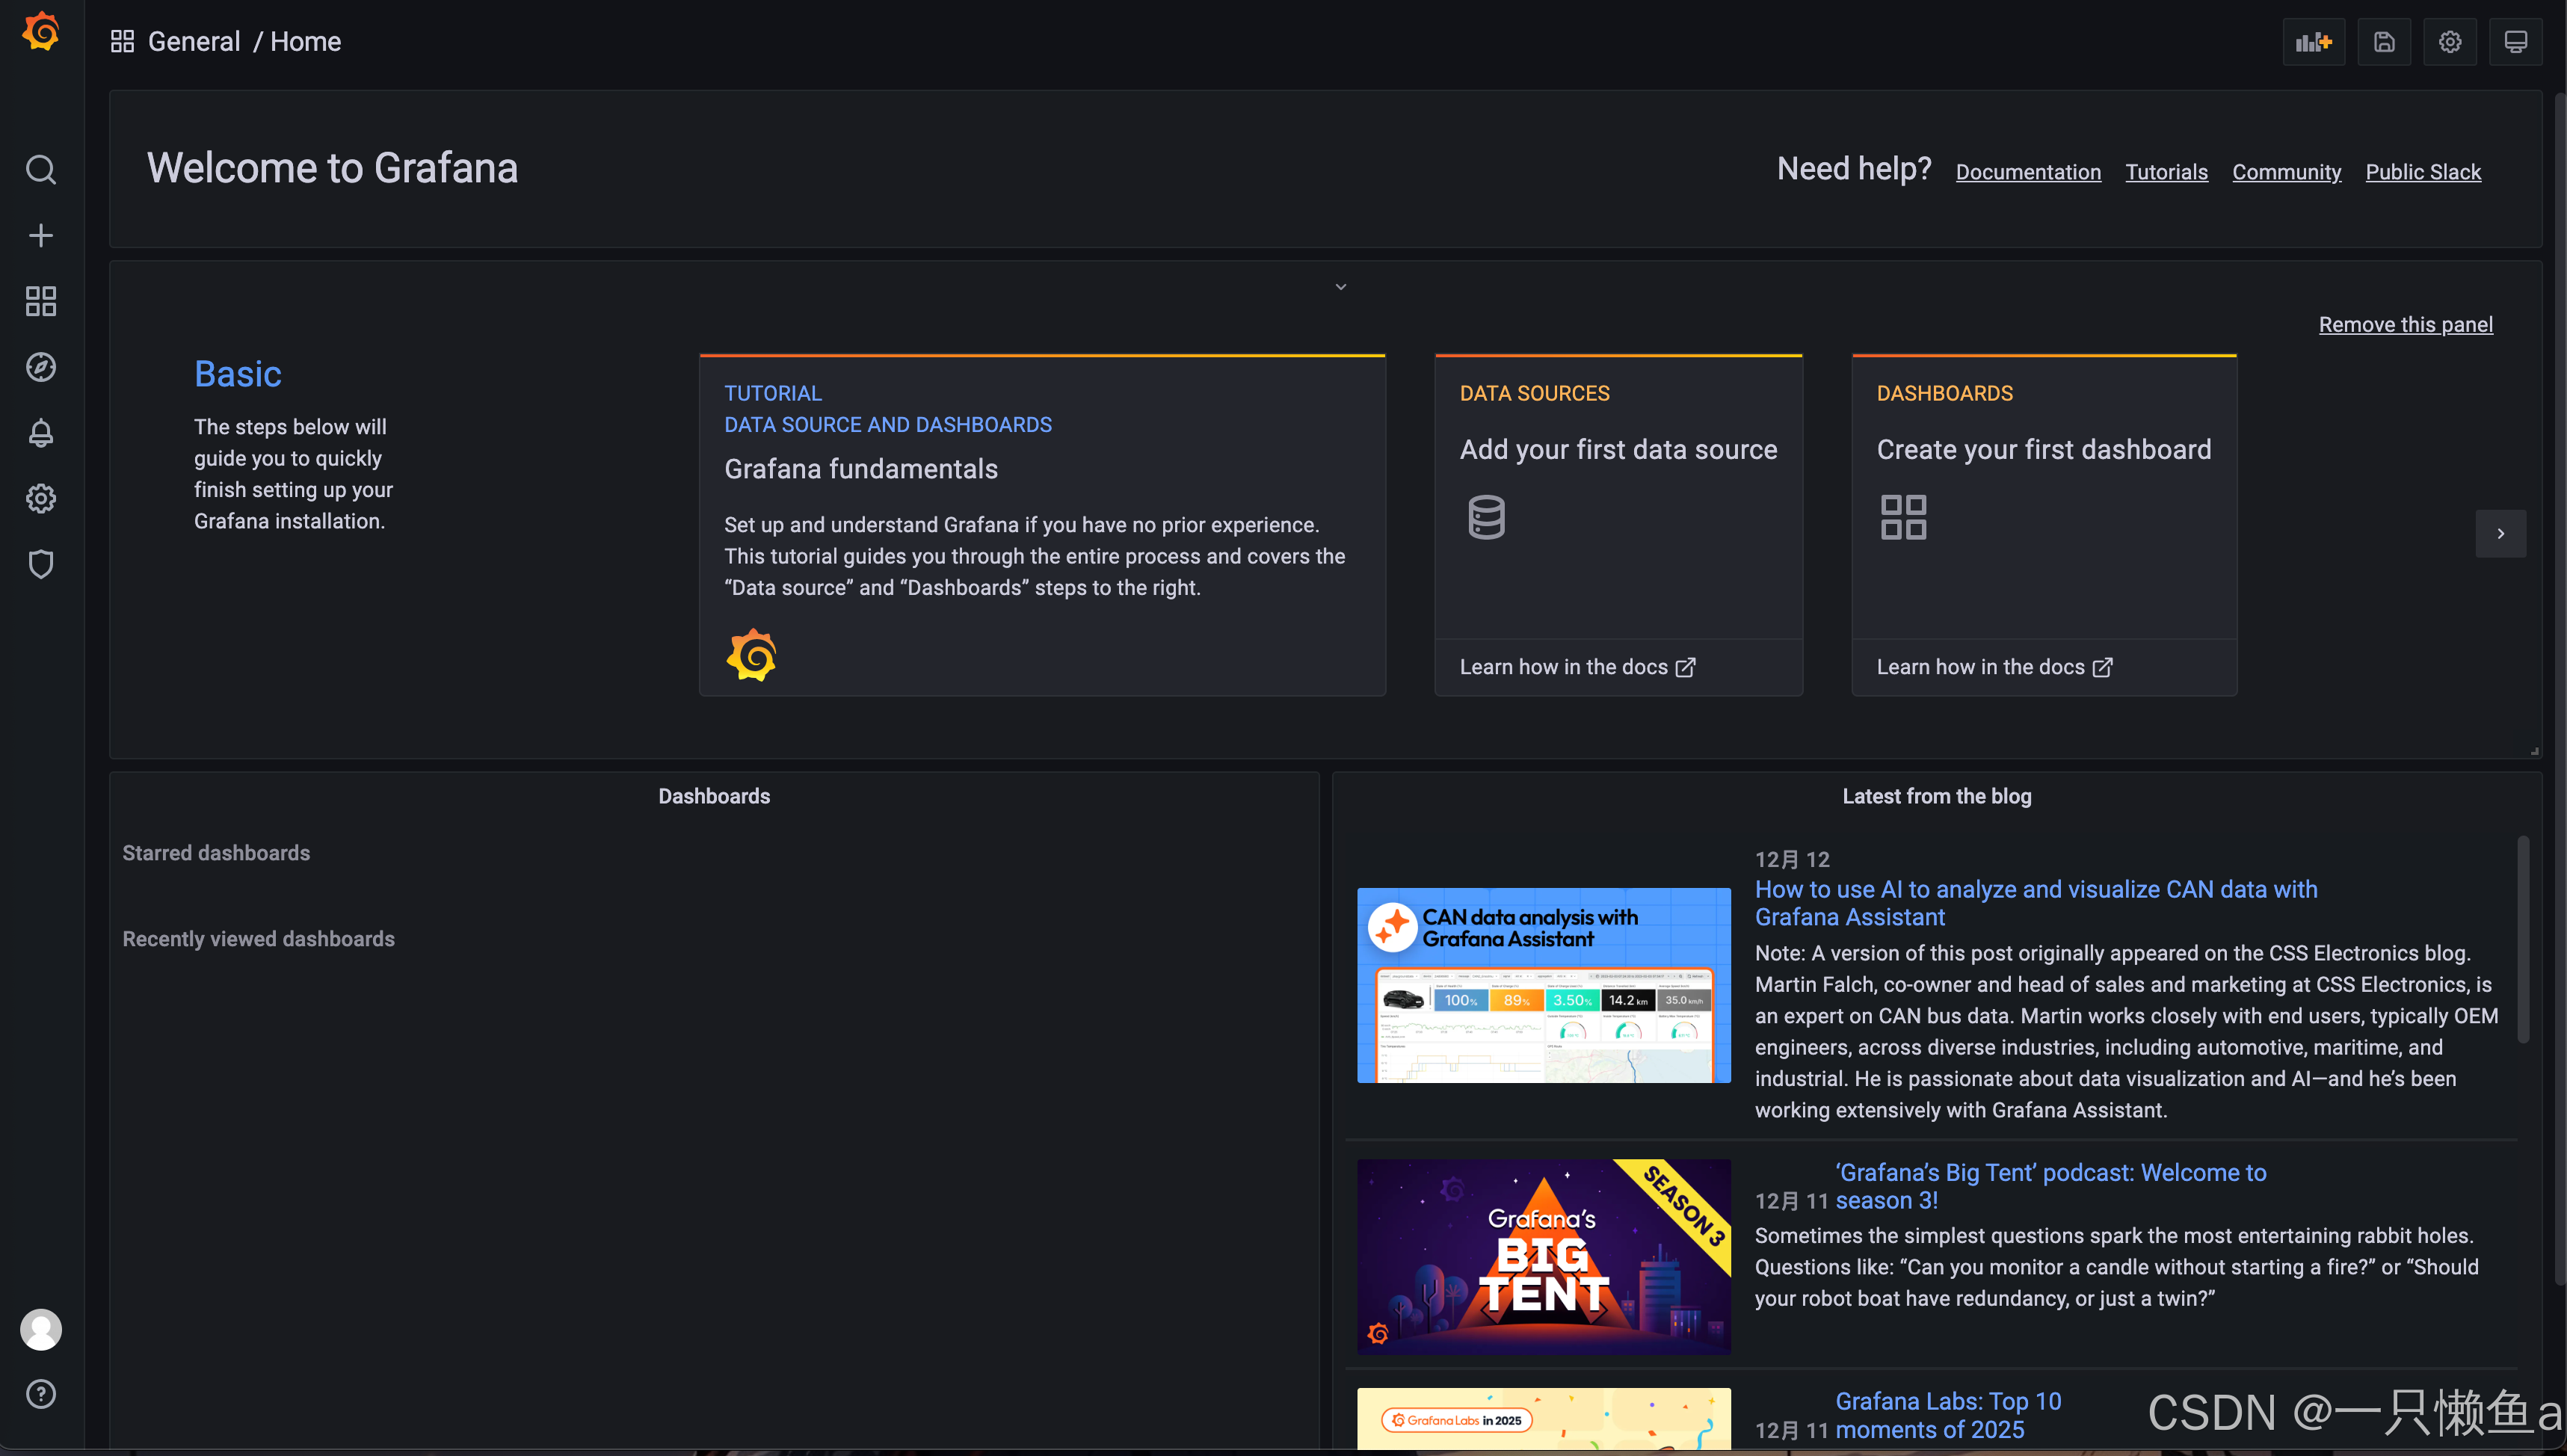
通过了浏览器访问 http://IP:3000 就能访问到登陆页面,默认用户名:admin 密码:admin
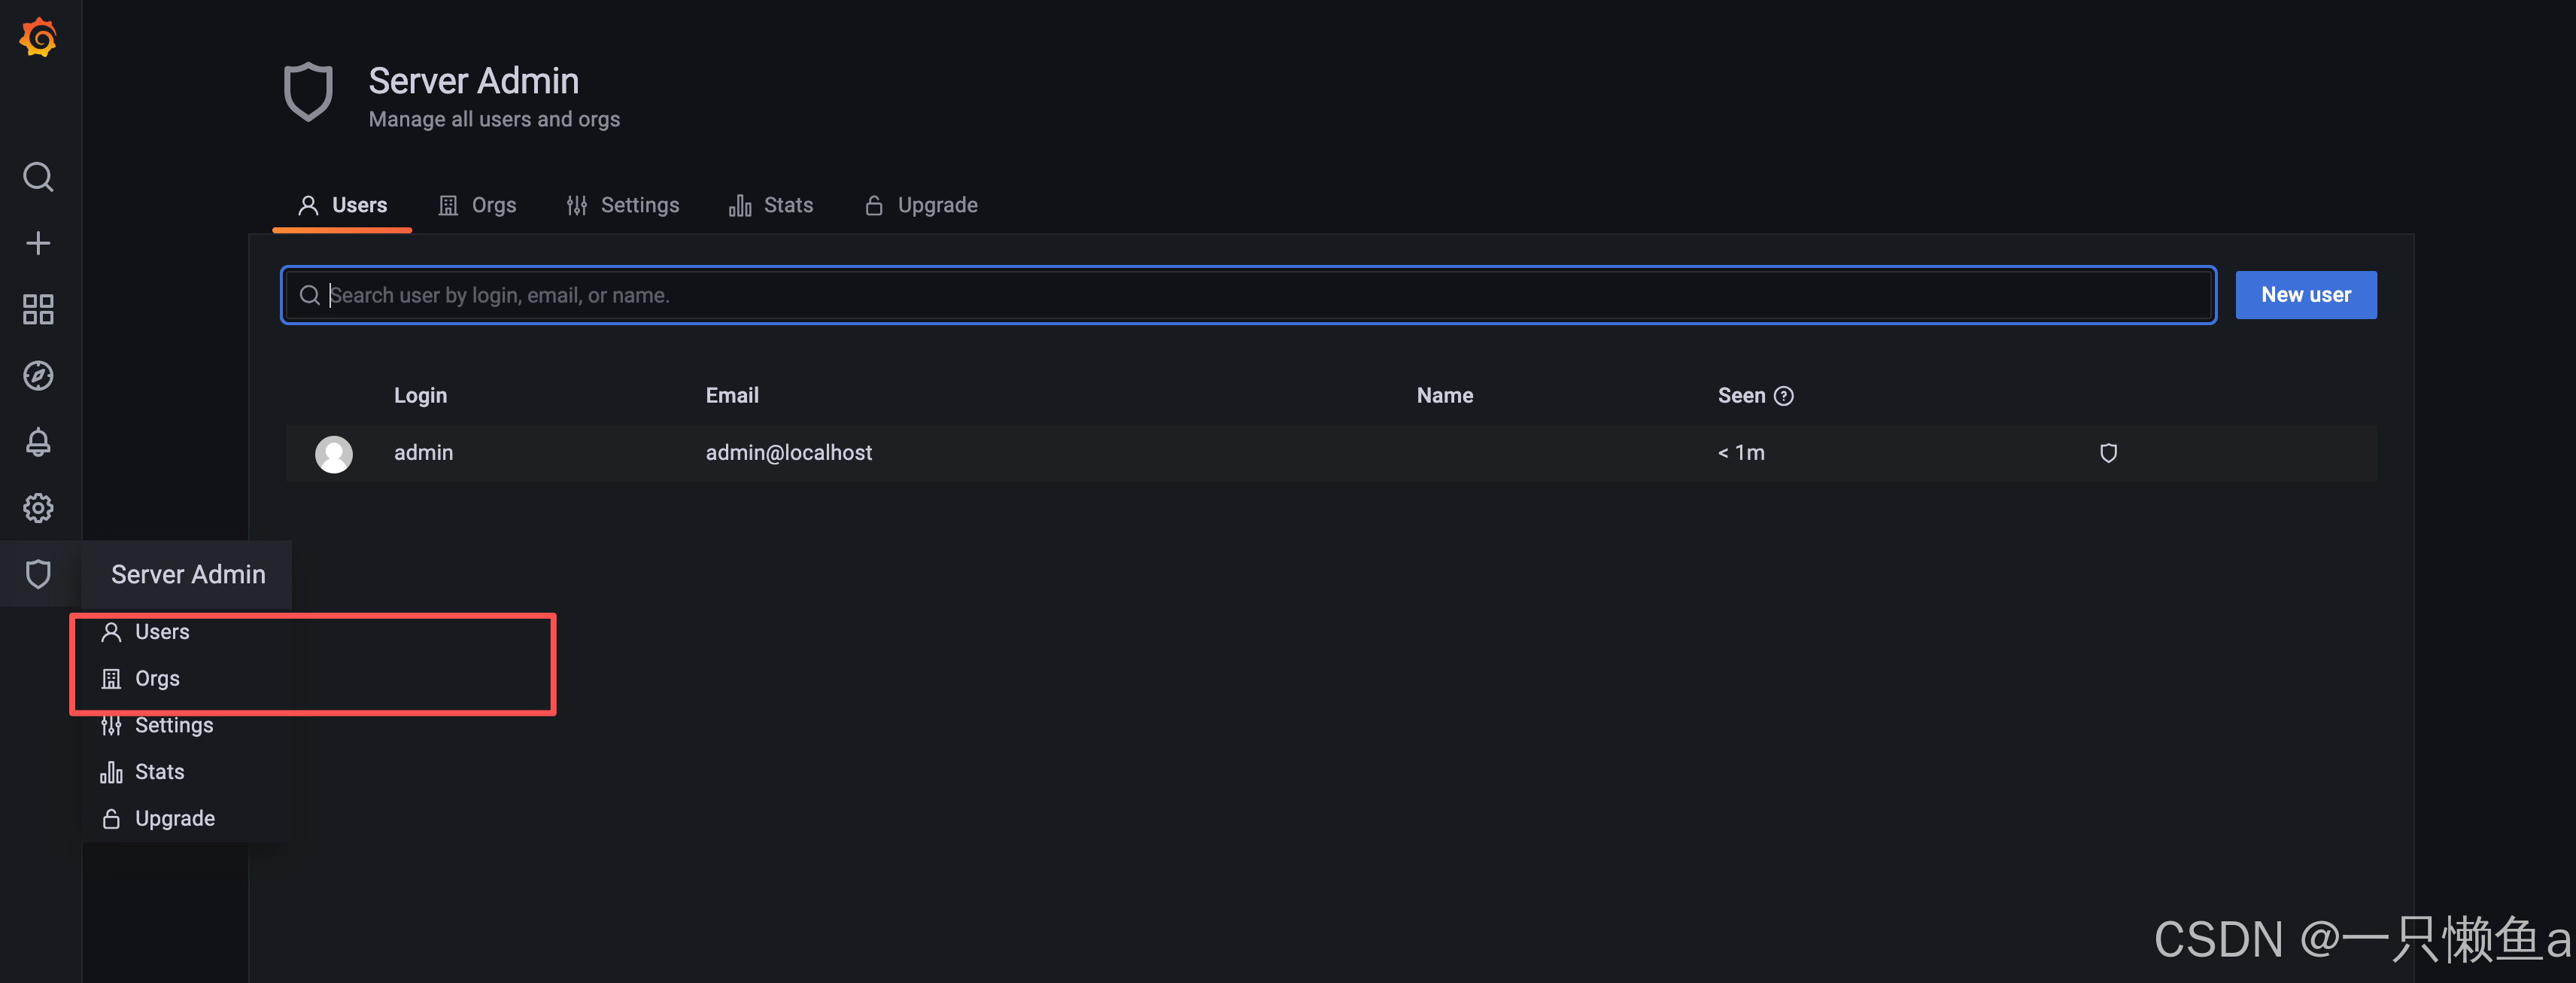
5.3.1 菜单说明
- 用户
- Grafana 里面用户有三种角色 admin,editor,viewer
- admin 权限最高,可以执行任何操作,包括创建用户,新增 Datasource、DashBoard。
- editor 角色不可以创建用户,不可以新增 Datasource,可以创建 DashBoard。
- viewer 角色仅可以查看 DashBoard
- 组织
- 每个用户可以拥有多个 Organization,用户登录后可以在不同的 Organization 之间切换
- 不同的 Organization 之间完全不一样,包括 datasource,dashboard 等都不一样
- 创建一个 Organization 就相当于开了一个全新的视图,所有的 datasource,dashboard 等都要再重新开始创建
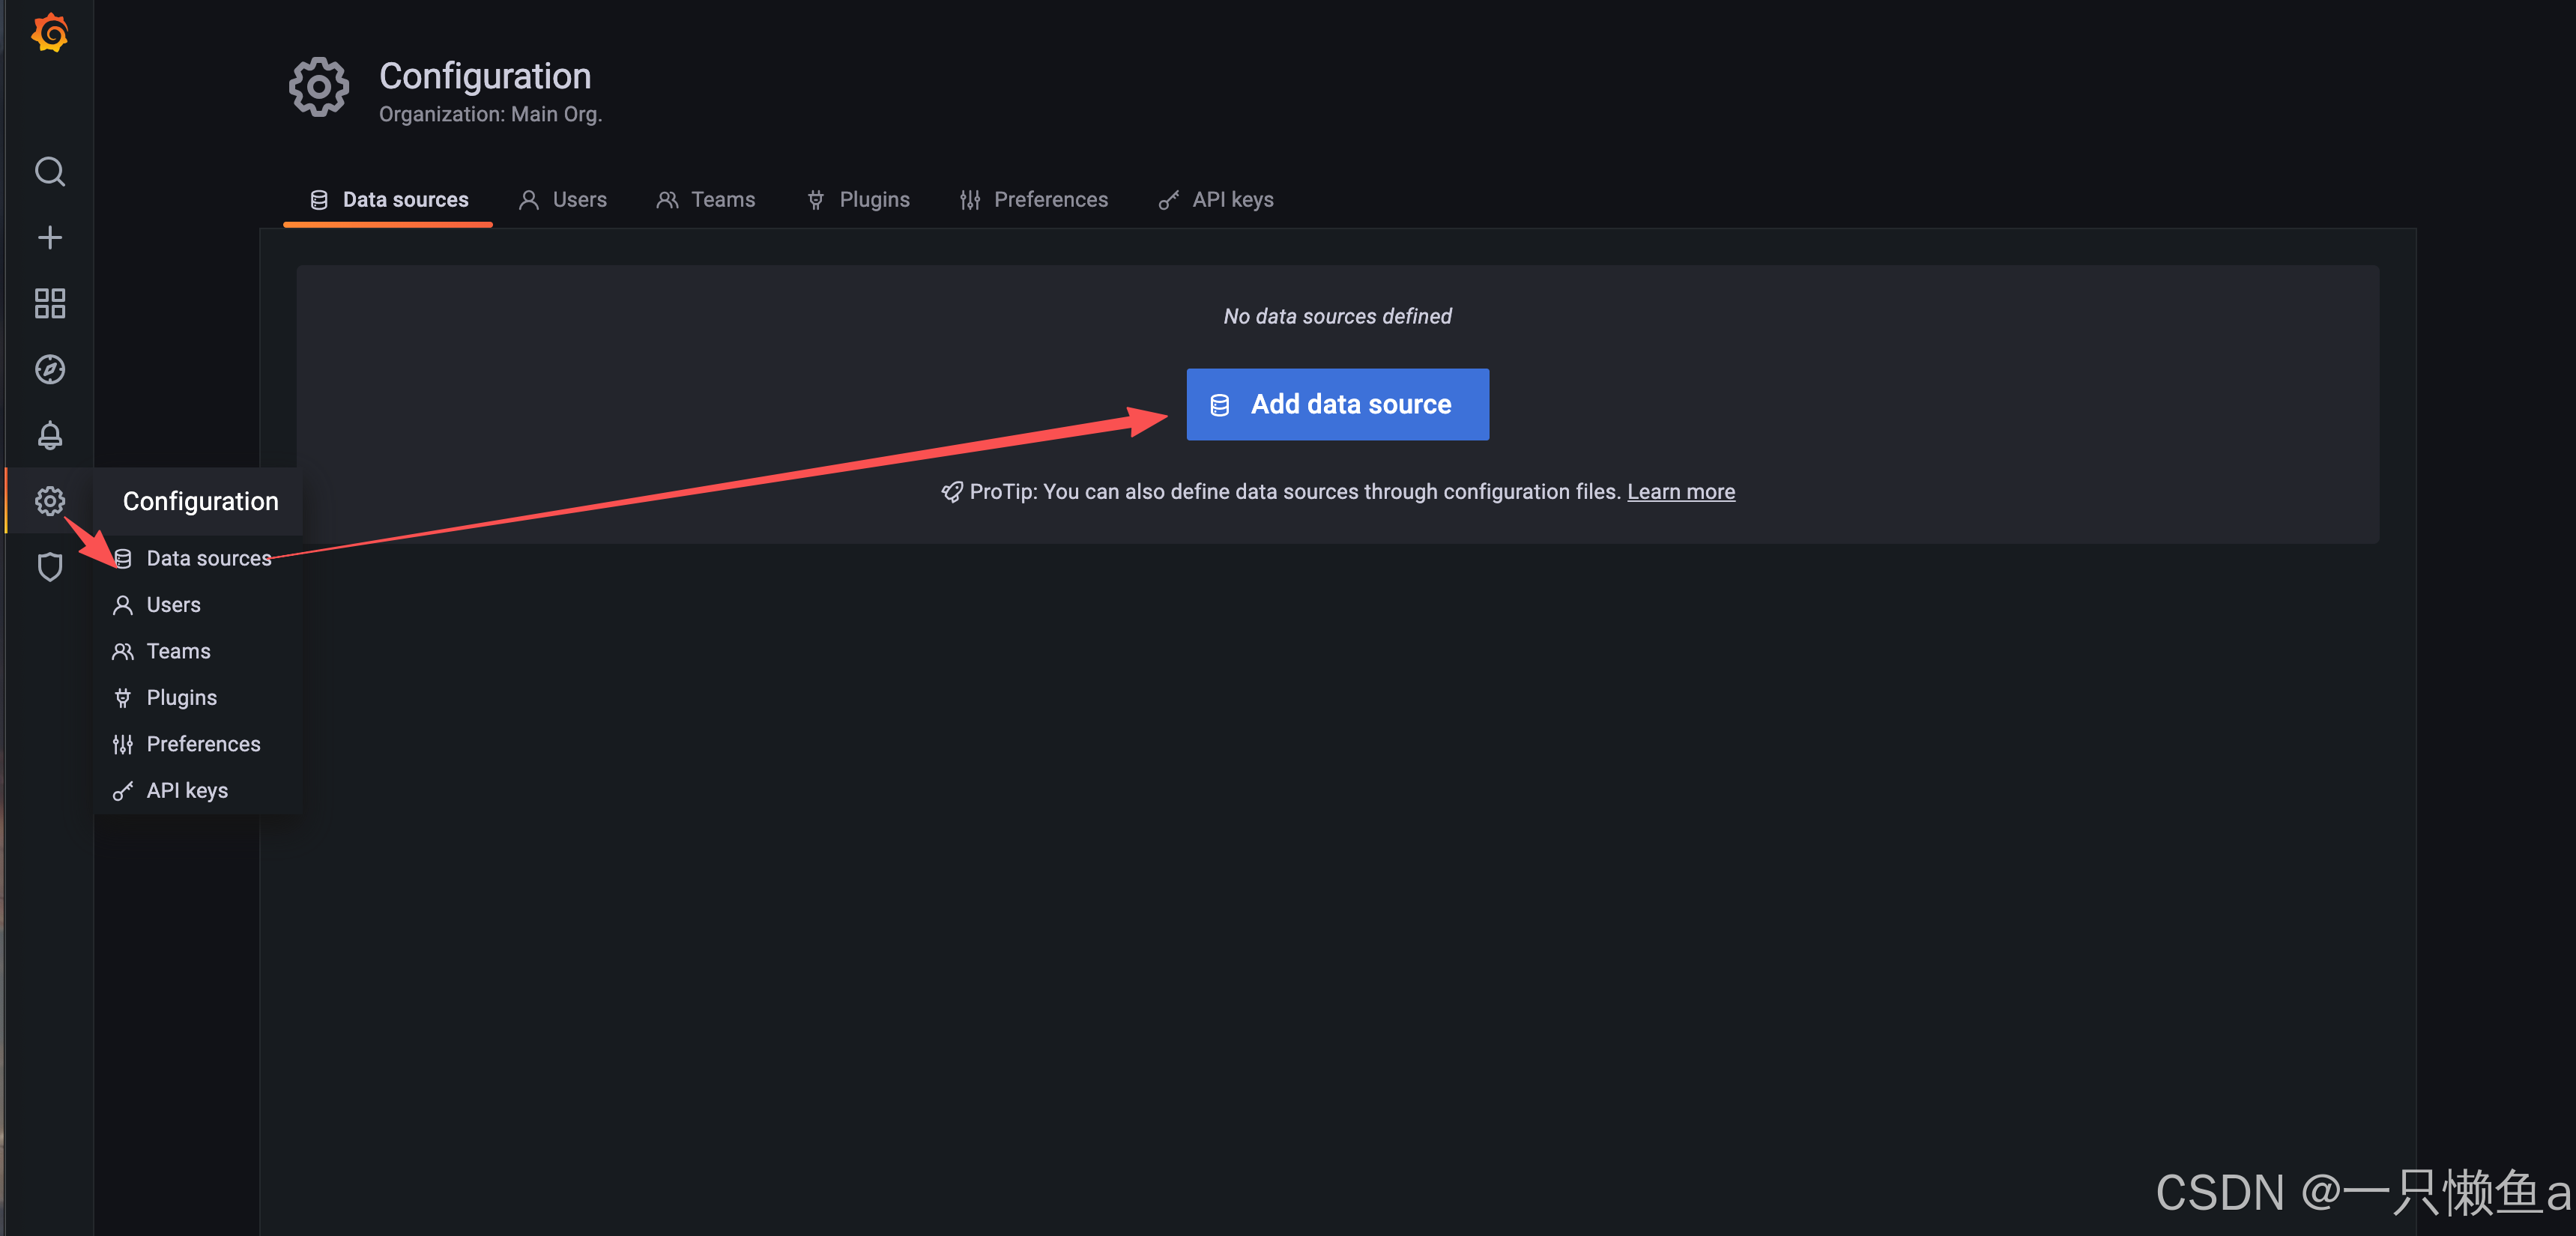
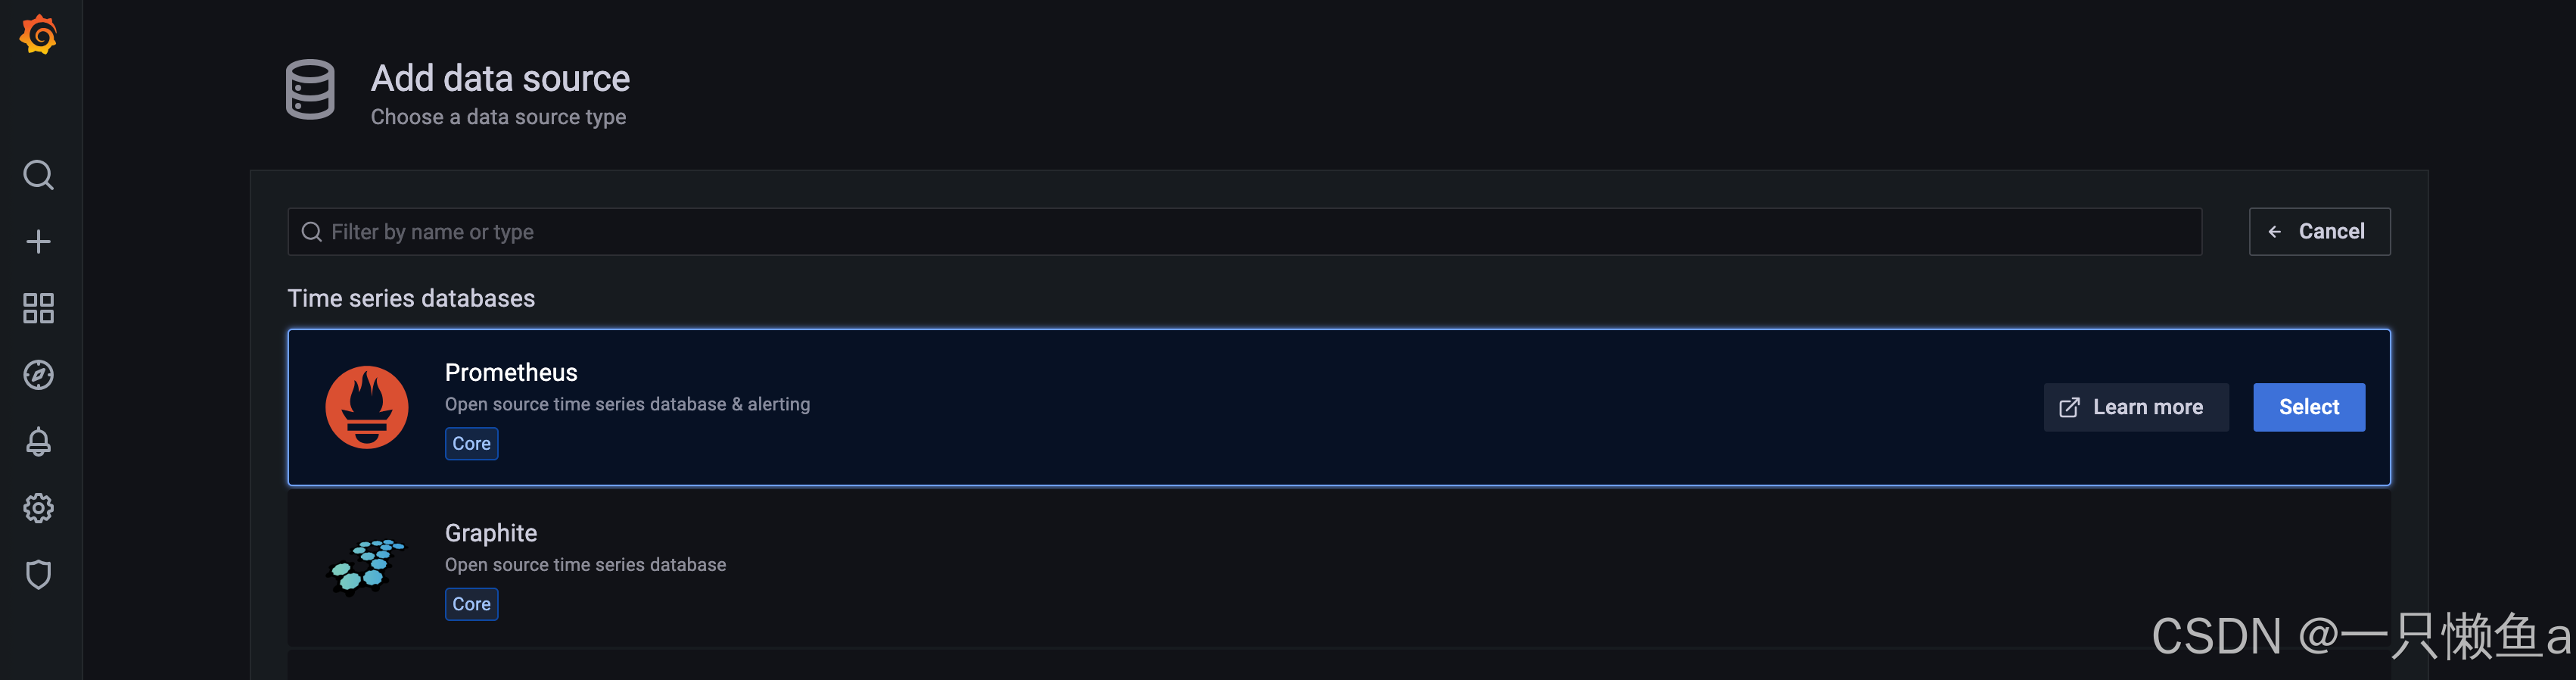
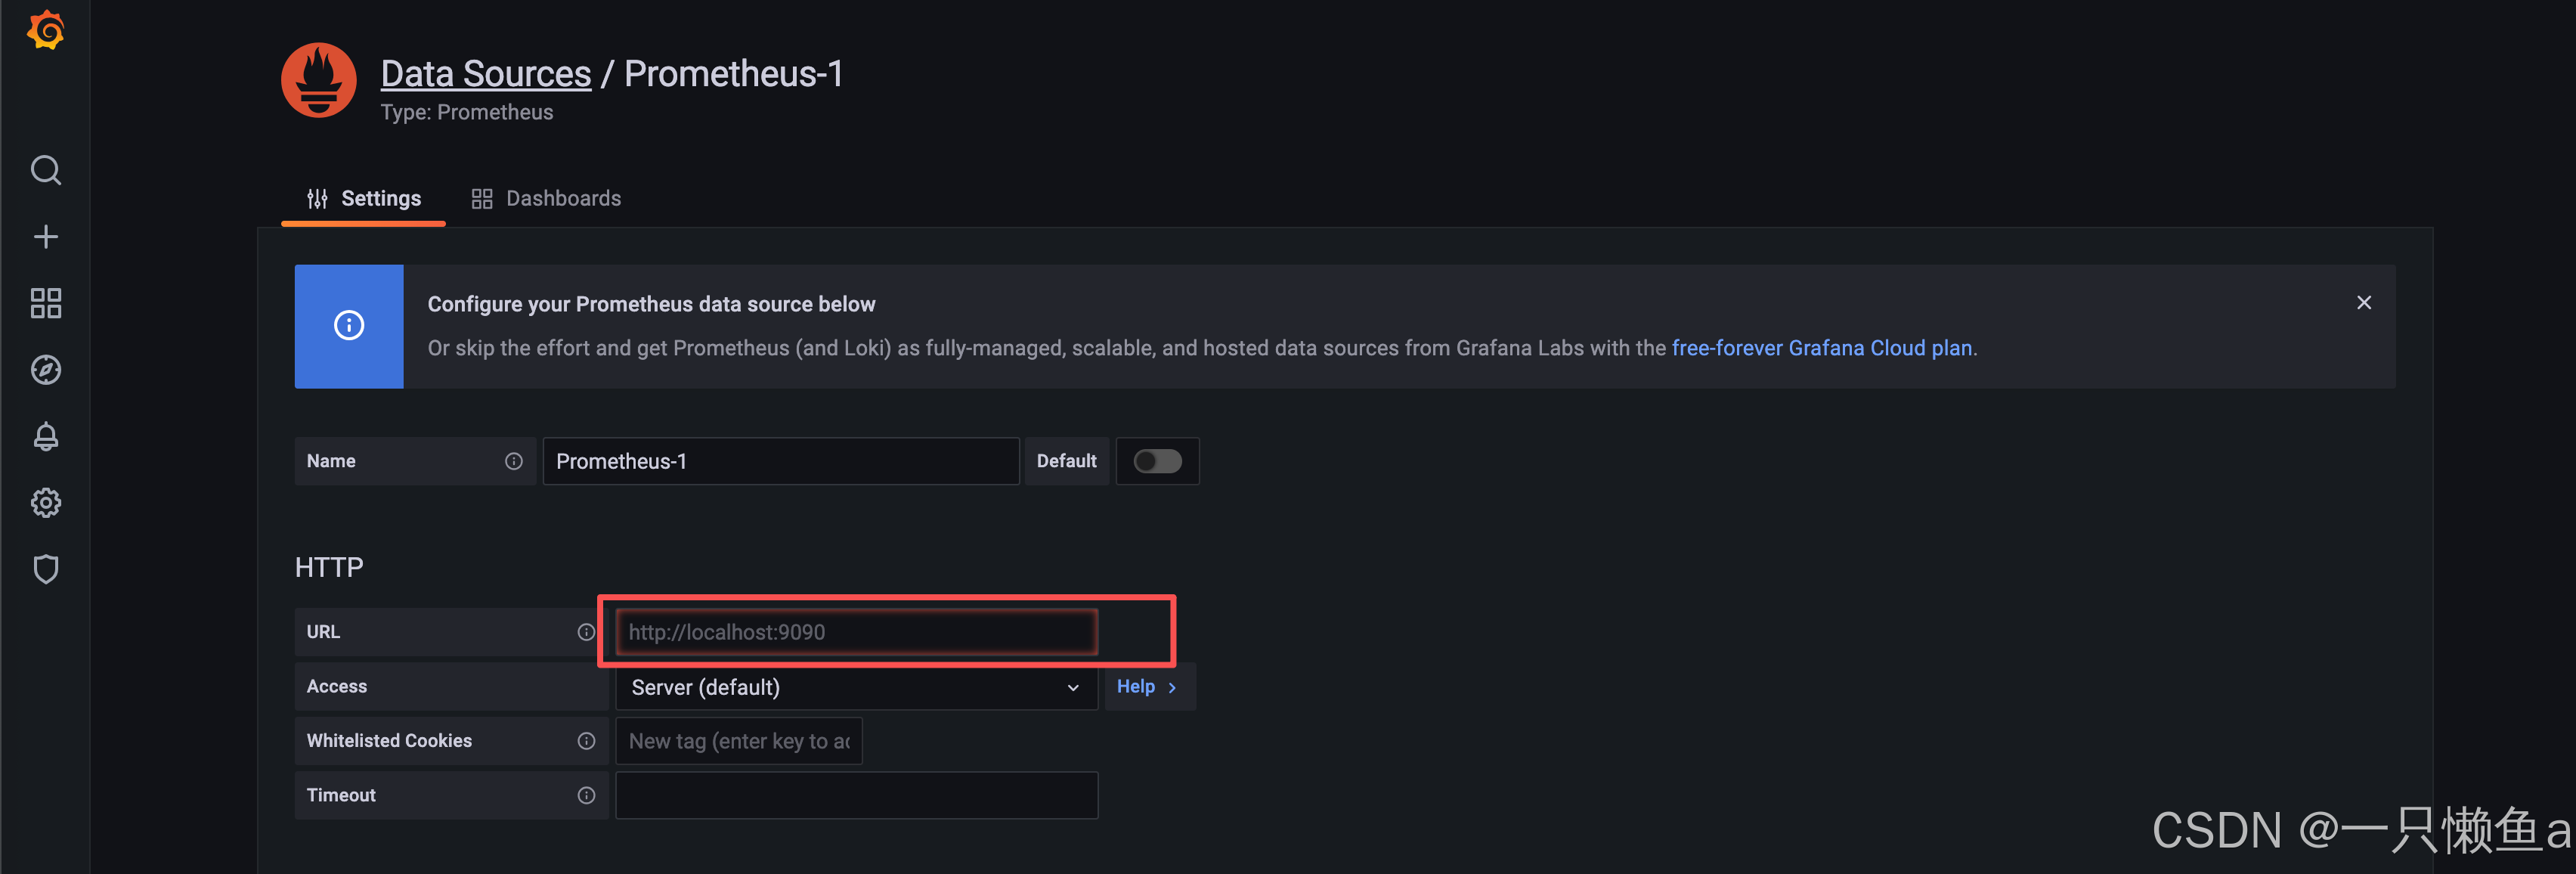
5.3.2 配置数据源
- Grafana 支持多种不同的时序数据库数据源,对每种数据源提供不同的查询方法,而且能很好的支持每种数据源的特性
- 可以将多个数据源的数据合并到一个单独的仪表板上
5.3.3 仪表盘(Dashboard)
- 最重要 UI 界面 仪表盘,通过数据源定义好可视化的数据来源,Dashboard 来组织和管理数据可视化图表
- 仪表盘可以视为一组一个或多个面板组成的一个集合,来展示各种各样的面板
5.3.4 面板 (Panel)
- Panel 在一个 Dashboard 中一个最基本的可视化单元为一个 Panel(面板)
- 通过 Panel 的 Query Editor(查询编辑器)为每一个 Panel 添加查询的数据源以及数据查询方式,每一个 Panel 都是独立的
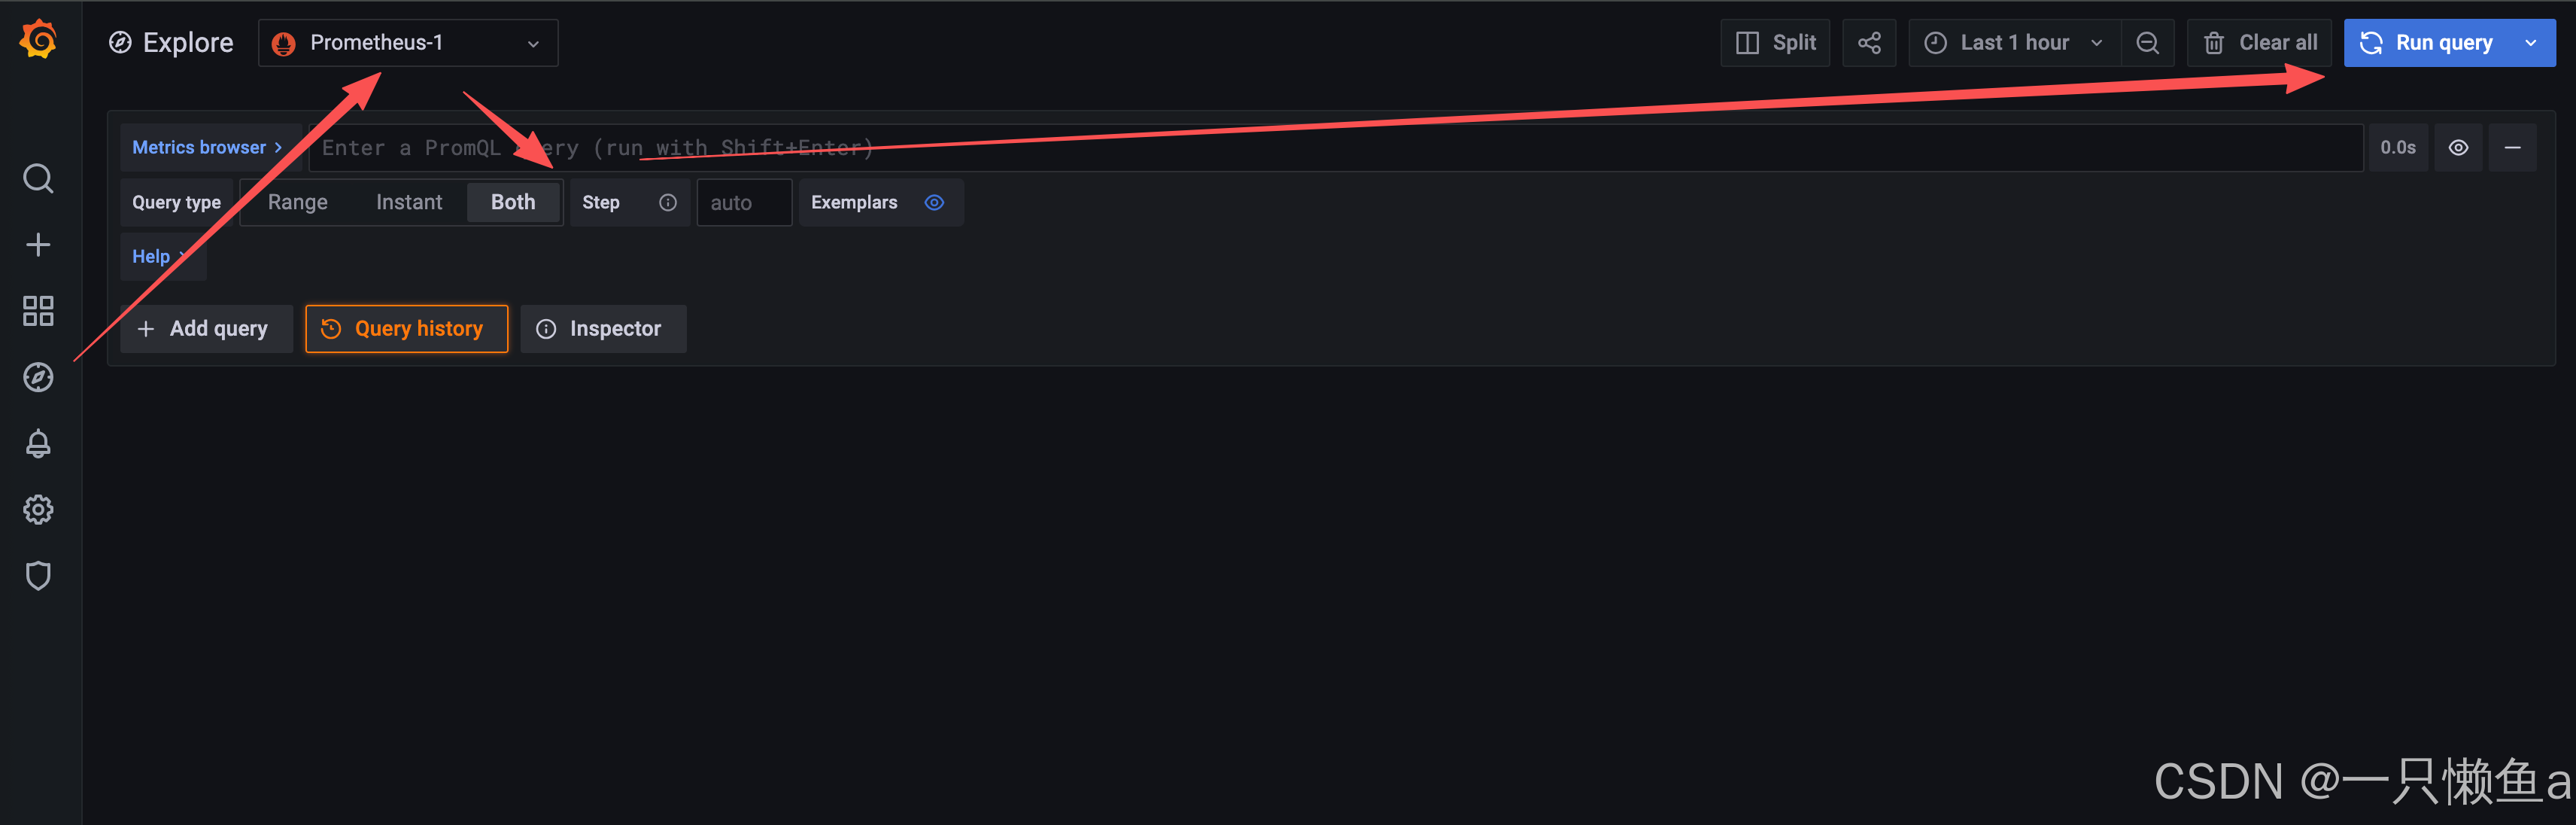
5.3.5 探索 (explore)
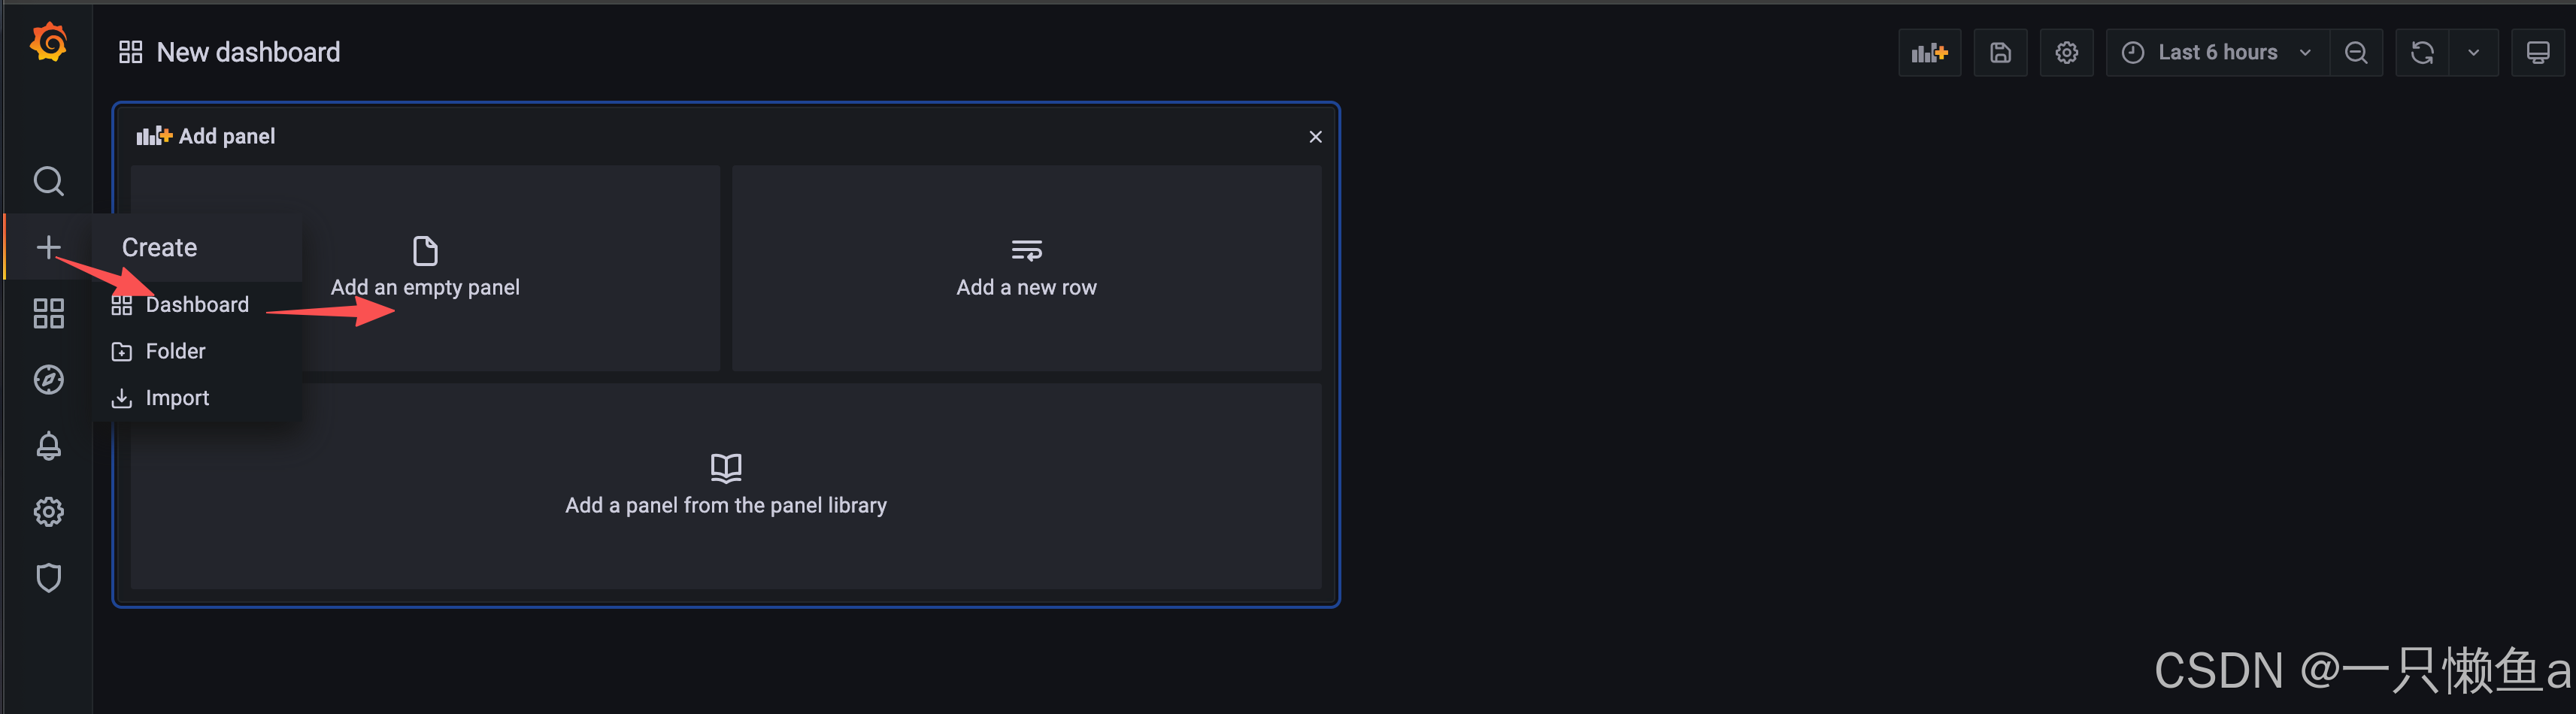
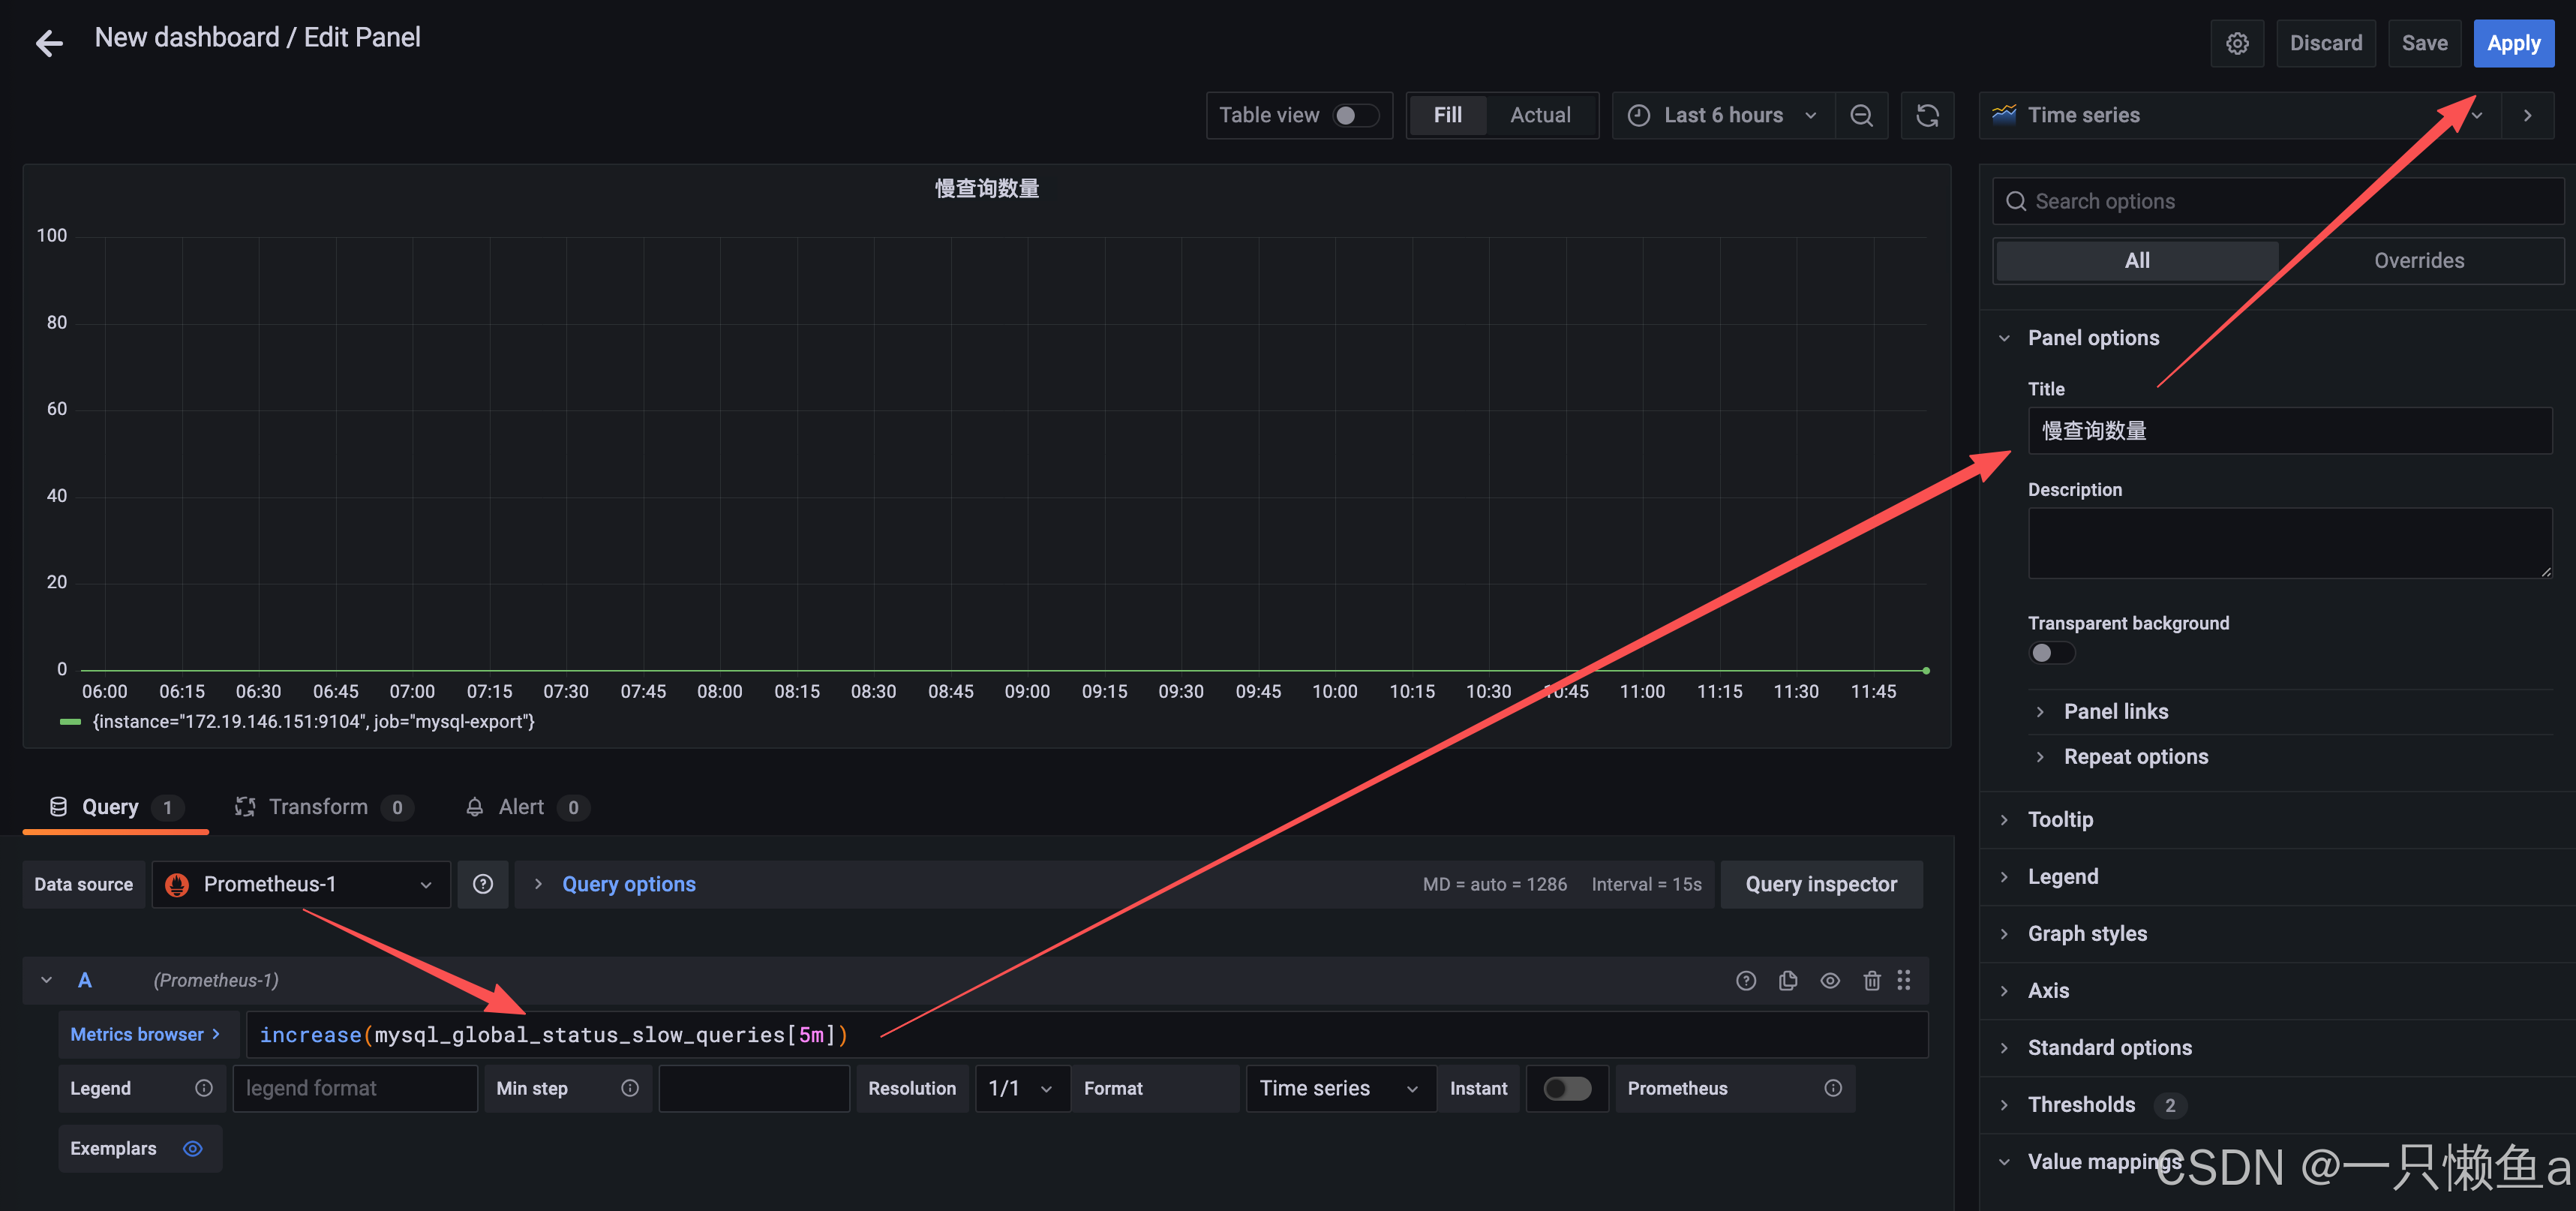
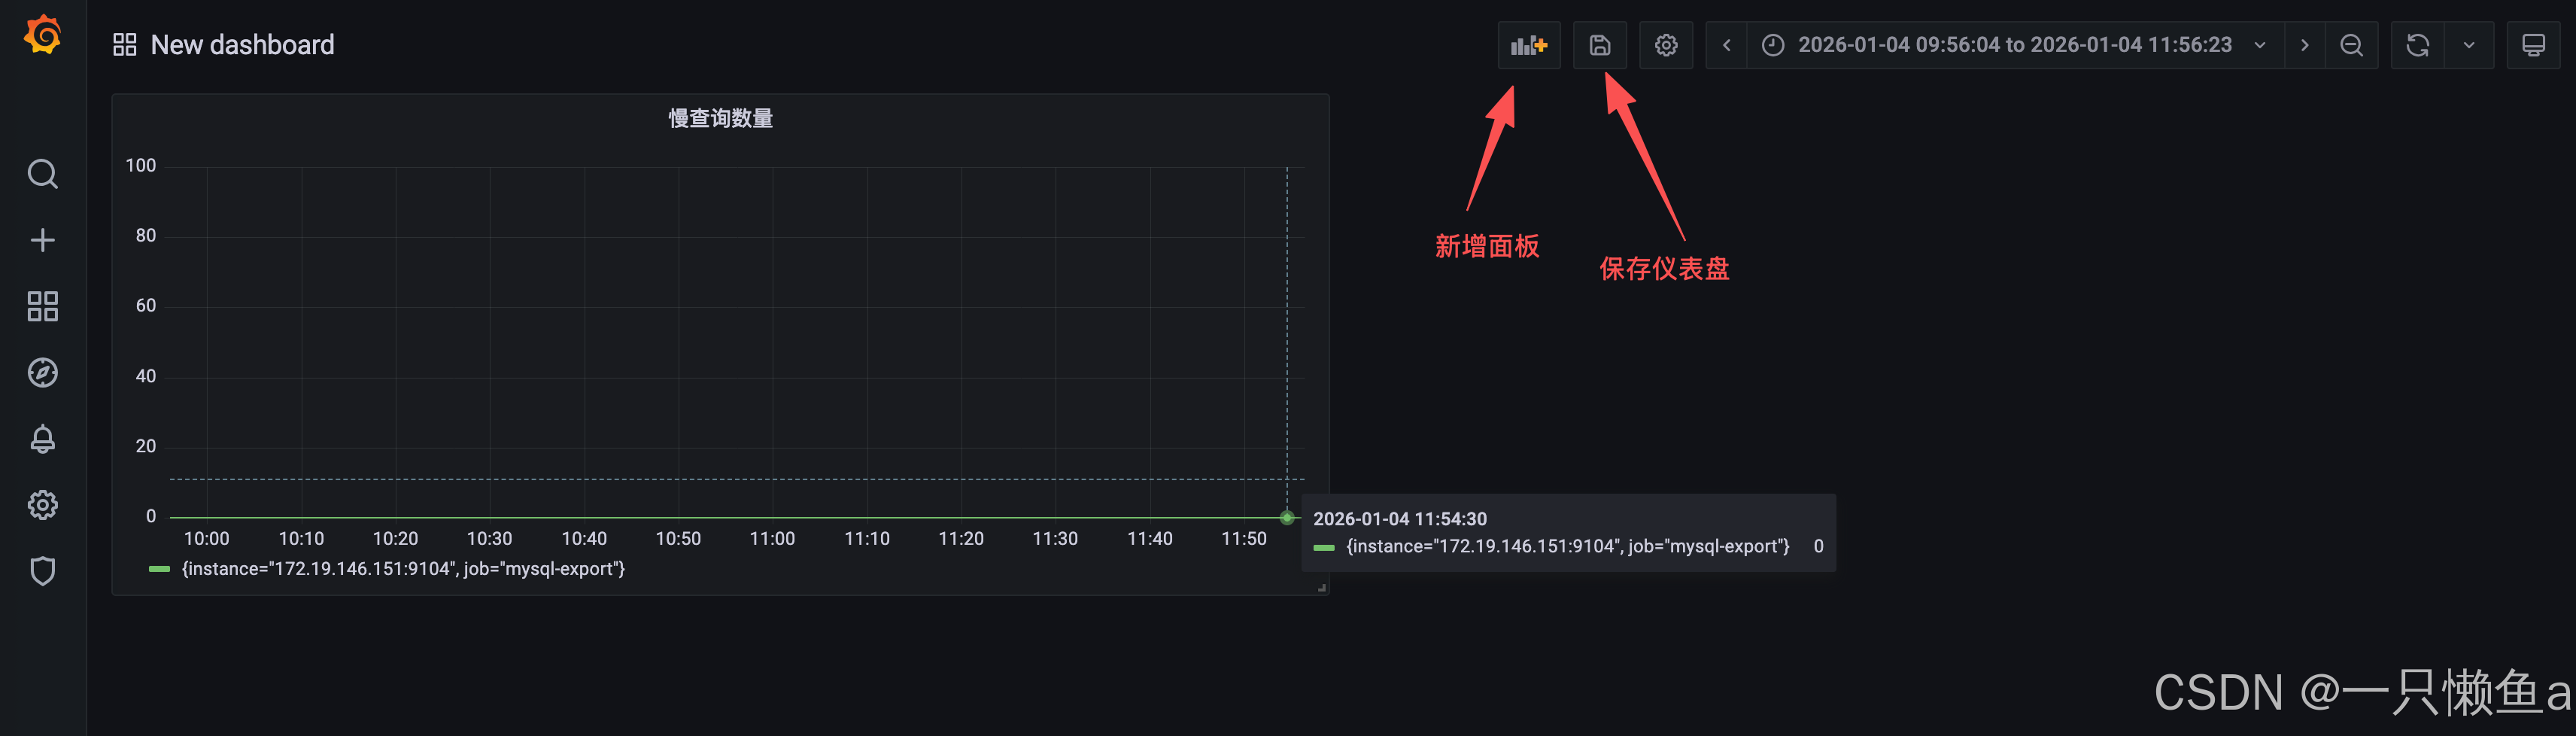
5.3.6 创建Dashboard,新增面板
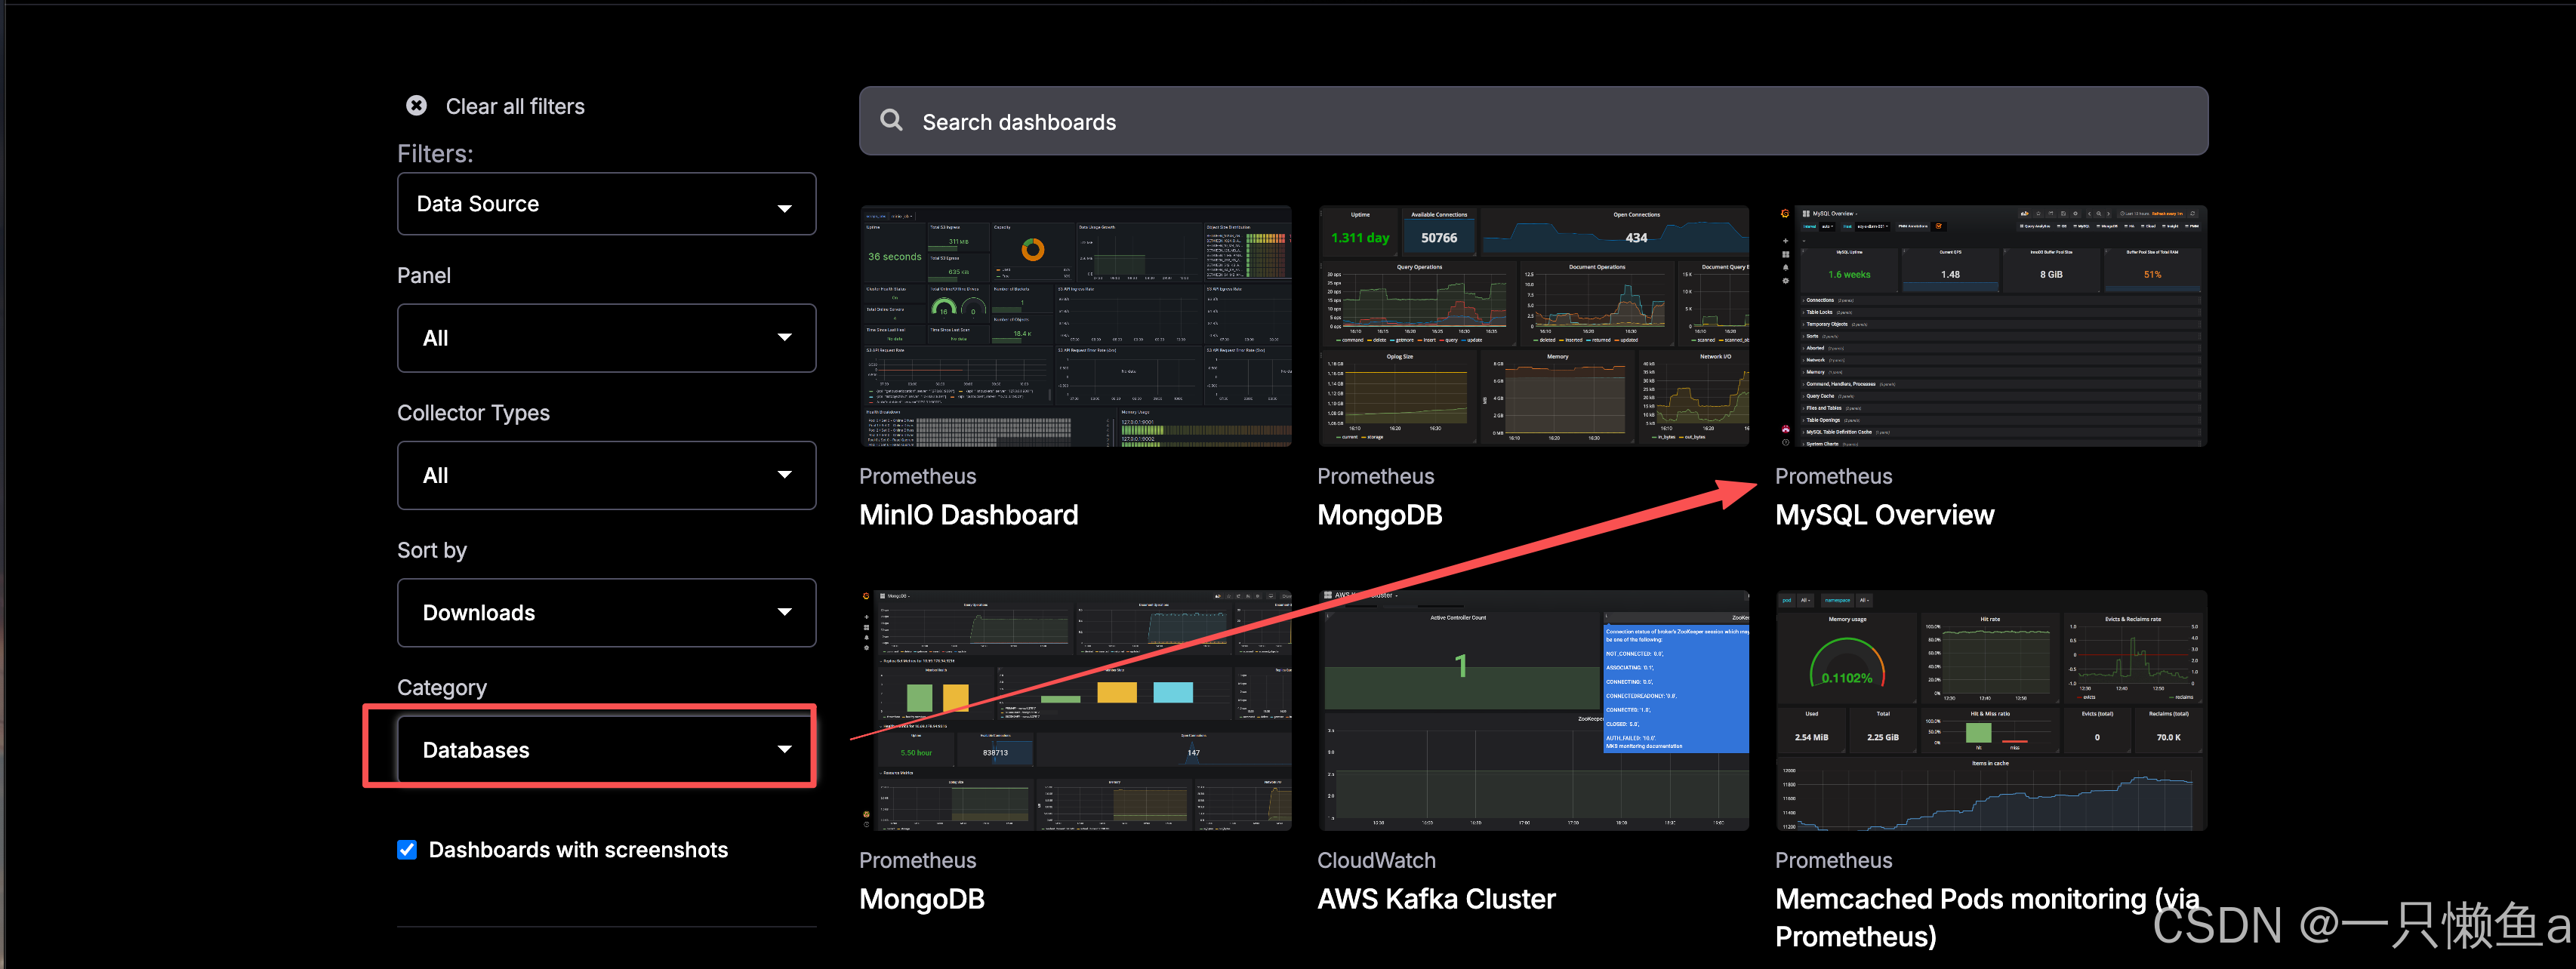
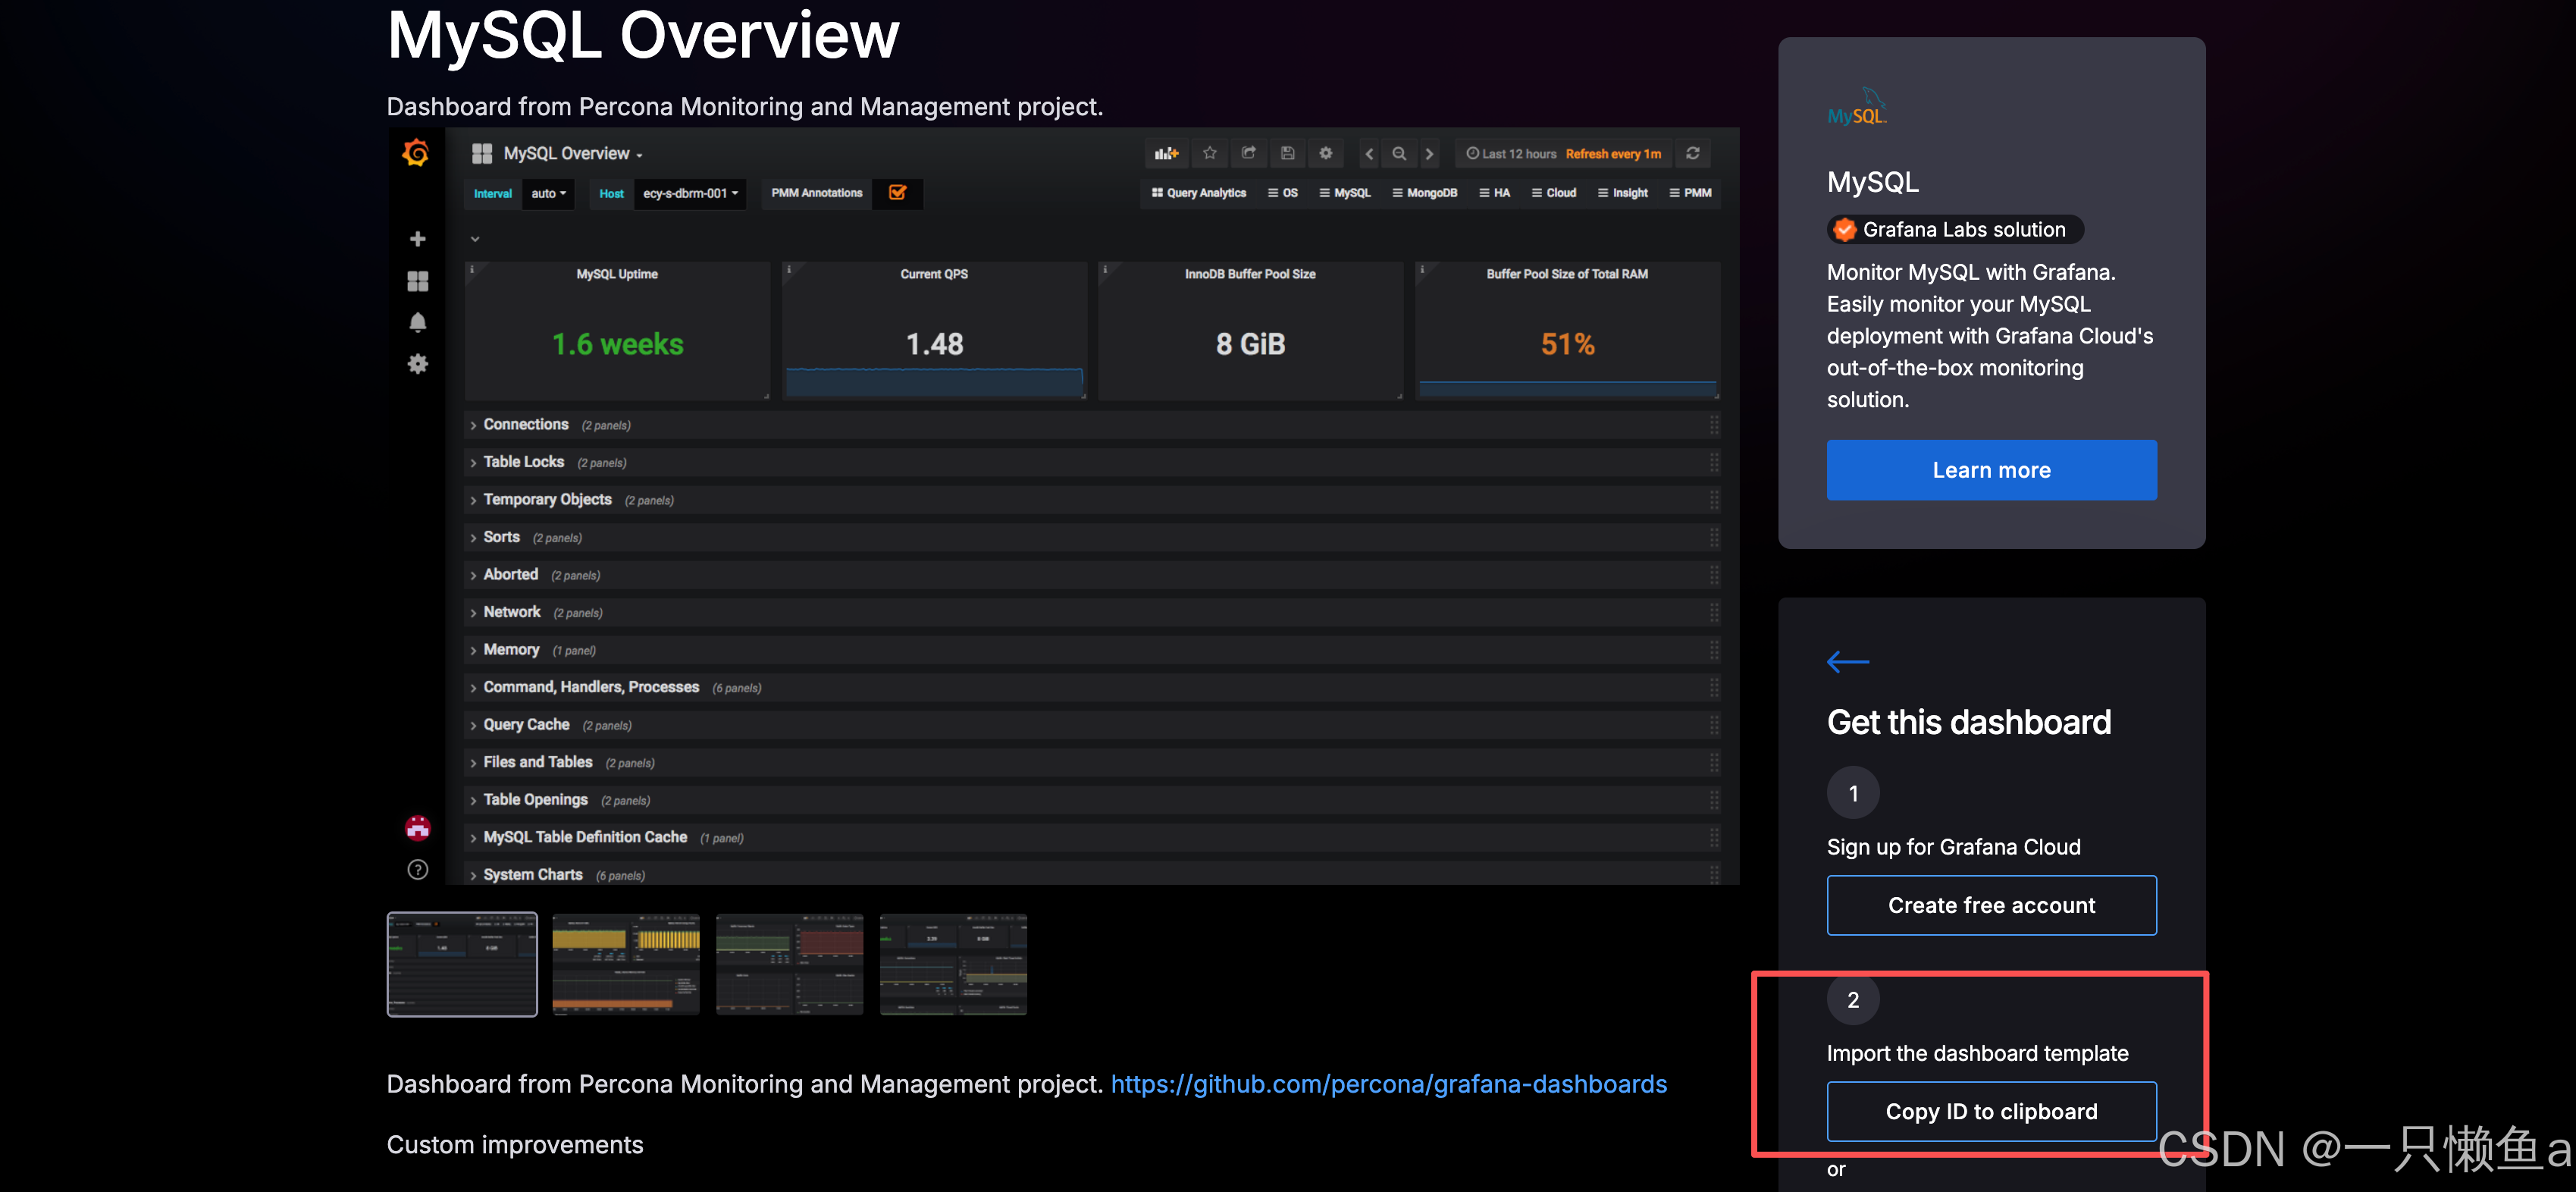
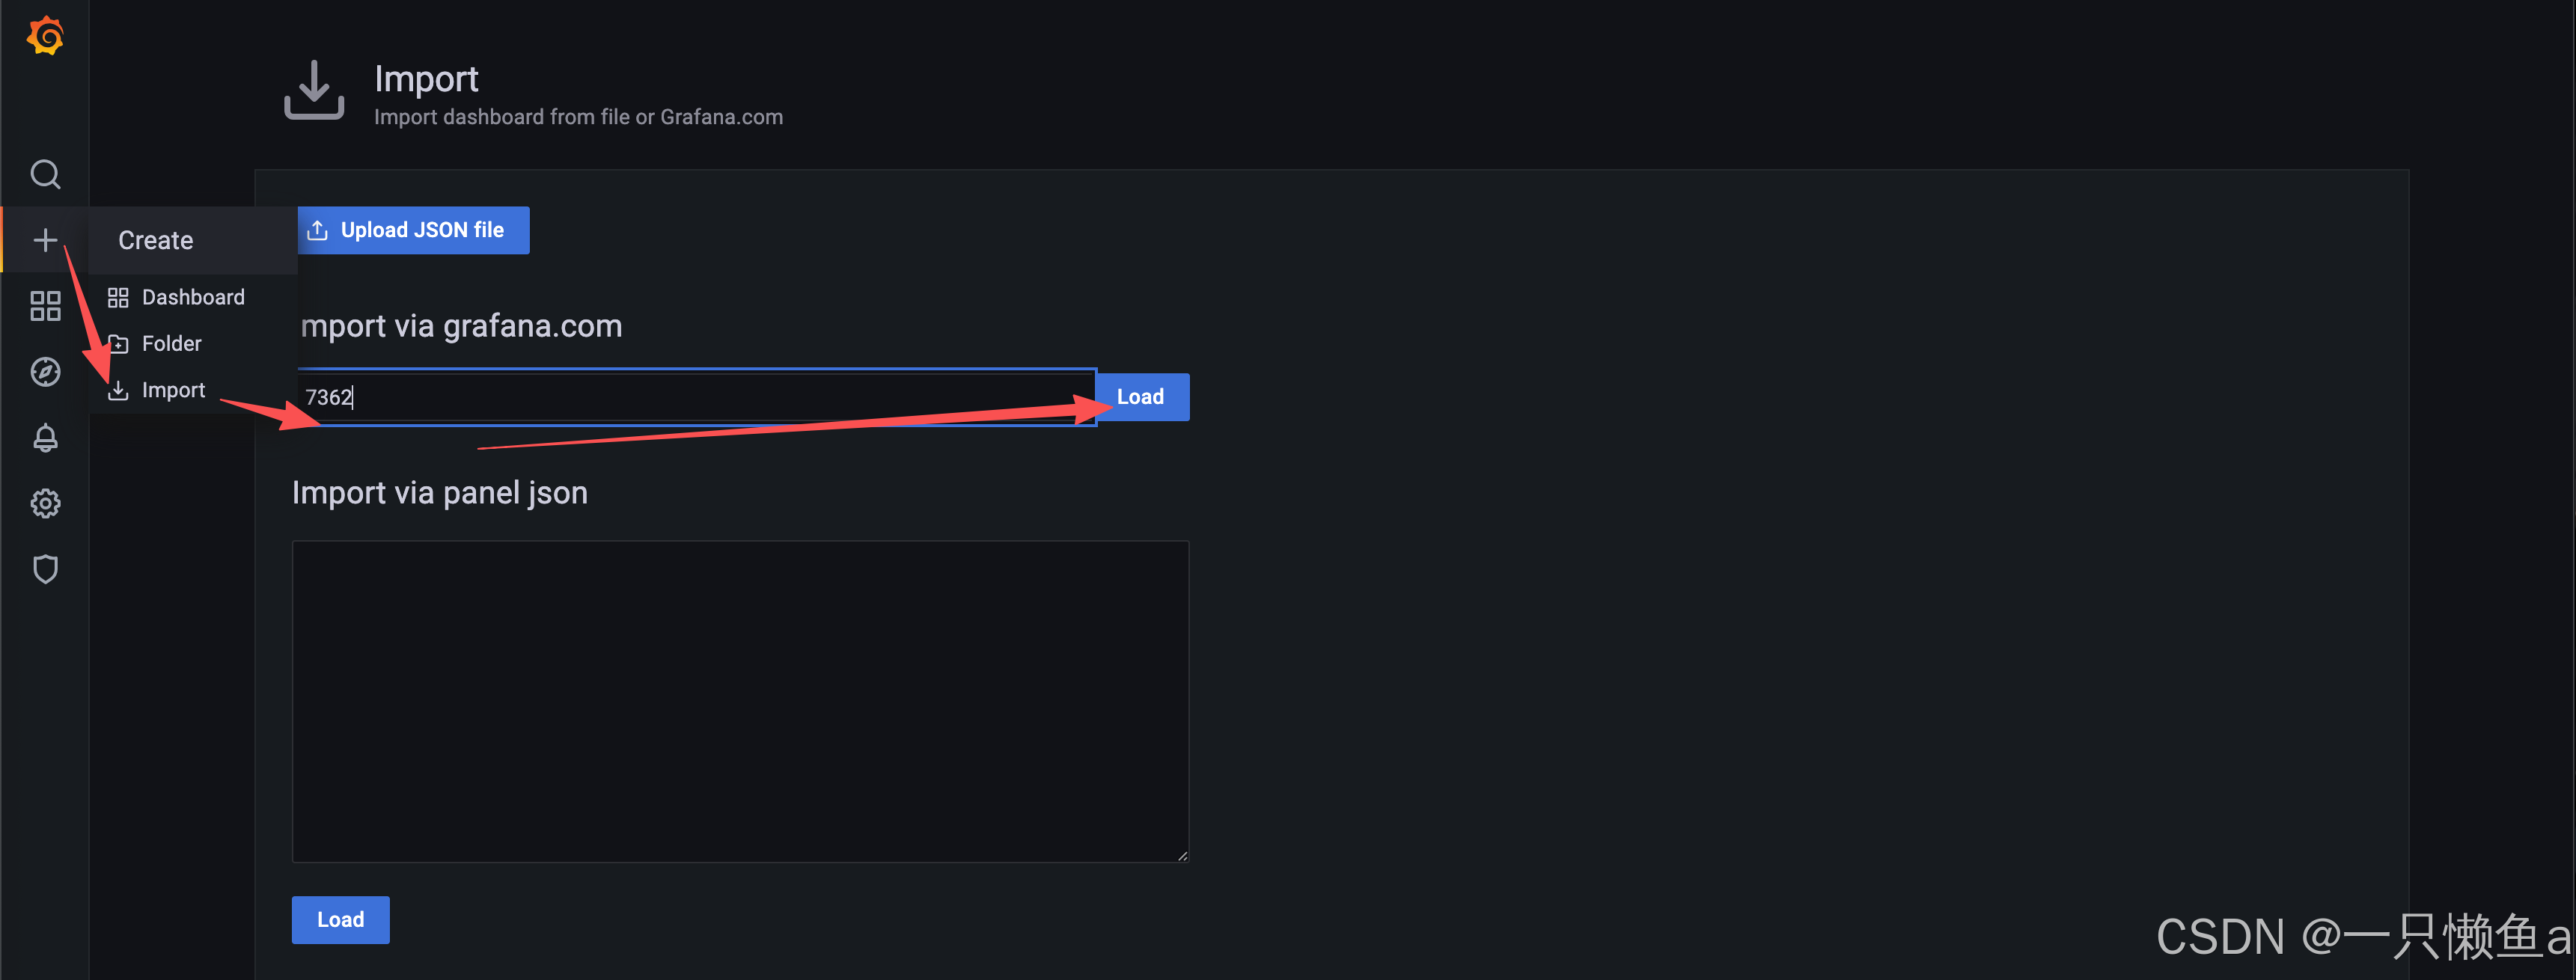
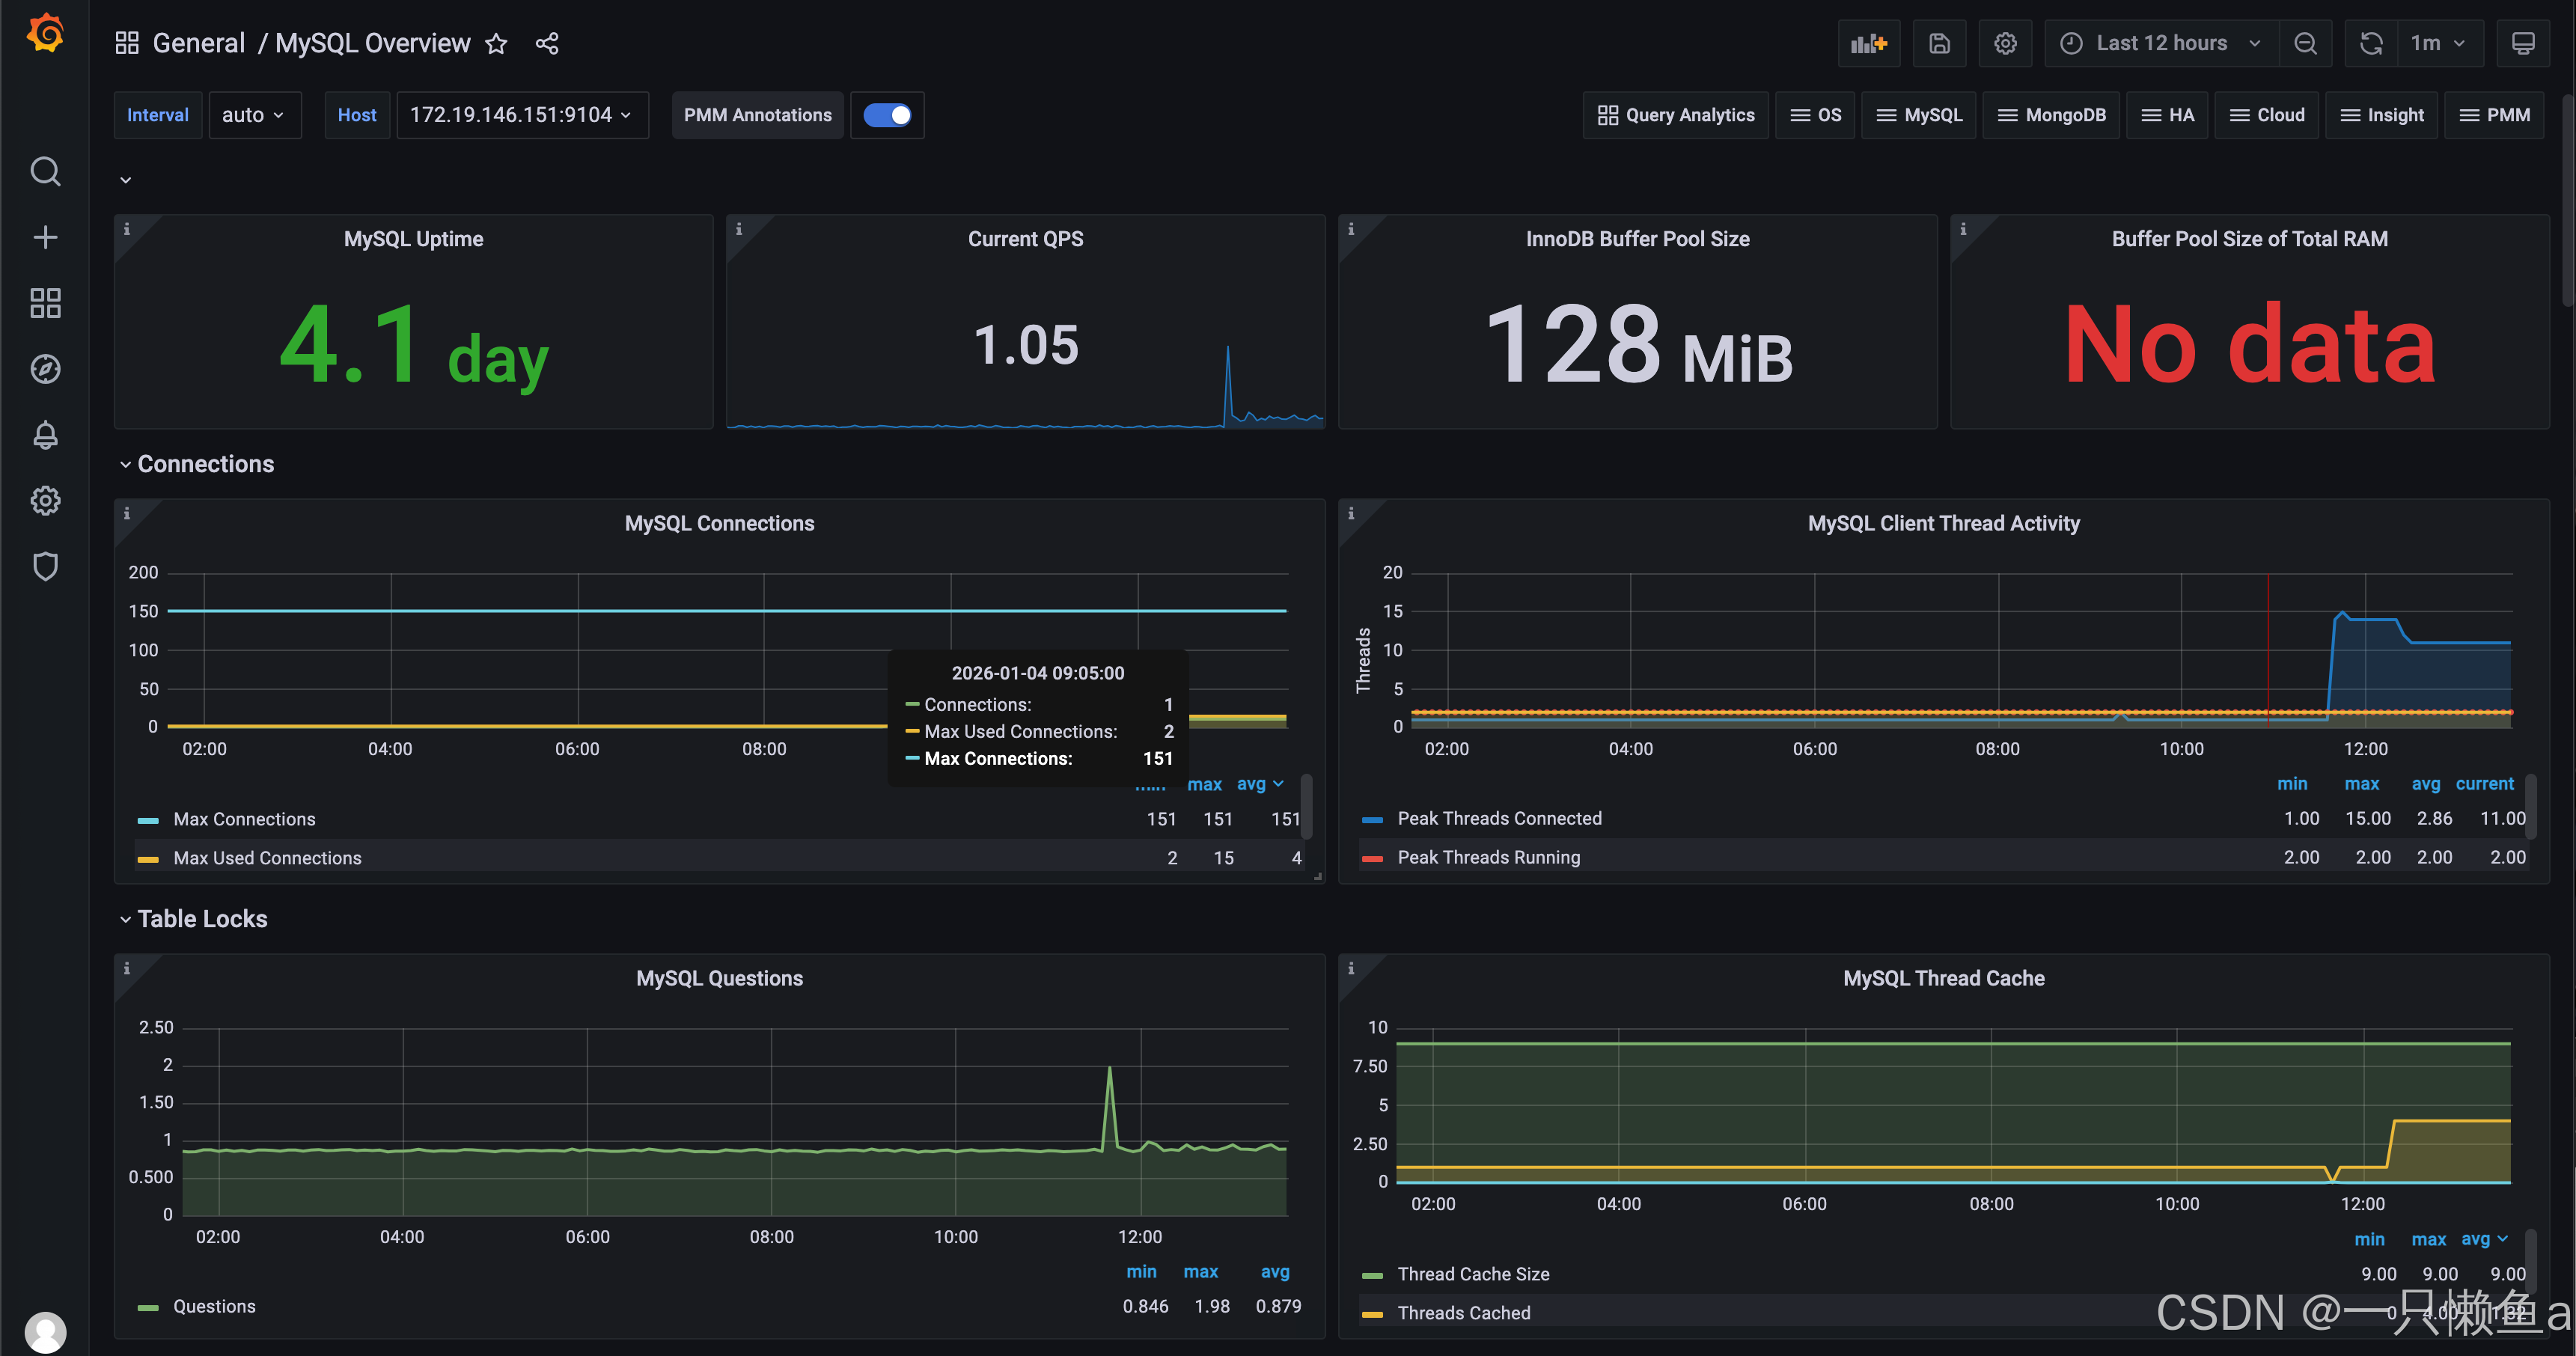
5.3.7 Grafana应用市场(高效导入仪表盘)
- 地址:https://grafana.com/grafana/dashboards/
- 是Grafana社区和其他用户分享的可装载的仪表板和面板集合
- 当安装应用程序市场模板时,Grafana会自动安装和配置自定义仪表板面板,并可以自动设置相关数据源
- 应用市场模板可以是来自Grafana仓库、别人的GitHub仓库、开源项目或个人创建的
- Grafana模板使得共享可装载的仪表板变得容易,从而帮助用户减少了工作量,并促进了最佳设置和最佳配置的使用
6. Springboot集成Prometheus
6.1 SpringBoot3.X监控Actuator
- Spring Boot Actuator 是 Spring Boot 提供的一个可选模块,用于在运行时监控和管理 Spring Boot 应用程序
- 通过 Actuator可以暴露应用程序的状态、统计信息、日志和其他有用的运行时信息
6.1.1 Actuator使用案例
6.1.1.1 添加依赖
<dependency>
    <groupId>org.springframework.boot</groupId>
    <artifactId>spring-boot-starter-actuator</artifactId>
</dependency>
6.1.1.2 添加配置
management:
  endpoints:
    web:
      exposure:
        include: 'metrics,health' # 暴露指定端点
        # include: '*' # 暴露所有端点
6.1.1.3 访问链接(http://localhost:8080/actuator)
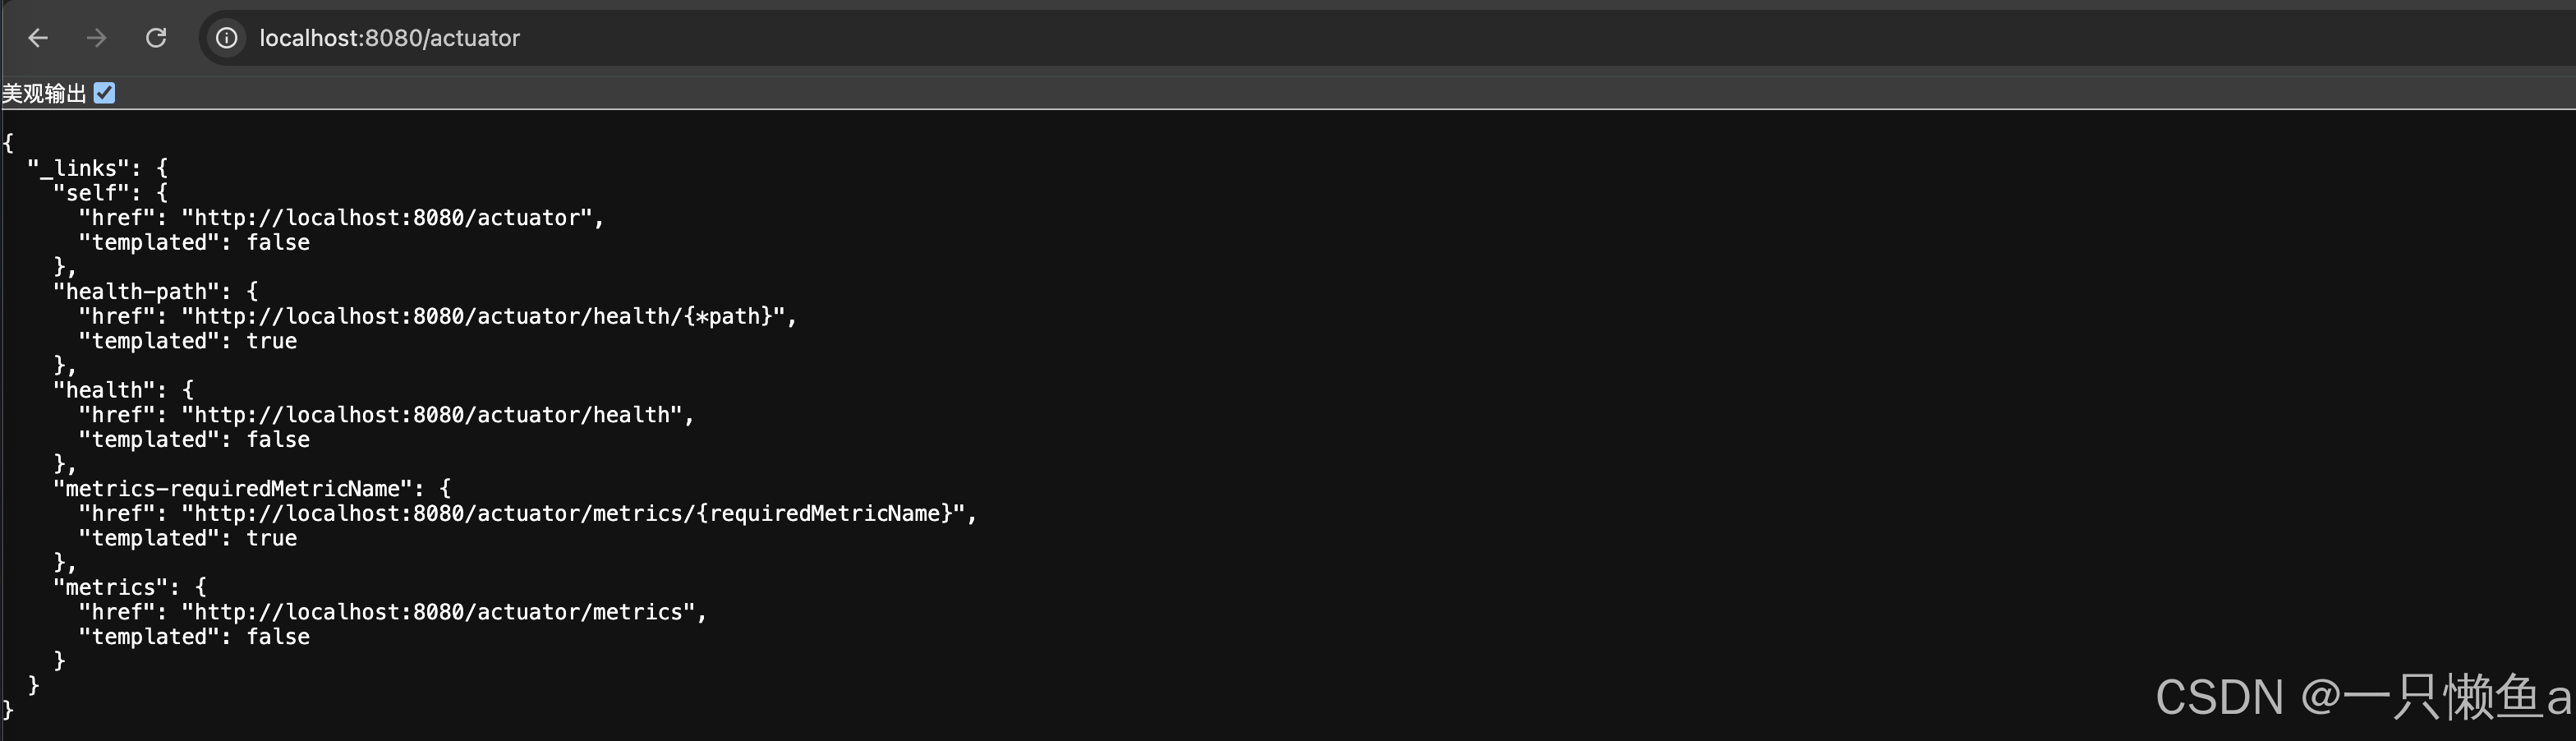
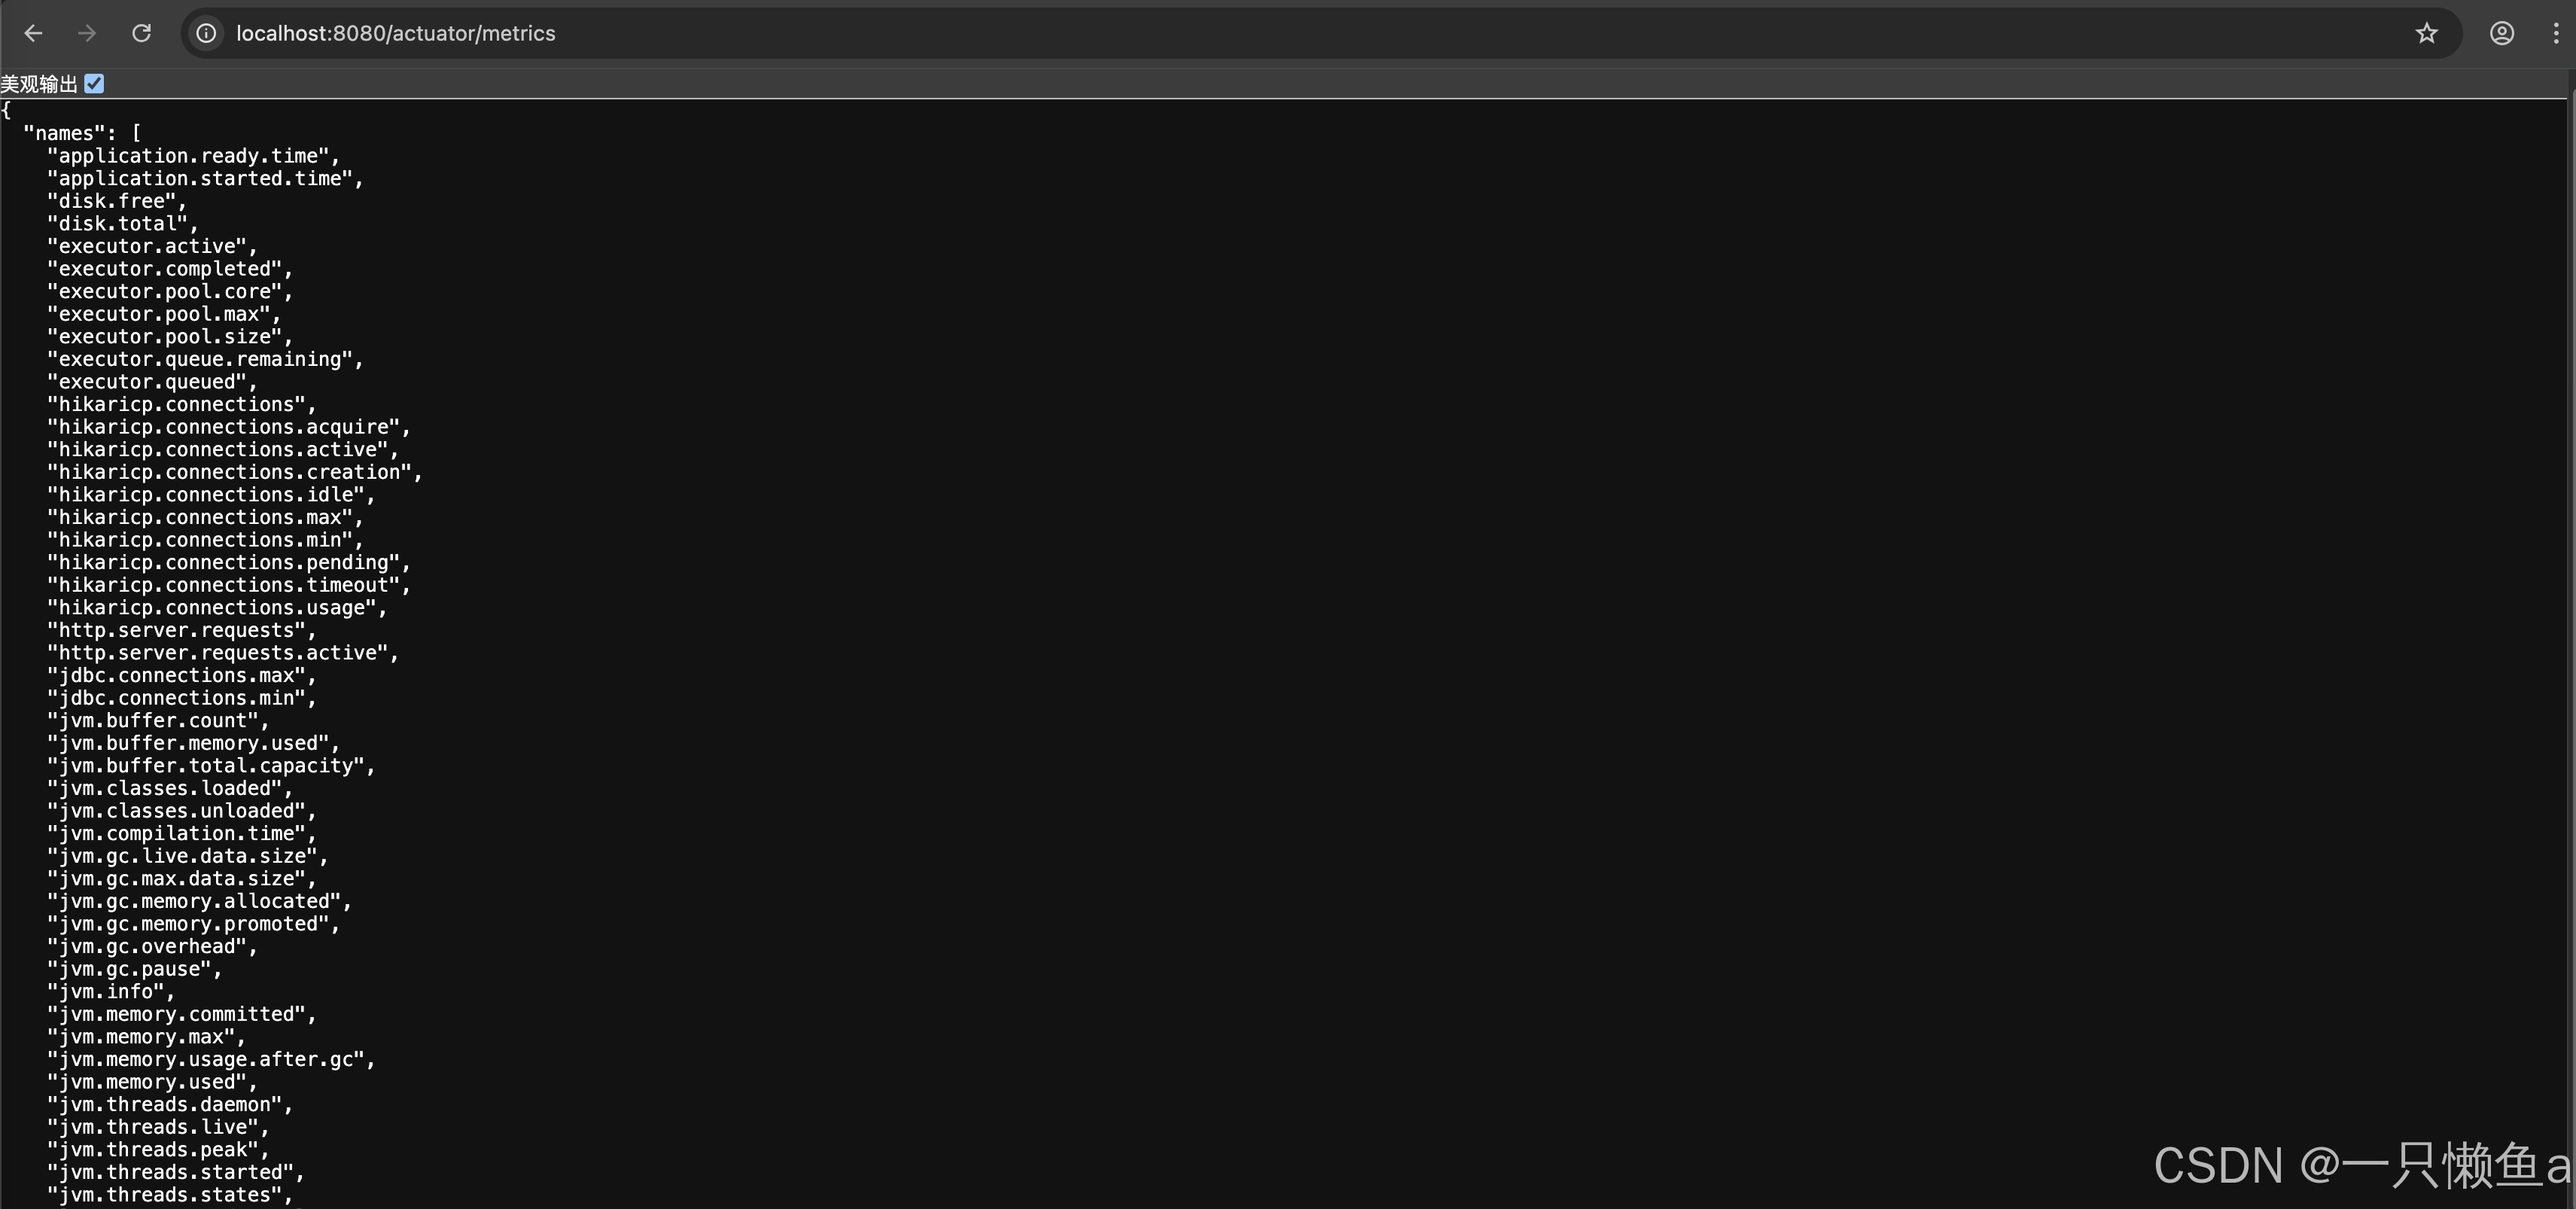
6.1.1.3.1 【metrics】
用于获取应用程序中所有可用的指标 http://localhost:8080/actuator/metrics
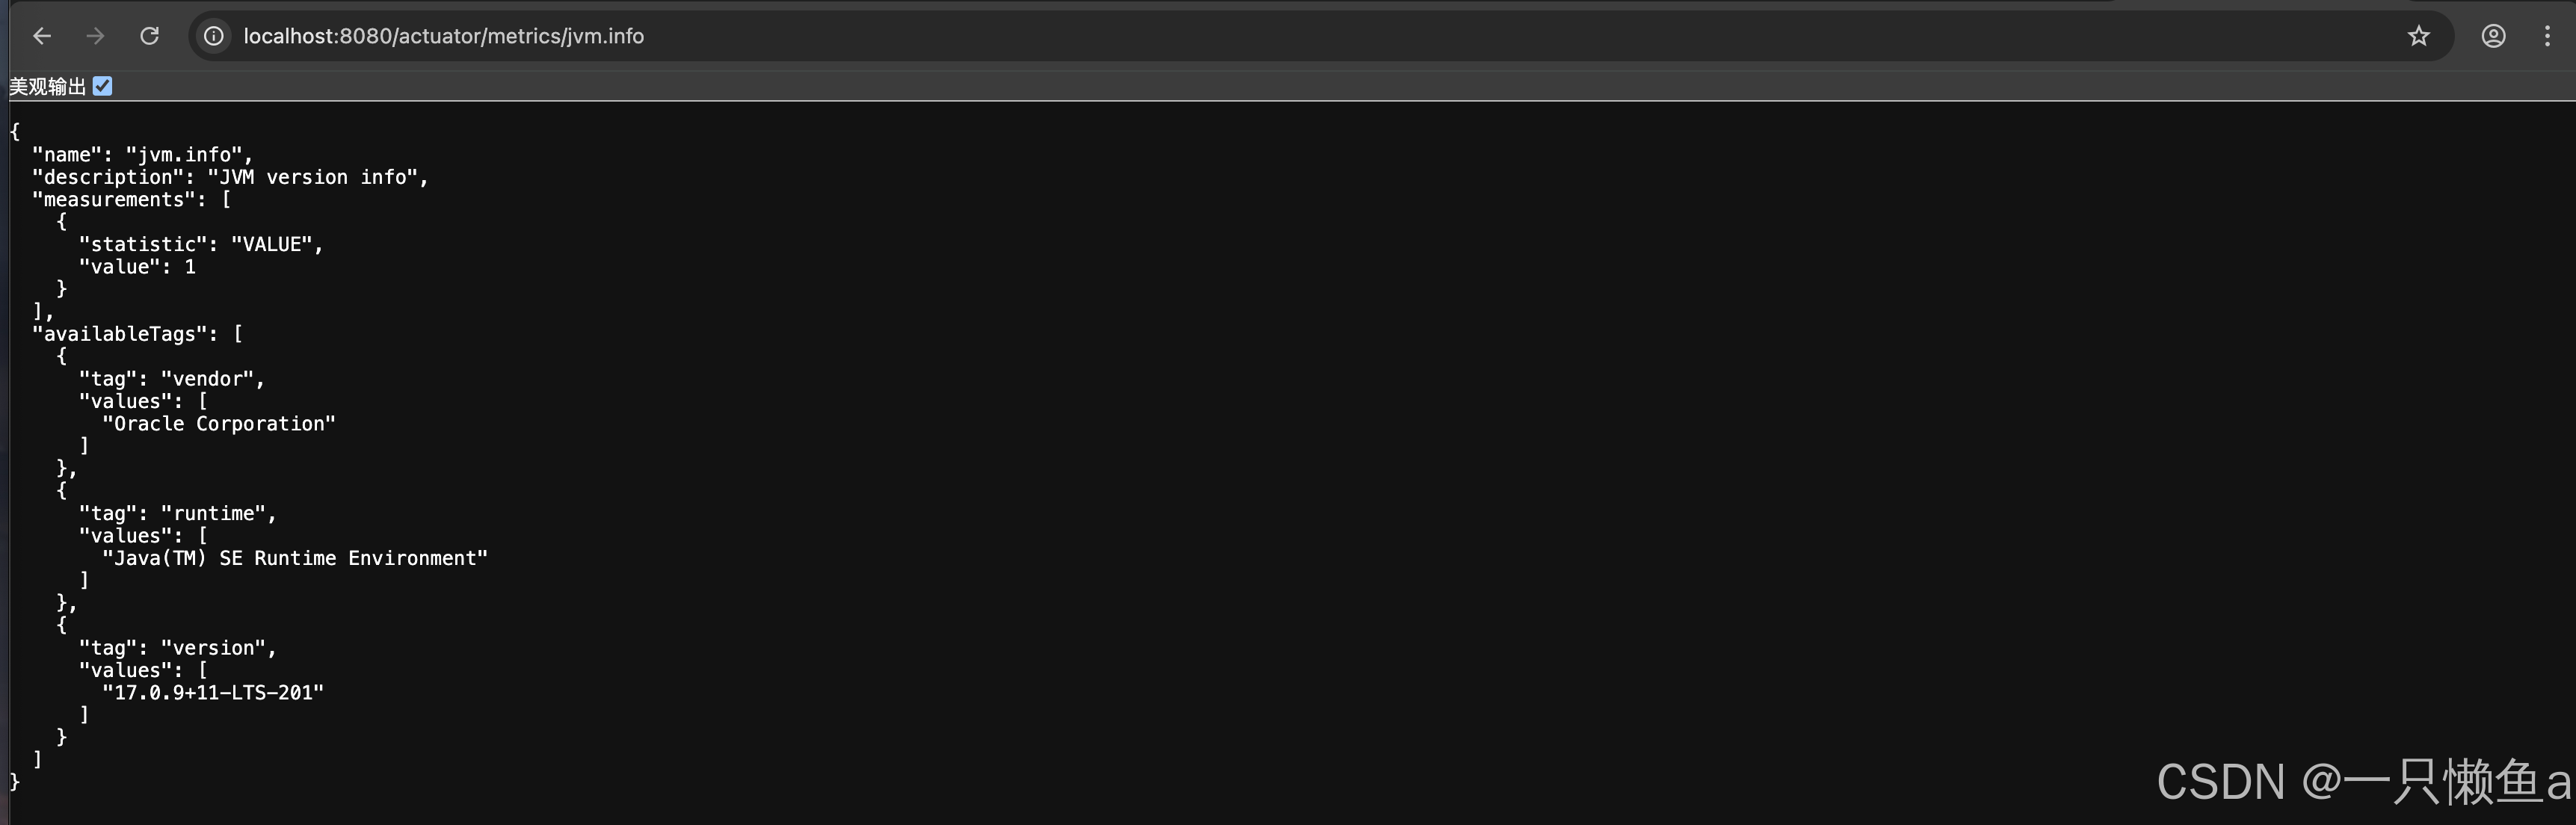
进一步查看某个指标 http://localhost:8080/actuator/metrics/jvm.info
6.1.1.3.2 【health】
- 用于查询应用程序的整体健康状态信息
http://localhost:8080/actuator/health - health 端点中常见的状态值及其含义:
- "UP": 应用程序健康状态良好,所有依赖项都处于可用状态。
- "DOWN": 应用程序健康状态不佳,至少有一个依赖项处于不可用状态。
- "OUT_OF_SERVICE": 应用程序无法提供服务,所有依赖项都处于离线状态。
- "UNKNOWN": 应用程序健康状态未知,无法确定依赖项的状态。
- 健康检查统计明细
- 配置文件增加
management.endpoint.health.show-details=always
- 配置文件增加
6.1.1.4 自定义健康检查
@Component
public class customHealthIndicator extends AbstractHealthIndicator {
    @Override
    protected void doHealthCheck(Health.Builder builder) throws Exception {
        // builder.down().withDetail("自定义中间价","这个自带高可用");
        builder.up().withDetail("自定义中间价", "这个自带高可用");
    }
}6.2 集成Prometheus
6.2.1 添加依赖
<dependency>
    <groupId>io.micrometer</groupId>
    <artifactId>micrometer-registry-prometheus</artifactId>
</dependency>
修改配置文件
management:
endpoints:
web:
exposure:
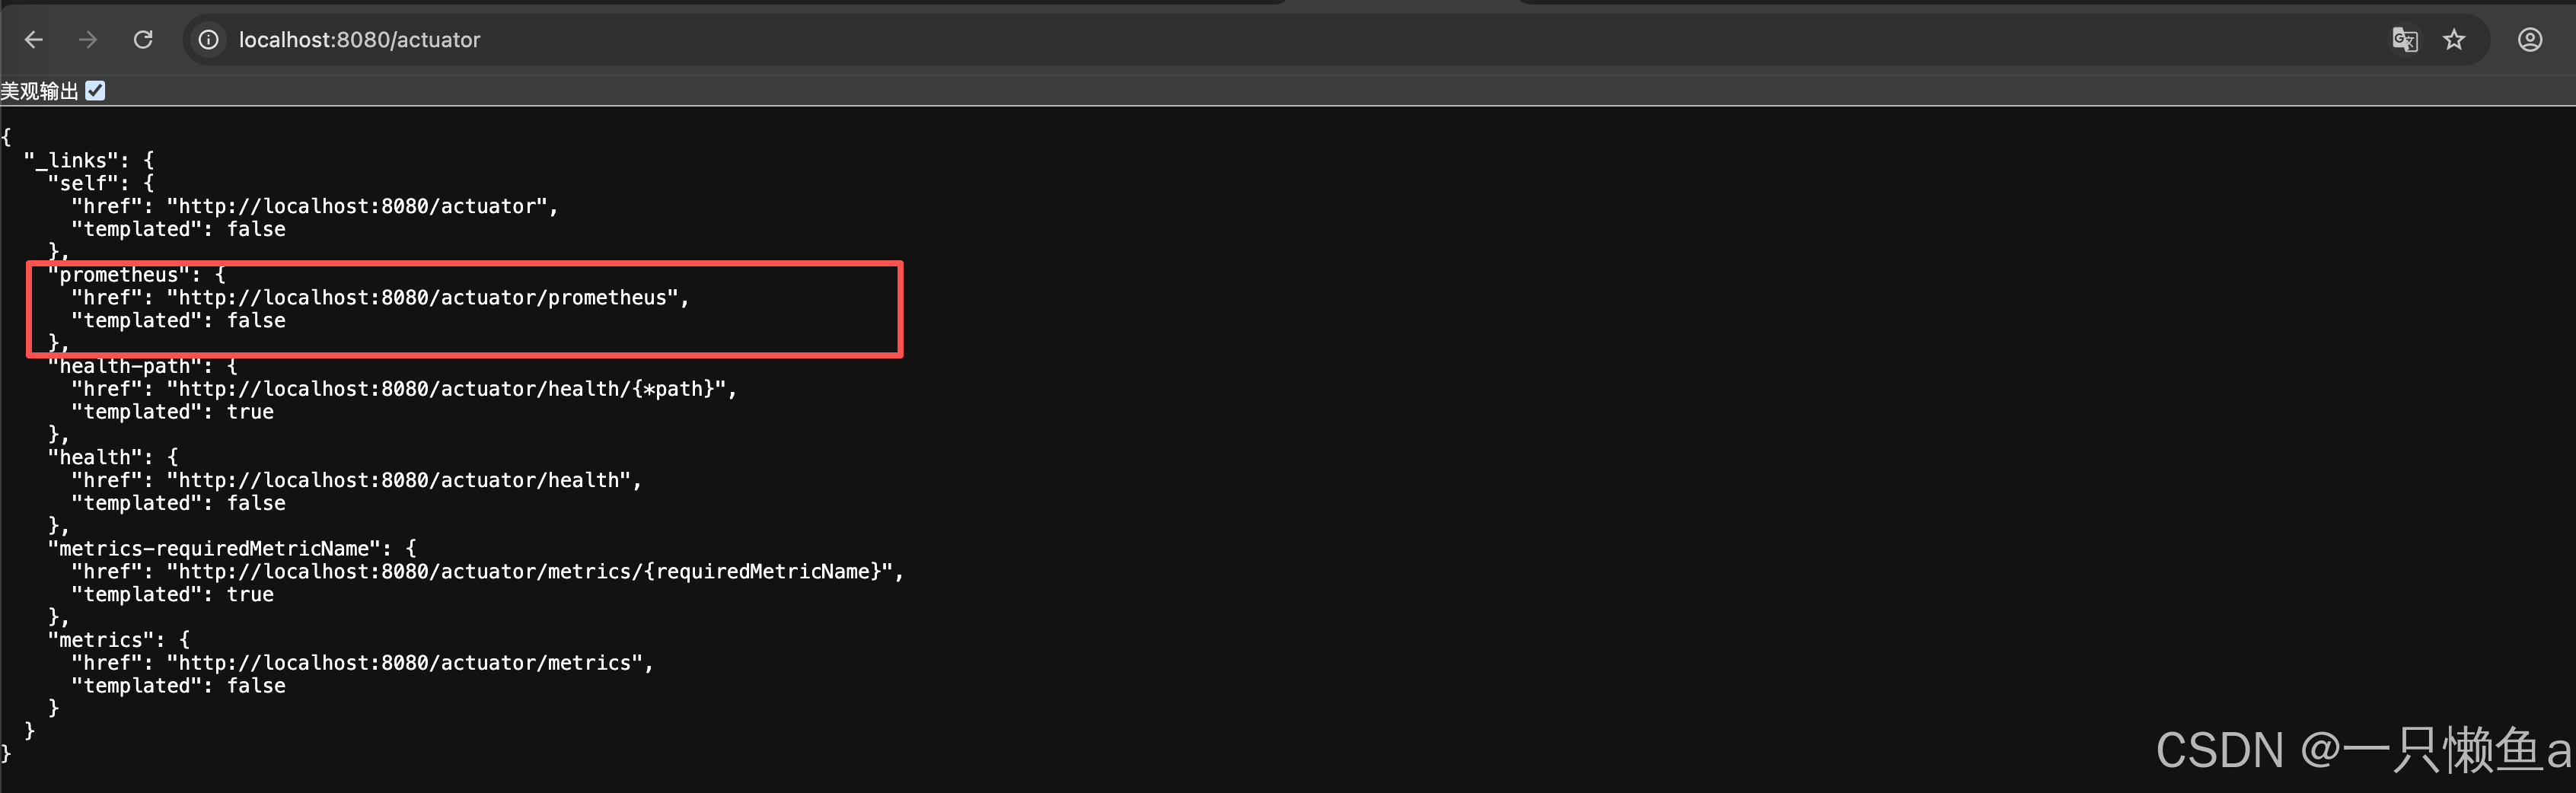
include: 'metrics,health,prometheus' # 暴露指定端点访问 http://localhost:8080/actuator,会新增prometheus端点
验证成功后,打包上传项目至linux服务器
6.2.2 Prometheus配置文件prometheus.yml追加如下内容
- job_name: "springboot"
scrape_interval: 15s
scrape_timeout: 10s
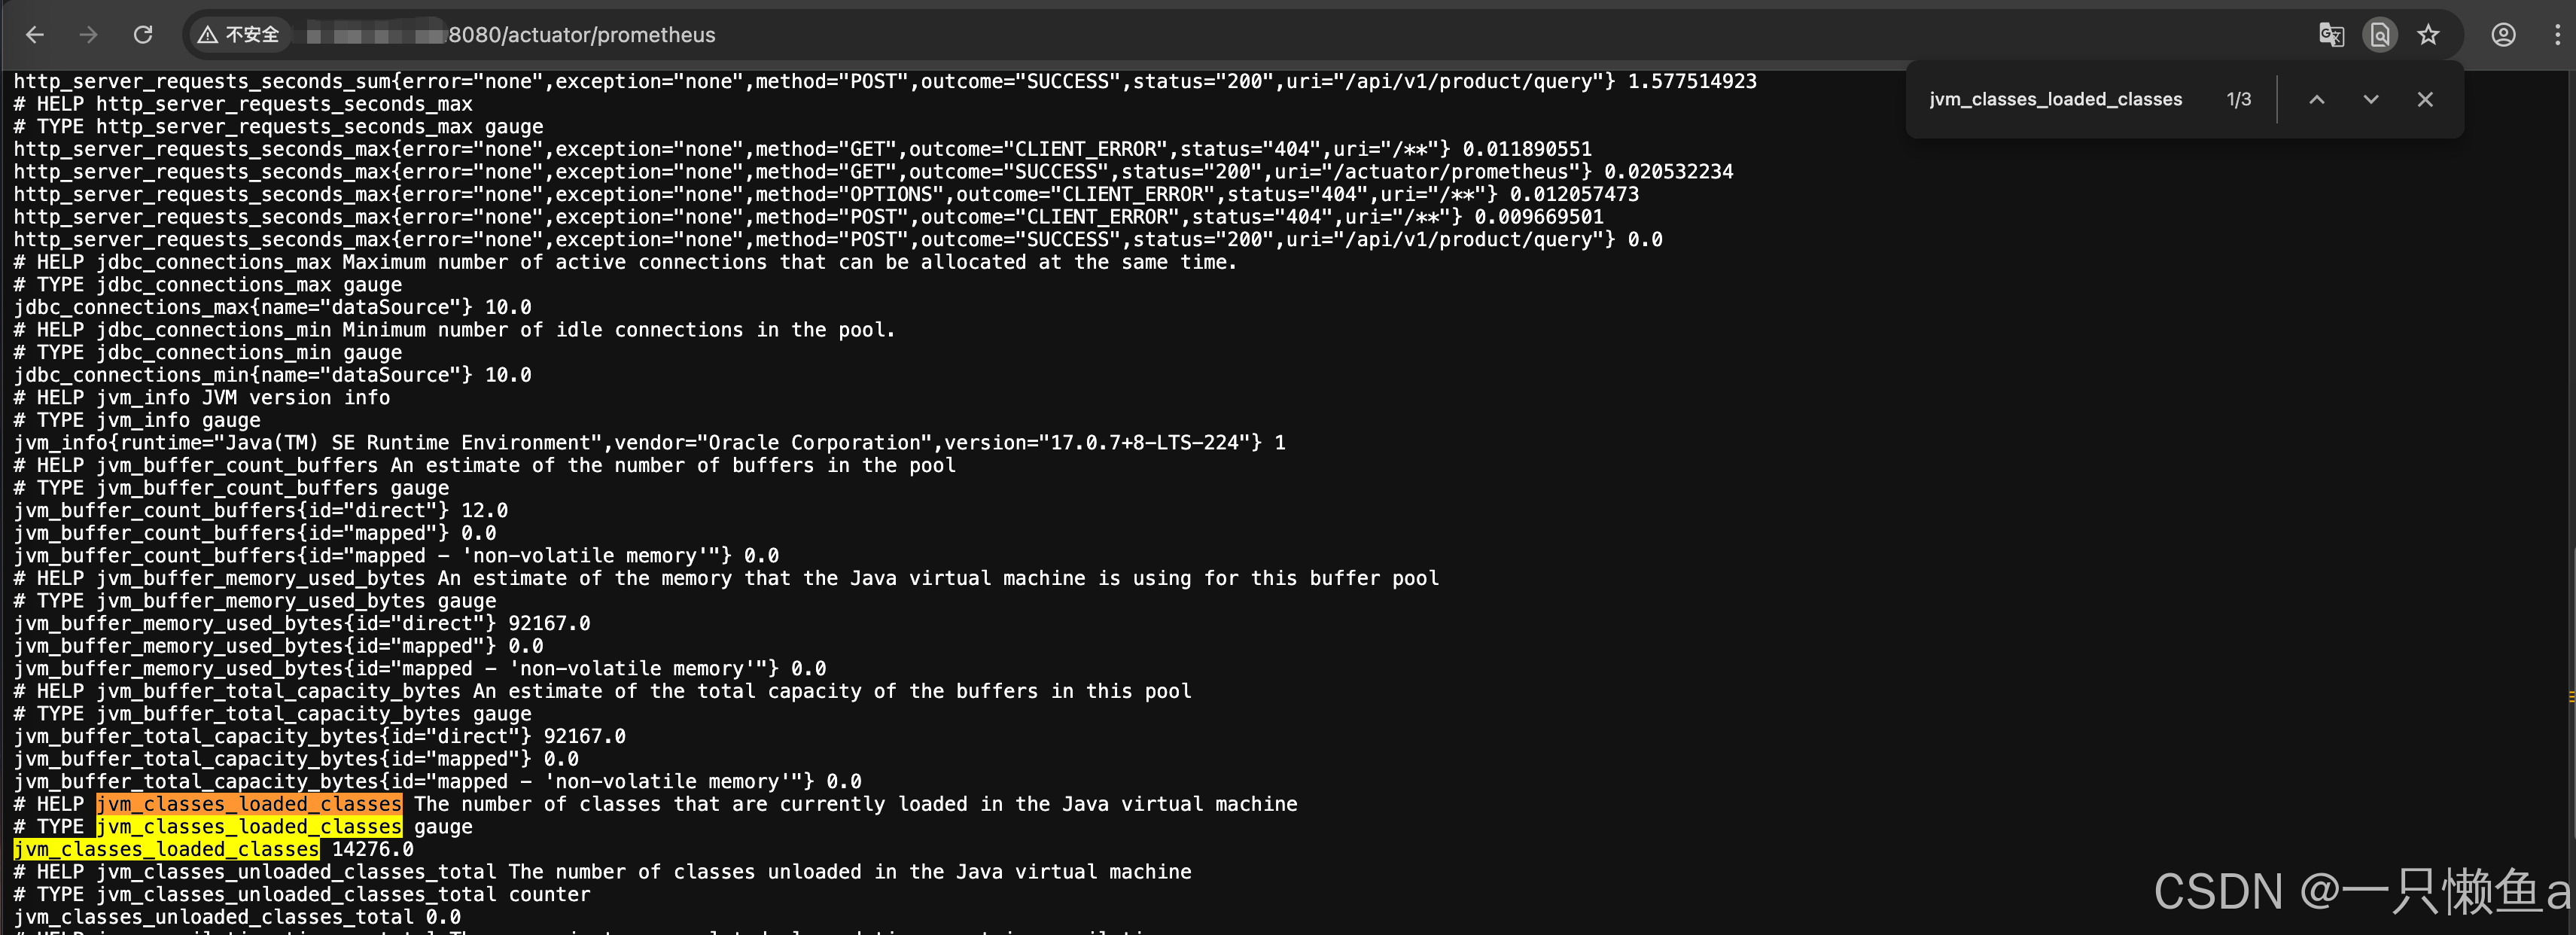
metrics_path: '/actuator/prometheus'
static_configs:
- targets:
- 127.0.0.1:8080重新加载
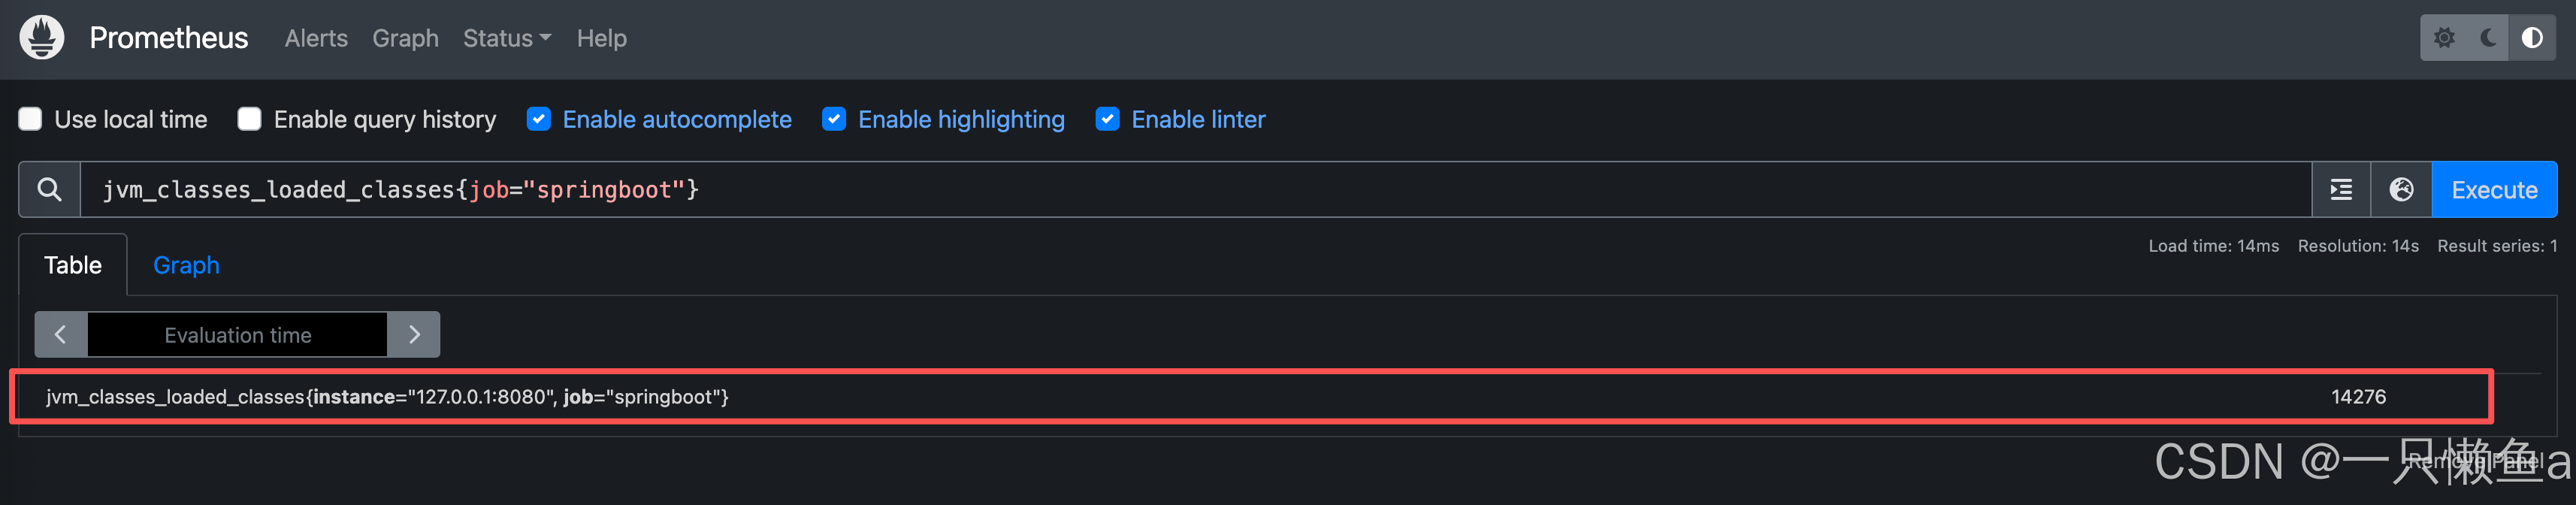
curl -X POST http://localhost:9090/-/reload6.2.3 测试(分别通过路径/actuator/prometheus和prometheus查看)