从 TSDB 原理到实战案例,帮助你理解为什么不能使用高基数标签,以及如何正确设计监控指标。一次性解决 Prometheus 查询慢、内存爆炸的根本问题。
一、先问一个问题:为什么查询会变慢?
想象一个场景:
ini
你的电商系统监控突然变慢了:
- 以前查询 sum(order_total) 只要 10ms
- 现在需要 30 秒,经常超时
- Prometheus 内存从 2GB 涨到 16GB
- 告警延迟,运维半夜被叫醒

罪魁祸首:
order_total{user_id="10086"}  # 给每个用户都创建了独立时序
order_total{user_id="10087"}
...
# 100万用户 = 100万条时序!
核心问题:为什么加个 user_id 标签就炸了?
要理解这个问题,我们先用大白话讲清楚 Prometheus 是怎么存储数据的。
二、大白话类比:超市运作模型
2.1 Prometheus = 一家超市
把 Prometheus TSDB 想象成一家超市,就很好理解了:
graph LR
subgraph Frontend["前台 (内存)"]
CAT["商品目录册
可乐在B2货架"]
SHELF["货架陈列区
热销商品摆前面"]
end
subgraph Backend["后台 (磁盘)"]
WAREHOUSE["大仓库
整箱压缩存放"]
LOG["出入库记录
防止断电丢失"]
end
Frontend -.定期入库.-> Backend
style Frontend fill:#e8f5e9,stroke:#4caf50,stroke-width:3px
style Backend fill:#fff3e0,stroke:#ff9800,stroke-width:3px
style CAT fill:#c8e6c9,stroke:#4caf50
style SHELF fill:#c8e6c9,stroke:#4caf50
style WAREHOUSE fill:#ffe0b2,stroke:#ff9800
style LOG fill:#ffe0b2,stroke:#ff9800
为什么这样设计?
arduino
场景:顾客要买可乐

方案A(全放仓库):
顾客:"要可乐"
店员:"稍等,我去仓库找..." → 10分钟
结果:顾客不买了 ✗

方案B(前台+后台):
顾客:"要可乐"
店员:"货架上有" → 10秒
结果:立刻成交 ✓
对应到监控:
- 告警需要实时查询(<100ms)→ 必须用内存
- 历史分析可以慢点(几秒)→ 磁盘足够
%%{init: {'theme':'base', 'themeVariables': { 'fontSize':'16px'}}}%%
graph TB
subgraph Prometheus["Prometheus Server"]
subgraph Memory["内存层 Head Block (最近2小时热数据)"]
SI["Series 索引表
标签→ID映射"]
PL["Posting Lists
倒排索引"]
AC["Active Chunks
压缩数据块"]
end
Compress["定期压缩 (每2小时)"]
subgraph Disk["磁盘层 Persistent Blocks (长期存储)"]
IDX["index 文件
倒排索引持久化"]
CHK["chunks 文件
XOR 压缩数据"]
META["meta.json
块元数据"]
end
Memory -->|压缩| Compress
Compress -->|持久化| Disk
end
style Memory fill:#e1f5ff,stroke:#0288d1,stroke-width:3px
style Disk fill:#fff3e0,stroke:#f57c00,stroke-width:3px
style Compress fill:#f0f0f0,stroke:#666,stroke-width:2px
style SI fill:#bbdefb,stroke:#0288d1
style PL fill:#bbdefb,stroke:#0288d1
style AC fill:#bbdefb,stroke:#0288d1
style IDX fill:#ffe0b2,stroke:#f57c00
style CHK fill:#ffe0b2,stroke:#f57c00
style META fill:#ffe0b2,stroke:#f57c00
三、揭秘真实架构:TSDB 的技术实现
好,理解了超市模型后,我们来看看 Prometheus 真实的技术架构。有了前面的铺垫,这张图你就能看懂了:
3.1 宏观架构图
Prometheus 采用内存+磁盘 的分层存储,核心设计思想是:热数据快速访问,冷数据压缩存储。
%%{init: {'theme':'base', 'themeVariables': { 'fontSize':'16px'}}}%%
graph TB
subgraph Prometheus["Prometheus Server"]
subgraph Memory["内存层 Head Block (最近2小时热数据)"]
SI["Series 索引表
标签→ID映射"]
PL["Posting Lists
倒排索引"]
AC["Active Chunks
压缩数据块"]
end
Compress["定期压缩 (每2小时)"]
subgraph Disk["磁盘层 Persistent Blocks (长期存储)"]
IDX["index 文件
倒排索引持久化"]
CHK["chunks 文件
XOR 压缩数据"]
META["meta.json
块元数据"]
end
Memory -->|压缩| Compress
Compress -->|持久化| Disk
end
style Memory fill:#e1f5ff,stroke:#0288d1,stroke-width:3px
style Disk fill:#fff3e0,stroke:#f57c00,stroke-width:3px
style Compress fill:#f0f0f0,stroke:#666,stroke-width:2px
style SI fill:#bbdefb,stroke:#0288d1
style PL fill:#bbdefb,stroke:#0288d1
style AC fill:#bbdefb,stroke:#0288d1
style IDX fill:#ffe0b2,stroke:#f57c00
style CHK fill:#ffe0b2,stroke:#f57c00
style META fill:#ffe0b2,stroke:#f57c00
对应到超市:
- Series 索引表 = 商品目录册("可乐在B2货架")
- Posting Lists = 分类标签墙("饮料类:可乐、雪碧...")
- Active Chunks = 前台货架(最近进货的商品)
- index/chunks 文件 = 后台大仓库(整箱压缩存放)
3.2 关键数据:什么放内存,什么放磁盘?
| 数据类型 | 存储位置 | 大小估算 | 高基数影响 |
|---|---|---|---|
| Series 索引 | 内存 | 每时序 2-4 KB | 直接膨胀 |
| 倒排索引 | 内存 | 随标签值增长 | 急剧增长 |
| 最新数据(2小时内) | 内存 | 每时序 ~1 KB | 线性增长 |
| 历史数据 | 磁盘 | 压缩后 1:10 | 碎片化 |
| WAL日志 | 磁盘 | 未压缩 | 写入放大 |
核心公式:
yaml
内存占用 ≈ 时序总数 × 3 KB
推荐上限:单实例 < 1000 万时序
现在再看开头的问题:
ini
order_total{user_id="10086"}  # 100万用户 = 100万个 Series
↓
Series 索引表:100万 × 3KB = 3GB(仅索引就爆了!)
查询时要遍历 100万个货架位 → 30秒超时
3.4 内存结构详解
Series 索引表 = 商品总目录
graph TB
subgraph Normal["正常商品目录"]
N1["可乐(瓶装) → B2货架
对应: (method='GET') → ID:1"]
N2["可乐(罐装) → B3货架
对应: (method='POST') → ID:2"]
end
subgraph HighCard["❌ 高基数问题"]
H1["张三的可乐 → A1货架
对应: (user_id='10086') → ID:1"]
H2["李四的可乐 → A2货架
对应: (user_id='10087') → ID:2"]
H3["王五的可乐 → A3货架
对应: (user_id='10088') → ID:3"]
H4["... 100万个顾客"]
end
style Normal fill:#c8e6c9,stroke:#4caf50,stroke-width:3px
style HighCard fill:#ffcdd2,stroke:#f44336,stroke-width:3px
style N1 fill:#a5d6a7,stroke:#2e7d32
style N2 fill:#a5d6a7,stroke:#2e7d32
style H1 fill:#ef9a9a,stroke:#c62828
style H2 fill:#ef9a9a,stroke:#c62828
style H3 fill:#ef9a9a,stroke:#c62828
style H4 fill:#ef9a9a,stroke:#c62828
Posting Lists = 分类标签墙
graph LR
subgraph Drink["饮料类"]
D1[可乐]
D2[雪碧]
D3[牛奶]
end
subgraph Snack["零食类"]
S1[薯片]
S2[饼干]
S3[巧克力]
end
subgraph HighCard["❌ 高基数: 用户标签"]
U1["user_id=10086
SeriesID:100001"]
U2["user_id=10087
SeriesID:100002"]
U3["user_id=10088
SeriesID:100003"]
U4["... 100万个标签"]
end
style Drink fill:#e1f5ff,stroke:#0288d1,stroke-width:2px
style Snack fill:#f3e5f5,stroke:#9c27b0,stroke-width:2px
style HighCard fill:#ffcdd2,stroke:#f44336,stroke-width:3px
style D1 fill:#bbdefb,stroke:#0288d1
style D2 fill:#bbdefb,stroke:#0288d1
style D3 fill:#bbdefb,stroke:#0288d1
style S1 fill:#e1bee7,stroke:#9c27b0
style S2 fill:#e1bee7,stroke:#9c27b0
style S3 fill:#e1bee7,stroke:#9c27b0
style U1 fill:#ef9a9a,stroke:#c62828
style U2 fill:#ef9a9a,stroke:#c62828
style U3 fill:#ef9a9a,stroke:#c62828
style U4 fill:#ef9a9a,stroke:#c62828
四、电商场景:好与坏的指标设计
4.1 订单监控
反面案例:每个用户、每个订单都是独立时序
prometheus
# 错误设计
order_created{
  user_id="10086",           # 100万个用户
  order_id="20240501001",    # 每天50万订单
  product_id="SKU12345"      # 10万个商品
}

问题分析:
├─ 时序数量:100万用户 × 1个指标 = 100万时序
├─ 内存占用:100万 × 3KB = 3GB(仅索引)
├─ 查询延迟:sum(order_created) → 30秒超时
└─ 存储浪费:大部分订单只有1个样本点
graph TB
subgraph Bad["❌ 错误设计: 高基数"]
B1["user_id='10086'
100万个用户"]
B2["order_id='ABC123'
每天50万订单"]
B3["product_id='SKU001'
10万个商品"]
Result1["时序数: 100万+
内存: 3GB
查询: 30秒超时"]
end
B1 & B2 & B3 --> Result1
style Bad fill:#ffcdd2,stroke:#f44336,stroke-width:3px
style B1 fill:#ef9a9a,stroke:#c62828
style B2 fill:#ef9a9a,stroke:#c62828
style B3 fill:#ef9a9a,stroke:#c62828
style Result1 fill:#ffebee,stroke:#c62828,stroke-width:2px
为什么错?
graph LR
Problem[超市类比] --> P1["每个顾客的
每件商品都单独上架"]
P1 --> P2["张三的可乐
李四的可乐
王五的可乐..."]
P2 --> P3["商品目录1000页
货架爆满"]
style Problem fill:#fff3e0,stroke:#f57c00,stroke-width:2px
style P1 fill:#ffccbc,stroke:#ff5722
style P2 fill:#ffccbc,stroke:#ff5722
style P3 fill:#ffcdd2,stroke:#f44336,stroke-width:3px
正面案例:聚合维度
prometheus
# 正确设计
order_created_total{
  source="app|web|miniprogram",      # 3个值
  payment_method="alipay|wechat",    # 5个值
  product_category="electronics"     # 20个一级类目
}

优势:
├─ 时序数量:3 × 5 × 20 = 300时序
├─ 内存占用:300 × 3KB = 900KB
├─ 查询延迟:sum(order_created_total) → 10ms
└─ 存储效率:样本点密集,压缩率高
graph TB
subgraph Good["✓ 正确设计: 低基数"]
G1["source
3个值"]
G2["payment_method
5个值"]
G3["product_category
20个类目"]
Result2["时序数: 300
内存: 900KB
查询: 10ms"]
end
G1 & G2 & G3 --> Result2
style Good fill:#c8e6c9,stroke:#4caf50,stroke-width:3px
style G1 fill:#a5d6a7,stroke:#2e7d32
style G2 fill:#a5d6a7,stroke:#2e7d32
style G3 fill:#a5d6a7,stroke:#2e7d32
style Result2 fill:#e8f5e9,stroke:#2e7d32,stroke-width:2px
为什么对?
graph LR
Solution[超市类比] --> S1[按商品类型分类]
S1 --> S2["瓶装可乐
罐装可乐
..."]
S2 --> S3["商品目录1页
清晰明了"]
style Solution fill:#e8f5e9,stroke:#4caf50,stroke-width:2px
style S1 fill:#c8e6c9,stroke:#66bb6a
style S2 fill:#c8e6c9,stroke:#66bb6a
style S3 fill:#a5d6a7,stroke:#2e7d32,stroke-width:3px
4.2 接口性能监控
反面案例:动态URL路径
prometheus
# 错误设计
api_request_duration{
  path="/api/order/10086/detail",    # 每个订单号一个路径
  path="/api/order/10087/detail",
  path="/api/user/20001/profile",    # 每个用户ID一个路径
  ...
}

问题:
├─ URL数量:每天几十万个不同路径
├─ 时序爆炸:每个路径一条时序
└─ 无法聚合:sum() 毫无意义
graph TD
URL1["api/order/10086/detail"] --> TS1["时序1"]
URL2["api/order/10087/detail"] --> TS2["时序2"]
URL3["api/order/10088/detail"] --> TS3["时序3"]
URL4["... 每天50万个URL"] --> TS4["... 50万时序"]
TS1 & TS2 & TS3 & TS4 --> Problem["❌ 无法聚合
查询超时"]
style URL1 fill:#ffccbc,stroke:#ff5722
style URL2 fill:#ffccbc,stroke:#ff5722
style URL3 fill:#ffccbc,stroke:#ff5722
style URL4 fill:#ffccbc,stroke:#ff5722
style TS1 fill:#ef9a9a,stroke:#c62828
style TS2 fill:#ef9a9a,stroke:#c62828
style TS3 fill:#ef9a9a,stroke:#c62828
style TS4 fill:#ef9a9a,stroke:#c62828
style Problem fill:#ffcdd2,stroke:#f44336,stroke-width:3px
正面案例:路径归一化
prometheus
# 正确设计
api_request_duration{
  path="/api/order/{id}/detail",     # 模板化
  method="GET",
  status="200|500"
}

实现方式:
在应用代码或网关层做路径归一化:
/api/order/10086/detail  → /api/order/{id}/detail
/api/user/20001/profile  → /api/user/{id}/profile
graph TD
URL1["api/order/10086/detail"] --> Normalize
URL2["api/order/10087/detail"] --> Normalize
URL3["api/order/10088/detail"] --> Normalize
Normalize["路径归一化"] --> Template["api/order/{id}/detail"]
Template --> TS["✓ 1个聚合时序
查询快速"]
style URL1 fill:#bbdefb,stroke:#0288d1
style URL2 fill:#bbdefb,stroke:#0288d1
style URL3 fill:#bbdefb,stroke:#0288d1
style Normalize fill:#fff9c4,stroke:#fbc02d,stroke-width:2px
style Template fill:#c8e6c9,stroke:#4caf50,stroke-width:2px
style TS fill:#a5d6a7,stroke:#2e7d32,stroke-width:3px
4.3 库存监控
反面案例:商品级别监控
prometheus
# 错误设计
inventory_level{
  product_id="SKU001",      # 10万个SKU
  warehouse_id="WH001",     # 100个仓库
  location="A-01-05"        # 1万个货位
}

时序数:10万 × 100 × 1万 = 1000亿(理论值)
实际:即使只有部分组合,也有百万级时序
正面案例:分层监控
prometheus
# 宏观监控(低基数)
inventory_health{
  category="electronics",       # 20个类目
  warehouse_region="south",     # 5个大区
  stock_status="low|normal|high" # 3个状态
}

# 详细监控(仅Top商品)
inventory_detail{
  product_id="SKU001",          # 仅监控Top 1000商品
  warehouse_id="WH001"
}
4.4 对比总结
| 维度 | 反面案例 | 正面案例 | 差距 |
|---|---|---|---|
| 时序数量 | 100万+ | 300-1000 | 1000倍 |
| 内存占用 | 3GB+ | <5MB | 600倍 |
| 查询延迟 | 30秒+ | 10-50ms | 3000倍 |
| 告警响应 | 经常超时 | 实时 | - |
五、告警场景的共性抽取
5.1 告警的本质需求
Prometheus 作为告警系统,核心需求是:
快速回答:系统出了什么问题?
而不是:谁在什么时候做了什么?
实际案例:
java
告警需求                        需要的维度              不需要的维度
─────────────────────────────────────────────────────────
订单支付失败率超5%              payment_method          user_id, order_id
                               error_type

API延迟P99超1秒                 service_name            request_id
                               endpoint (归一化)        user_id

库存水位低于阈值                category                product_id
                               warehouse_region        具体货位
5.2 告警指标的设计规律
规律1:聚合维度,而非明细维度
ini
思考:你需要知道"哪些订单失败了",还是"为什么失败"?

错误:
alert: order_failed{order_id="xxx"} > 0
→ 每个订单都告警,无法处理

正确:
alert: rate(order_failed_total{reason="timeout"}[5m]) > 0.05
→ 超时导致的失败率超5%,立刻修复
规律2:技术维度比业务明细重要
必选维度(技术运维):
ini
service="order-service"     # 哪个服务
instance="10.0.1.5:9090"   # 哪台机器
environment="production"    # 哪个环境
可选维度(业务聚合):
ini
payment_method="alipay"    # 支付方式
category="electronics"     # 商品类目
region="华南"              # 地域
禁用维度(业务明细):
bash
user_id                    # 用户ID → 放日志
order_id                   # 订单号 → 放日志
product_id                 # 商品ID → 放日志(除非Top商品)
规律3:状态聚合,而非状态穷举
ini
反面:
order_status="created|paid|shipped|delivered|cancelled|refunded|..."
→ 10+ 种状态,组合爆炸

正面:
order_status="success|failed"
order_stage="processing|completed"
→ 2-3 种状态,清晰明了
5.3 典型告警规则模板
yaml
# 订单成功率告警
- alert: OrderSuccessRateLow
  expr: |
    rate(order_success_total{env="prod"}[5m])
    /
    rate(order_total{env="prod"}[5m]) < 0.95
  labels:
    severity: critical
  annotations:
    summary: "订单成功率低于95%"

# API延迟告警
- alert: APILatencyHigh
  expr: |
    histogram_quantile(0.99,
      rate(api_duration_bucket{service="order"}[5m])
    ) > 1
  labels:
    severity: warning
  annotations:
    summary: "API P99延迟超过1秒"

# 库存水位告警
- alert: InventoryLow
  expr: |
    inventory_level{status="low"} > 100
  labels:
    severity: warning
  annotations:
    summary: "{{$labels.category}} 类目库存不足"
5.4 告警维度设计清单
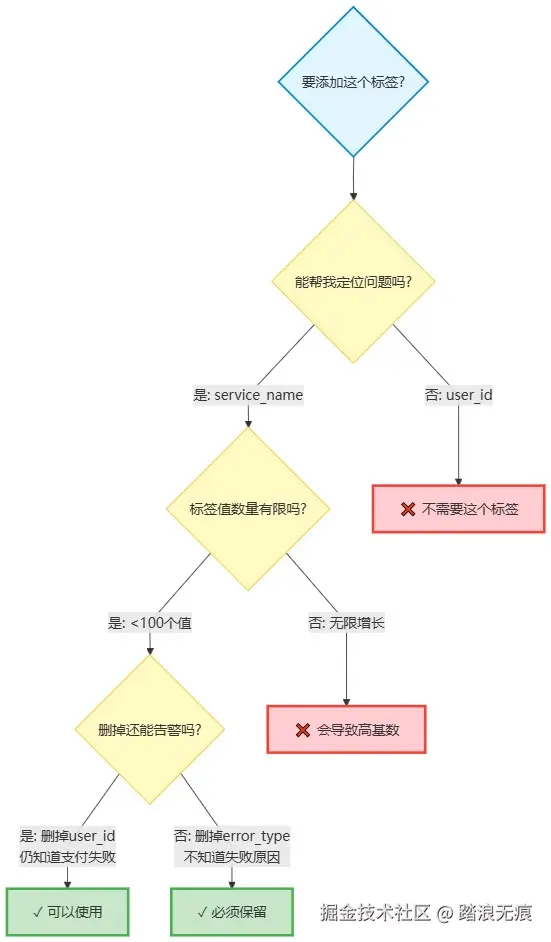
具体示例:
graph LR
subgraph Good["✓ 推荐使用"]
G1["service_name
知道哪个服务"]
G2["error_type
知道失败原因"]
G3["payment_method
5-10种"]
end
subgraph Bad["❌ 不要使用"]
B1["user_id
不关心是谁"]
B2["request_id
无限增长"]
B3["order_id
放日志即可"]
end
style Good fill:#c8e6c9,stroke:#4caf50,stroke-width:3px
style Bad fill:#ffcdd2,stroke:#f44336,stroke-width:3px
style G1 fill:#a5d6a7,stroke:#2e7d32
style G2 fill:#a5d6a7,stroke:#2e7d32
style G3 fill:#a5d6a7,stroke:#2e7d32
style B1 fill:#ef9a9a,stroke:#c62828
style B2 fill:#ef9a9a,stroke:#c62828
style B3 fill:#ef9a9a,stroke:#c62828
六、操作指引与总结
6.1 标签设计黄金法则
graph TB
subgraph Rule1["原则1: 基数控制"]
R1A["单个标签 < 100个值"]
R1B["标签组合 < 10,000时序"]
end
subgraph Rule2["原则2: 三不原则"]
R2A["❌ 不用唯一标识
user_id, order_id"]
R2B["❌ 不用动态值
完整URL, 堆栈"]
R2C["❌ 不过度细化
省市区 → 大区"]
end
subgraph Rule3["原则3: 分层存储"]
R3A["聚合指标 → Prometheus
用于告警"]
R3B["明细数据 → ELK/ClickHouse
用于分析"]
R3C["链路追踪 → Jaeger
用于调试"]
end
Rule1 --> Rule2
Rule2 --> Rule3
style Rule1 fill:#e1f5ff,stroke:#0288d1,stroke-width:3px
style Rule2 fill:#fff3e0,stroke:#f57c00,stroke-width:3px
style Rule3 fill:#f3e5f5,stroke:#9c27b0,stroke-width:3px
style R1A fill:#bbdefb,stroke:#0288d1
style R1B fill:#bbdefb,stroke:#0288d1
style R2A fill:#ffe0b2,stroke:#f57c00
style R2B fill:#ffe0b2,stroke:#f57c00
style R2C fill:#ffe0b2,stroke:#f57c00
style R3A fill:#e1bee7,stroke:#9c27b0
style R3B fill:#e1bee7,stroke:#9c27b0
style R3C fill:#e1bee7,stroke:#9c27b0
6.2 快速诊断清单
发现查询变慢或内存飙升?按以下步骤检查:
flowchart TD
Start([发现性能问题]) --> Step1
Step1["Step 1: 查看 TSDB Status
访问 /tsdb-status"] --> Check1{时序总数 > 500万?}
Check1 -->|是| Step2A["找出高基数指标
Top 10 series count"]
Check1 -->|否| Step2B[检查查询复杂度]
Step2A --> Step3["Step 2: 执行基数分析
topk查询"]
Step3 --> Analyze{哪类标签值最多?}
Analyze -->|user_id等唯一ID| Fix1["移除标签
改为日志记录"]
Analyze -->|URL动态路径| Fix2["路径归一化
使用模板"]
Analyze -->|省市区等细化| Fix3["聚合为大区
降低维度"]
Fix1 & Fix2 & Fix3 --> Step4["Step 3: 应用修复
使用 relabel_configs"]
Step4 --> Verify["验证效果
监控时序数变化"]
style Start fill:#e1f5ff,stroke:#0288d1,stroke-width:2px
style Step1 fill:#fff9c4,stroke:#fbc02d
style Check1 fill:#fff3e0,stroke:#f57c00,stroke-width:2px
style Analyze fill:#fff3e0,stroke:#f57c00,stroke-width:2px
style Fix1 fill:#c8e6c9,stroke:#4caf50,stroke-width:2px
style Fix2 fill:#c8e6c9,stroke:#4caf50,stroke-width:2px
style Fix3 fill:#c8e6c9,stroke:#4caf50,stroke-width:2px
style Step4 fill:#bbdefb,stroke:#0288d1
style Verify fill:#a5d6a7,stroke:#2e7d32,stroke-width:3px
Step 1: 查看 TSDB Status
bash
# 访问 Prometheus UI
http://localhost:9090/tsdb-status

重点关注:
• Head Cardinality Stats
• Top 10 label names with value count
• Top 10 series count by metric names

找出:哪个标签有10万+个值?哪个指标有10万+时序?
Step 2: 执行基数分析查询
promql
# 查看时序总数
count({__name__=~".+"})

# 找出高基数指标(Top 10)
topk(10, count by (__name__)({__name__=~".+"}))

# 找出高基数标签
# 在 TSDB Status 页面查看 "label names with value count"
Step 3: 对症下药
bash
问题类型                    解决方案
─────────────────────────────────────────
user_id 等唯一ID            移除标签,改为日志记录

URL 动态路径                路径归一化:
                           /api/order/123 → /api/order/{id}

过度细化(省市区)          聚合为大区

历史遗留高基数指标          使用 relabel_configs 丢弃
6.3 Relabel 配置示例
yaml
# prometheus.yml
scrape_configs:
  - job_name: 'order-service'
    relabel_configs:
      # 丢弃高基数标签
      - action: labeldrop
        regex: 'user_id|order_id|request_id'

      # URL 路径归一化
      - source_labels: [__path__]
        target_label: path
        regex: '/api/order/[0-9]+/(.*)'
        replacement: '/api/order/{id}/$1'
6.4 核心要点回顾
存储分层原则:
- 索引和最新数据存储在内存,保证查询速度
- 历史数据存储在磁盘,通过压缩节省空间
- 热数据(2小时内)用于实时告警,冷数据用于历史分析
标签设计原则:
- 标签应该是可聚合的维度,而非唯一标识
- 用户ID、订单号等明细信息应该放在日志系统
- 控制标签基数是保证查询性能的关键
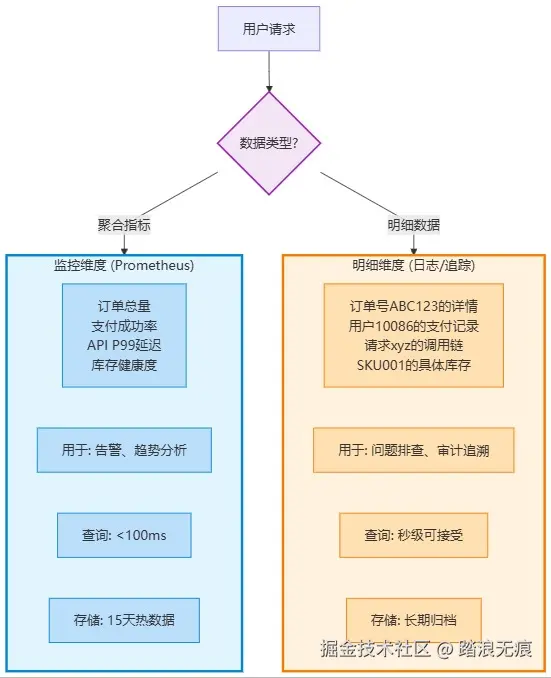
监控与追踪的分工:
- 监控系统关注整体趋势和异常模式,用于告警
- 追踪系统关注个体行为和详细路径,用于排查
- Prometheus 负责"发生了什么",日志/追踪负责"谁做了什么"
6.5 总结
Prometheus 的设计哲学:
监控系统应该回答"发生了什么"(What happened), 而不是"谁做了什么"(Who did what)。
两个维度的数据分离:
最后的建议:
- 新指标上线前 :先评估基数,计算
时序数 = 各标签基数的乘积 - 定期巡检:每周查看 TSDB Status,关注时序增长趋势
- 告警优先:记住 Prometheus 主要用于告警,不是万能分析工具
- 工具组合:Prometheus + ELK + Jaeger 才是完整的可观测性方案
参考资源:
- Prometheus 官方文档:prometheus.io/docs/
- TSDB 设计论文:fabxc.org/tsdb/
- 基数分析工具:promtool tsdb analyze