Prometheus+Grafana构建云原生分布式监控系统(二)![]() https://blog.csdn.net/xiaochenXIHUA/article/details/157094525
https://blog.csdn.net/xiaochenXIHUA/article/details/157094525
一、Prometheus监控Linux主机状态
1.1、Exporter简介与来源
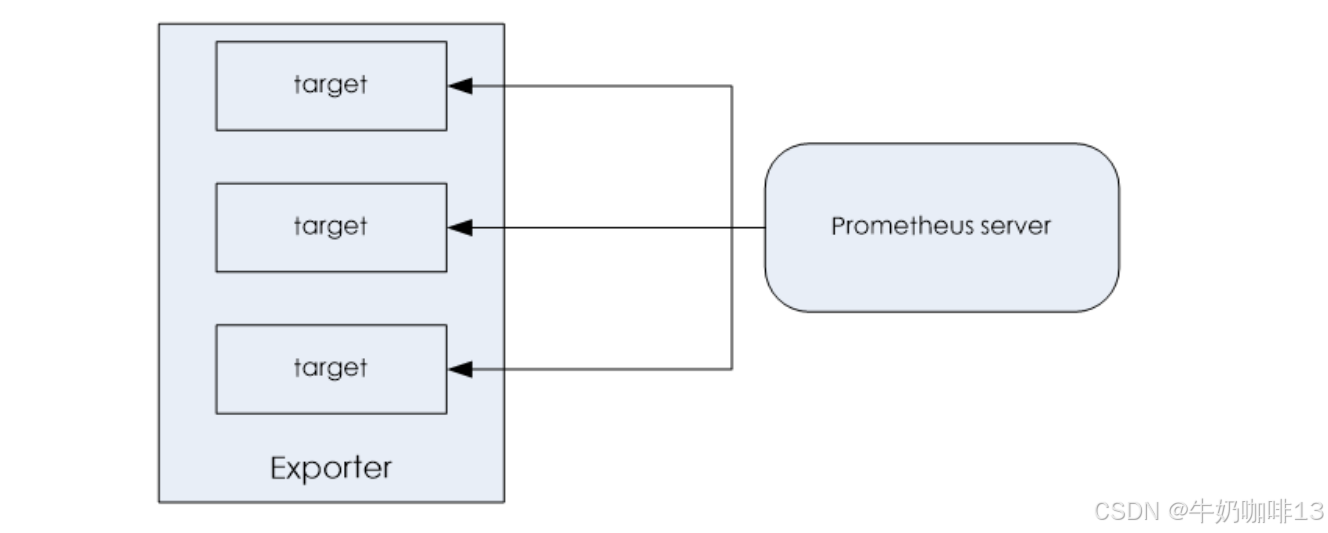
**所有可以向Prometheus提供监控样本数据的程序都可以被称为一个Exporter;而Exporter的一个实例称为target。**如下图所示,Prometheus通过轮询的方式定期从这些target中获取样本数据:
|--------|----------------------|--------------------------------------------------------|
| 序号 | 社区提供的Exporter分类 | 示例说明 |
| prometheus社区提供了丰富的Exporter的实现,涵盖了从基础设施,中间件及其网络等各个方面的监控功能。这些Exporter可以实现大部分通用的监控需求,如下是社区中一些常用的Exporter: |||
| 1 | 硬件 | Node Exporter、IPMI Exporter、IOT Edison Exporter |
| 2 | 存储 | HDFS Exporter、Ceph Exporter |
| 3 | HTTP服务 | HAProxy Exporter、Nginx Exporter、Apache Exporter |
| 4 | 日志 | Fluentd Exporter、Grok Exporter |
| 5 | 监控系统 | Nagios Exporter、SNMP Exporter、Graphite Exporter |
| 6 | 消息队列 | Kafka Exporter、NSQ Exporter、RabbitMQ Exporter |
| 7 | API服务 | GitHub Exporter、Docker Cloud Exporter、AWS ECS Exporter |
| |||
| 序号 | 用户自定义的Exporter分类 | 示例说明 |
| 我们除了可以直接使用社区提供的Exportter以外,还可以基于prometheus提供的【客户端库(Client Library)】创建适合自己的Exporter程序,目前Prometheus社区官方提供了对如下编程语言的支持:Python、Go、Java/Scala、Ruby、Rust。还提供了非官方第三方客户端库的编程语言支持:Bash、C、C++、Dart、Delphi、Erlang、Lua、C#、Node.js、Perl、PHP、R、Swift。 |||
[Exporter的两个来源【社区提供】与【用户自定义】]
1.2、Node Exporter的下载与安装
**node_exporter主要用于采集被监控主机上的cpu负载,内存使用情况,网络等数据,并上报数据给Prometheus Server。**node_exporter 其实是一个以http_server方式运行在后台,并且持续不断采集 Linux系统中各种操作系统本身相关的监控参数的程序,其采集量是很快很全的,默认的采集项目就远超过了我们的实际需求。
bash
#【在需要被监控的主机上】下载安装Node Exporter
#1-下载Node Exporter
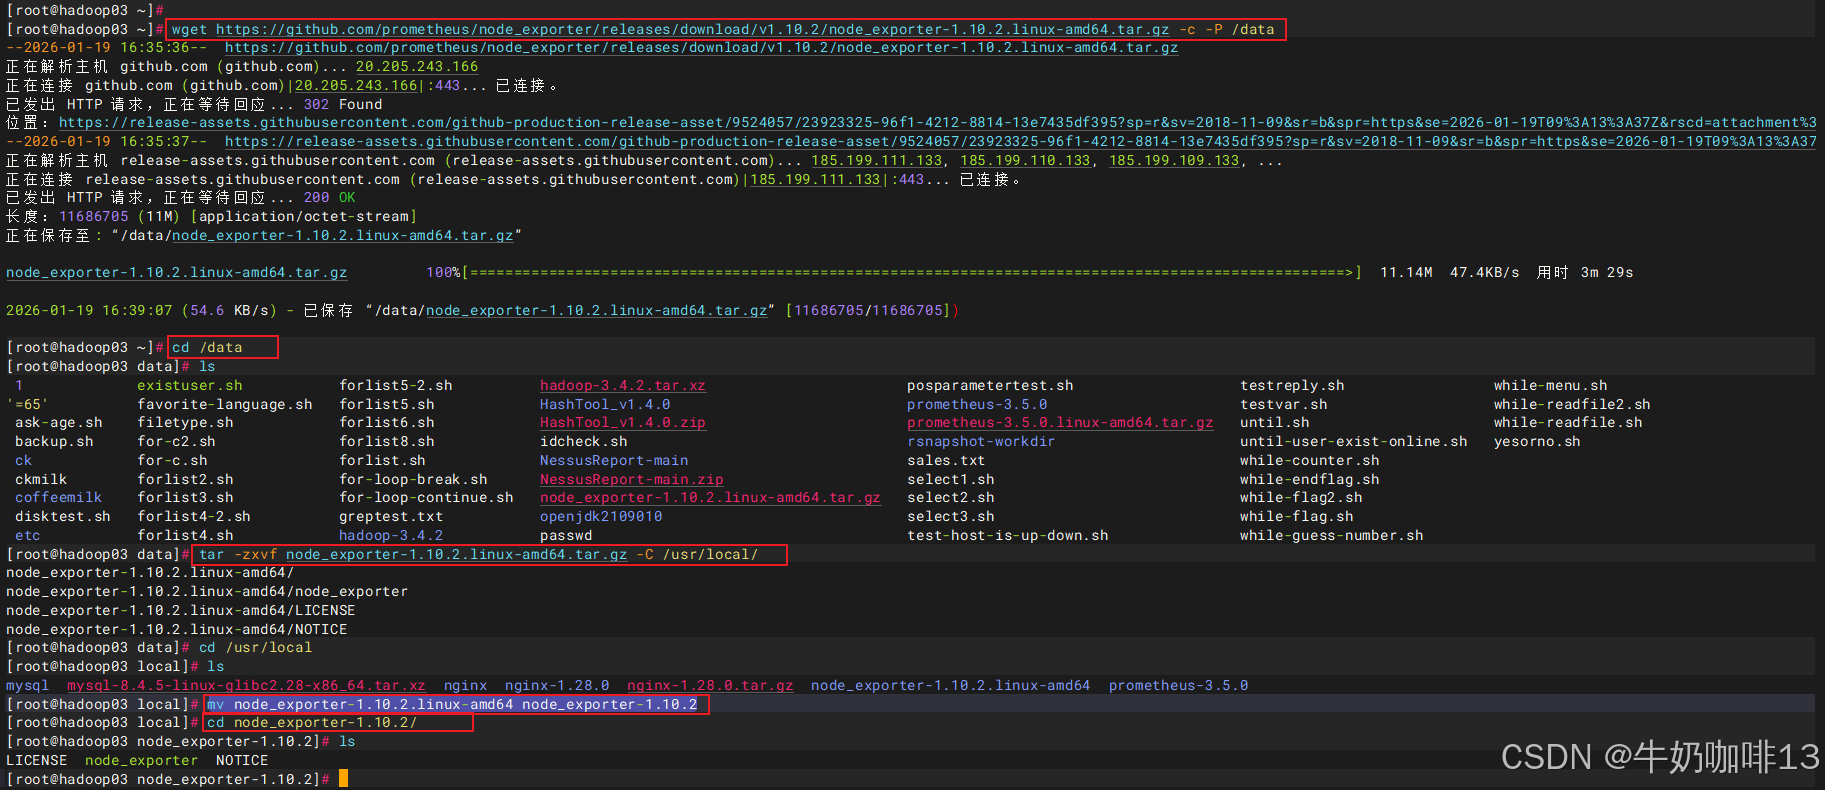
wget https://github.com/prometheus/node_exporter/releases/download/v1.10.2/node_exporter-1.10.2.linux-amd64.tar.gz -c -P /data
#2-解压Node Exporter
cd /data
tar -zxvf node_exporter-1.10.2.linux-amd64.tar.gz -C /usr/local/
cd /usr/local
mv node_exporter-1.10.2.linux-amd64 node_exporter-1.10.2
#3-编写Node Exporter的服务脚本
vi /usr/lib/systemd/system/node_exporter.service
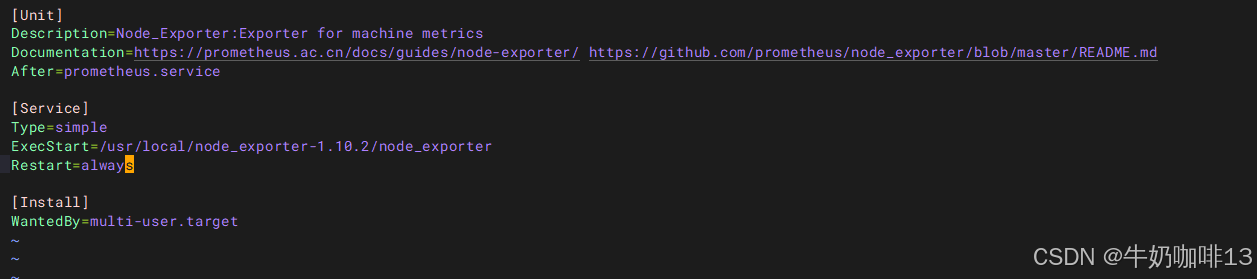
#【/usr/lib/systemd/system/node_exporter.service】文件的完整内容:
[Unit]
Description=Node_Exporter:Exporter for machine metrics
Documentation=https://prometheus.ac.cn/docs/guides/node-exporter/ https://github.com/prometheus/node_exporter/blob/master/README.md
After=prometheus.service
[Service]
Type=simple
ExecStart=/usr/local/node_exporter-1.10.2/node_exporter
Restart=always
[Install]
WantedBy=multi-user.target
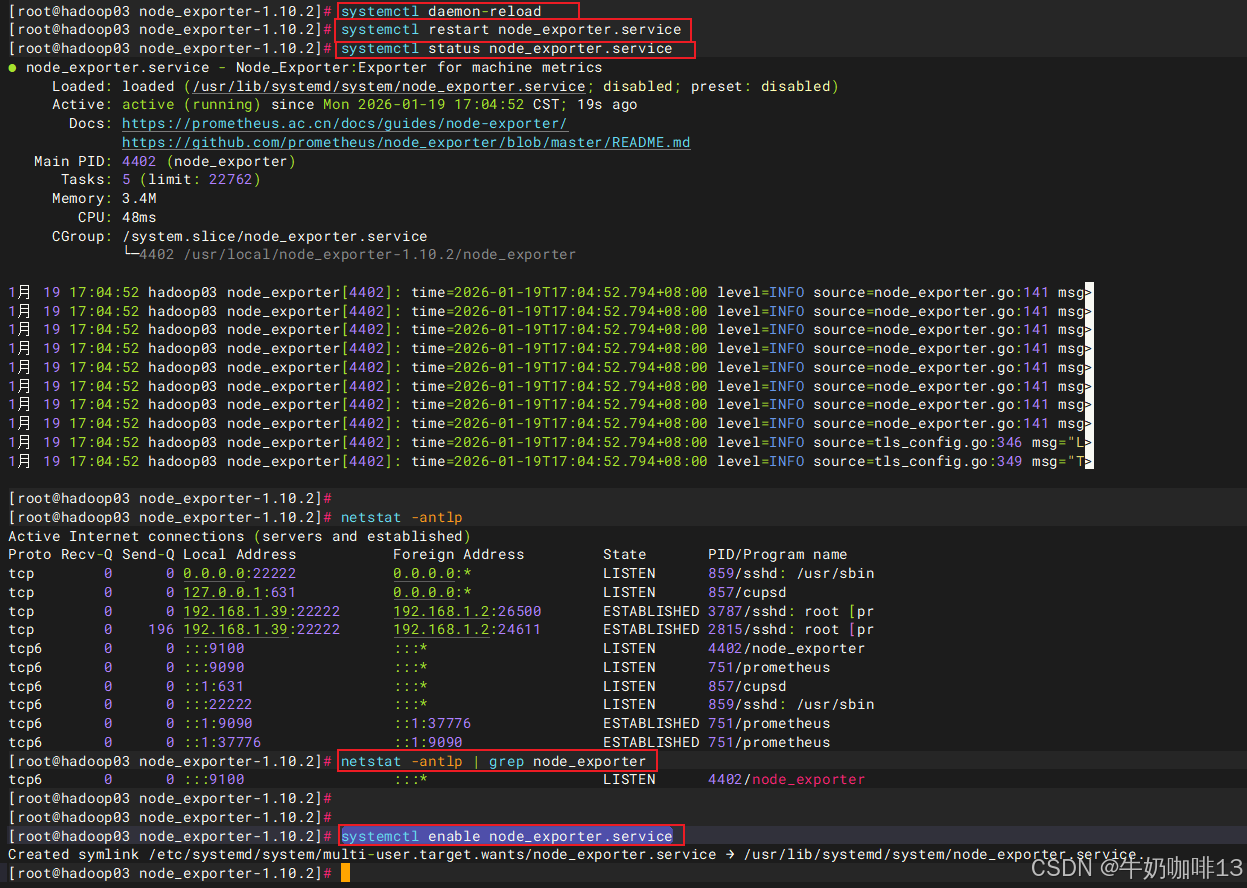
#4-启动node_exporter服务并设置开机自启
systemctl daemon-reload
systemctl restart node_exporter.service
systemctl status node_exporter.service
netstat -antlp | grep node_exporter
systemctl enable node_exporter.service
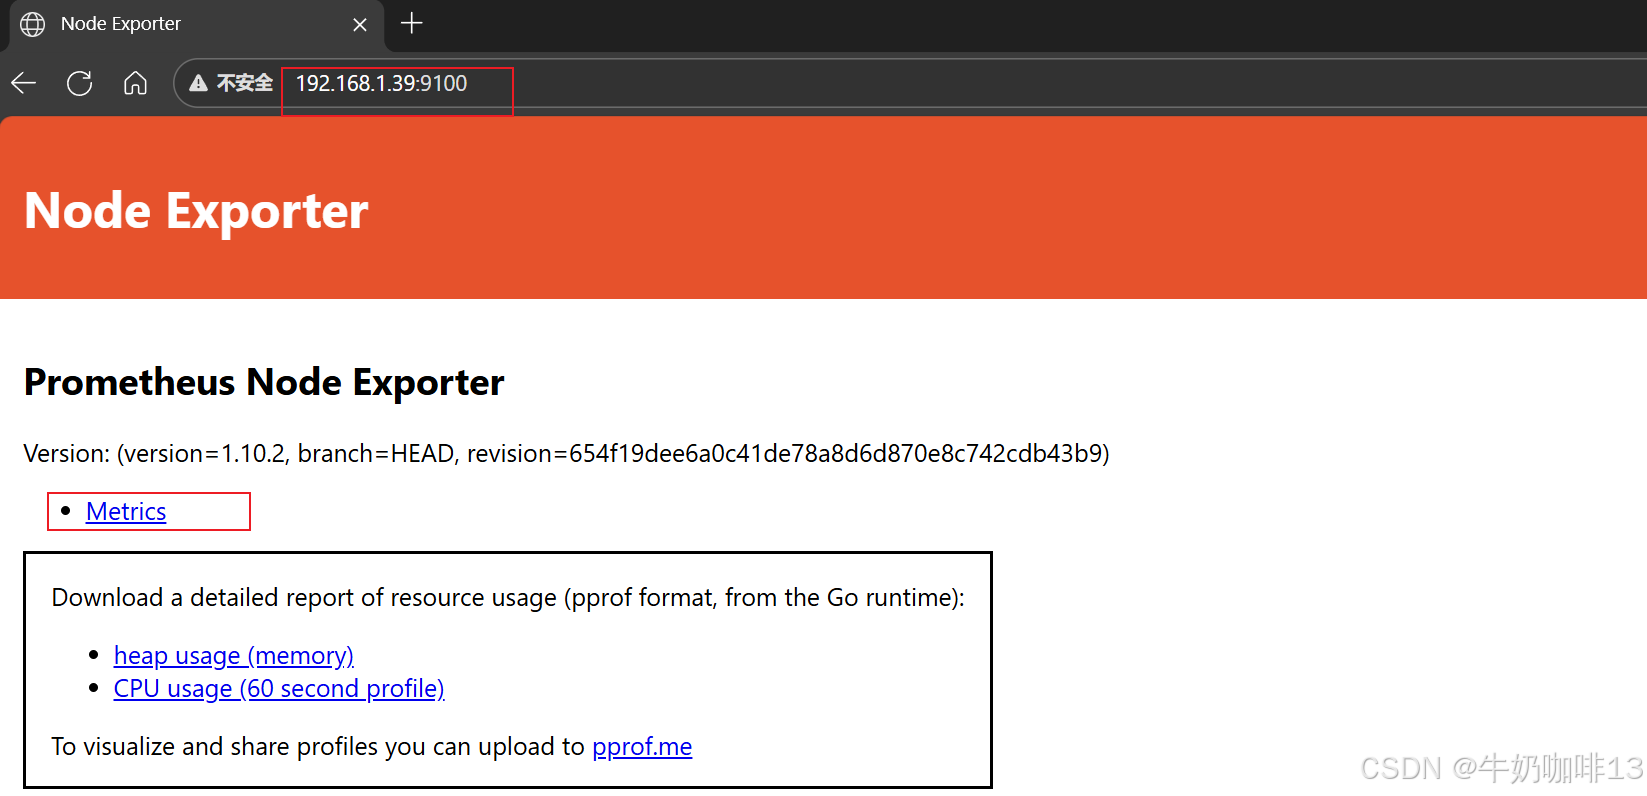
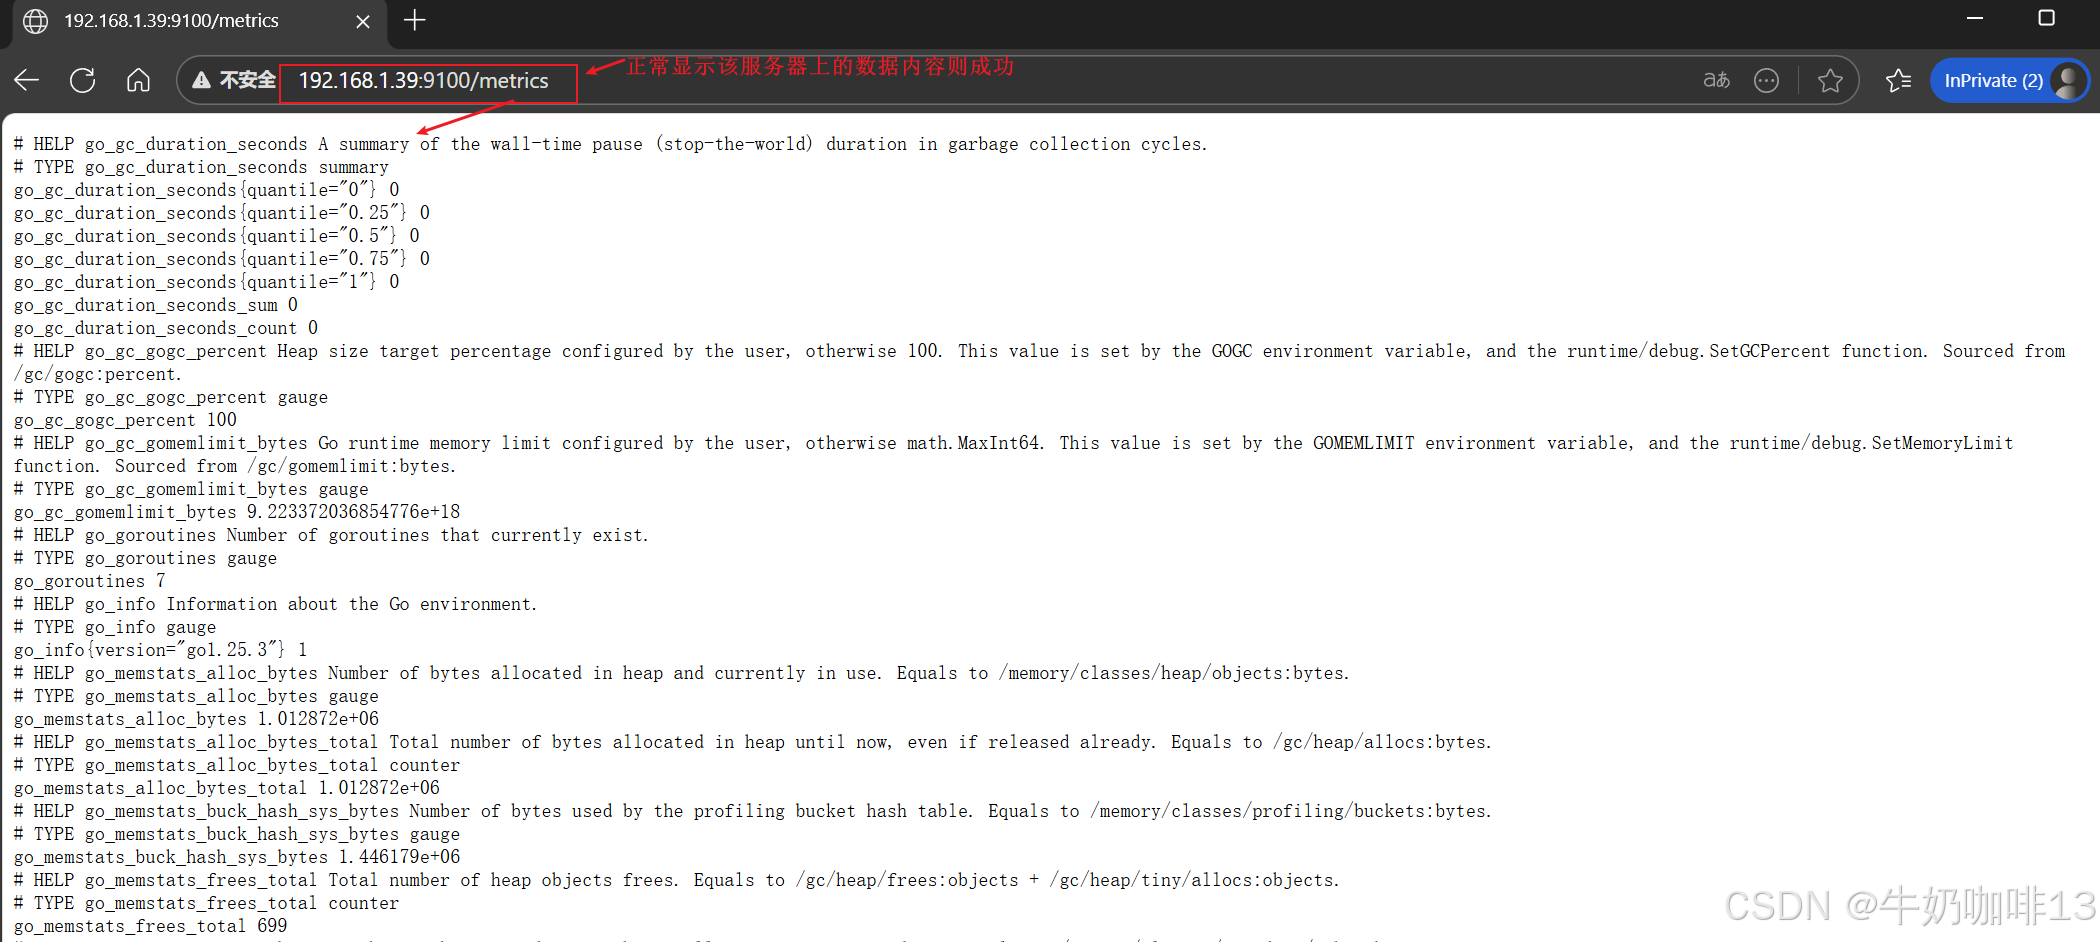
#5-在浏览器查看node_exporter的内容【ip:9100】
ip a
#注意1:若服务器的防火墙是开启状态的则需要放开9100端口
firewall-cmd --list-port
firewall-cmd --zone=public --add-port=9100/tcp --permanent
firewall-cmd --reload
#注意2:若是启动node_exporter报错,则需要【查看系统日志中node_exporter相关的错误信息】后解决
journalctl -u node_exporter -fLinux中怎样打开防火墙指定端口_linux防火墙怎么开放端口

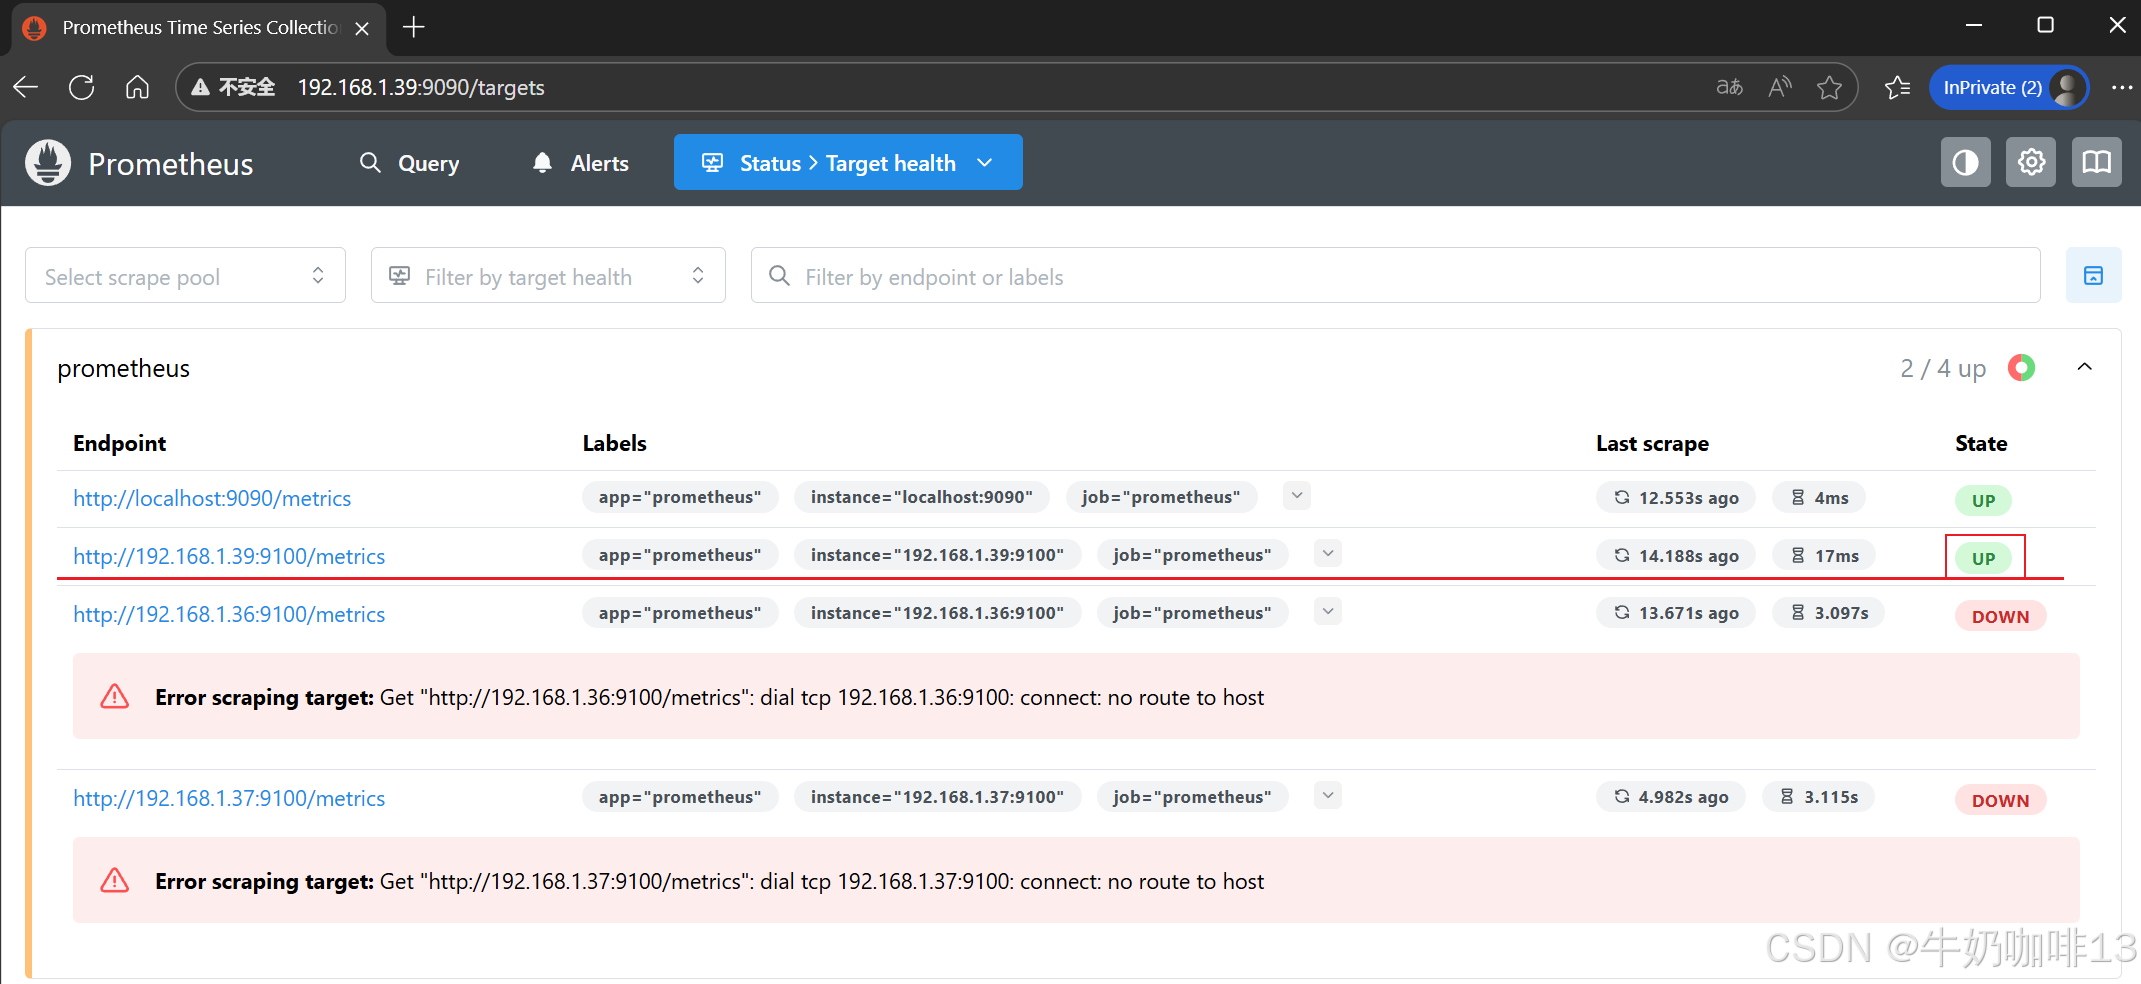
1.3、在Prometheus Server添加安装了node_exporter的节点
bash
#在Prometheus Server添加该Node_Exporter节点
cd /usr/local/prometheus-3.5.0/
vi prometheus.yml
#【prometheus.yml】文件最后的【scrape_configs-->static_configs-->targets】的中括号中添加上该node_exporter的IP:9100(如:192.168.1.39:9100),如下所示:
scrape_configs:
# The job name is added as a label `job=<job_name>` to any timeseries scraped from this config.
- job_name: "prometheus"
# metrics_path defaults to '/metrics'
# scheme defaults to 'http'.
static_configs:
- targets: ["localhost:9090",'192.168.1.39:9100','192.168.1.36:9100','192.168.1.37:9100']
# The label name is added as a label `label_name=<label_value>` to any timeseries scraped from this config.
labels:
app: "prometheus"
#验证修改的prometheus.yml文件配置是否正确并重启服务让配置生效
./promtool check config prometheus.yml
systemctl restart prometheus
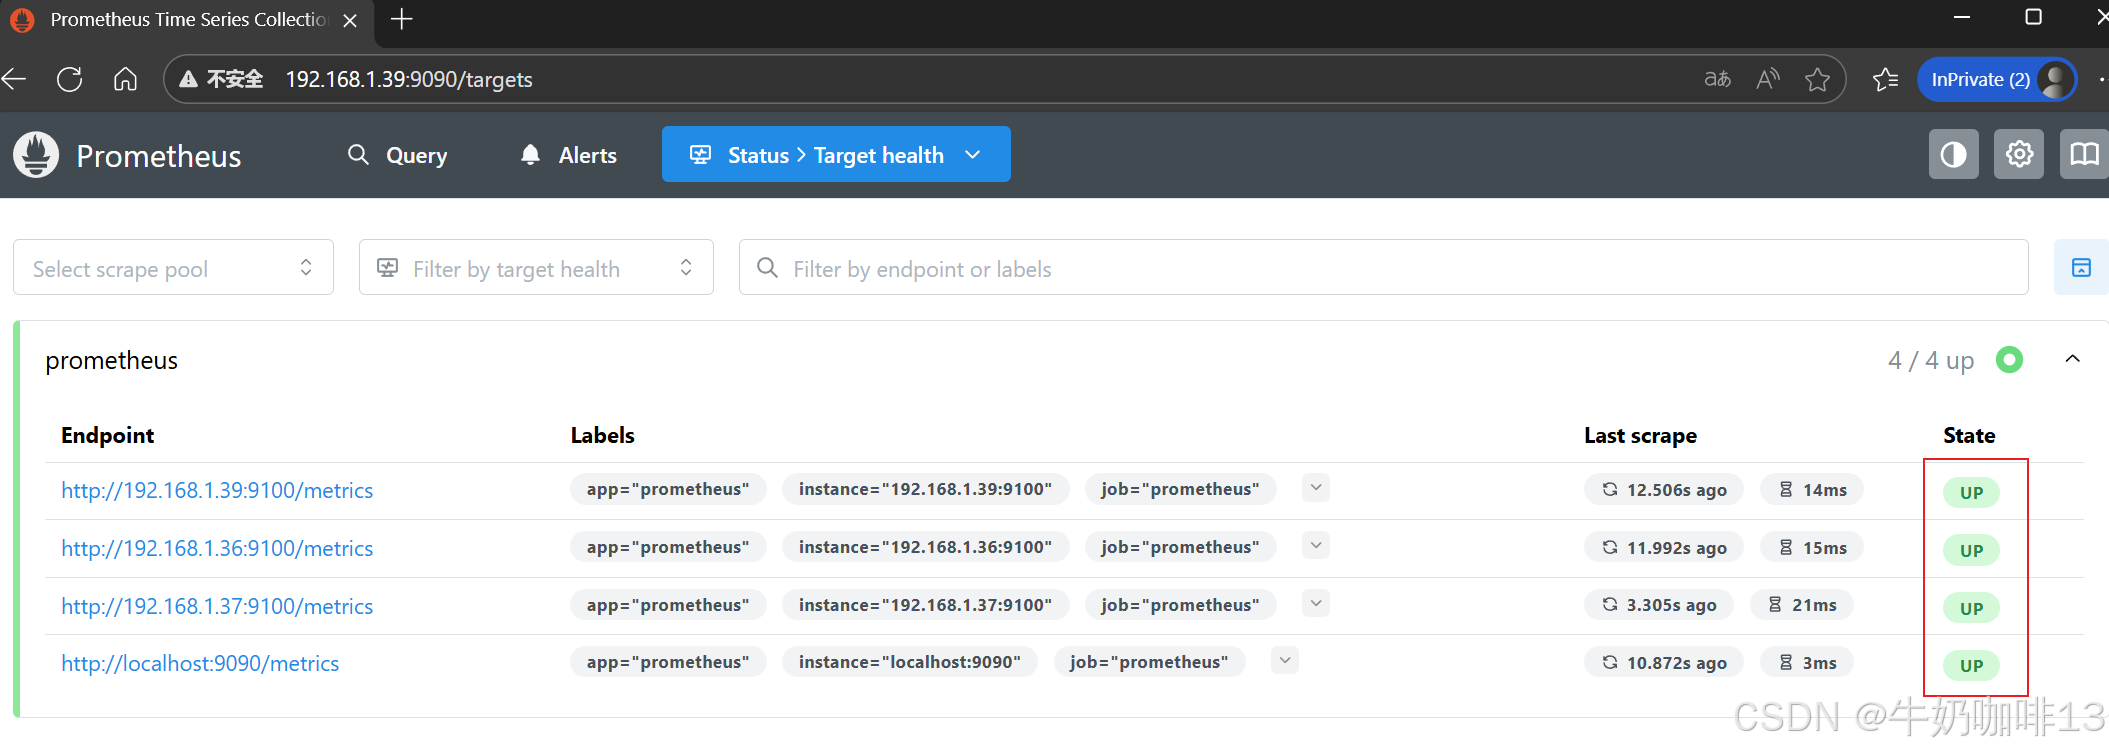
systemctl status prometheus.service然后打开浏览器进入Prometheus Server的Web界面【IP:9090】查看【Status-->Target health】即可看到添加的node_exporter节点及其状态【up】表示在线【down】表示离线。如下图所示:
二、安装Grafana并展示Prometheus数据
2.1、下载安装Grafana
bash
#Linux系统下载安装Grafana【grafana的官网地址:https://grafana.com/oss/grafana/】
#【Grafana的安装教程地址:https://grafana.com/docs/grafana/latest/setup-grafana/installation/redhat-rhel-fedora/】

#1-直接在线安装Grafana
sudo yum install -y https://dl.grafana.com/grafana-enterprise/release/12.3.1/grafana-enterprise_12.3.1_20271043721_linux_amd64.rpm

#2-重启Grafana服务并设置开机自启
systemctl daemon-reload
systemctl enable grafana-server.service
systemctl start grafana-server.service

#3-查看Grafana的进程及其网络端口(3000)
ps -ef | grep grafana
netstat -antlp | grep grafana


#注意:查看系统当前的防火墙是否打开,若打开则需要放开3000端口
#1-查看系统当前防火墙的打开状态(若显示【Active: active (running)】则表示防火墙开启中)
systemctl status firewalld
#2-【防火墙激活运行中】执行永久放开防火墙的3000端口
firewall-cmd --list-port
firewall-cmd --zone=public --add-port=3000/tcp --permanent
firewall-cmd --reload
firewall-cmd --list-port


#在浏览器中直接访问【Grafana所在服务器IP:3000】(如:192.168.1.36:3000)
#即可访问到这个Grafana的Web界面了,默认的账号和密码都是admin,如下图所示: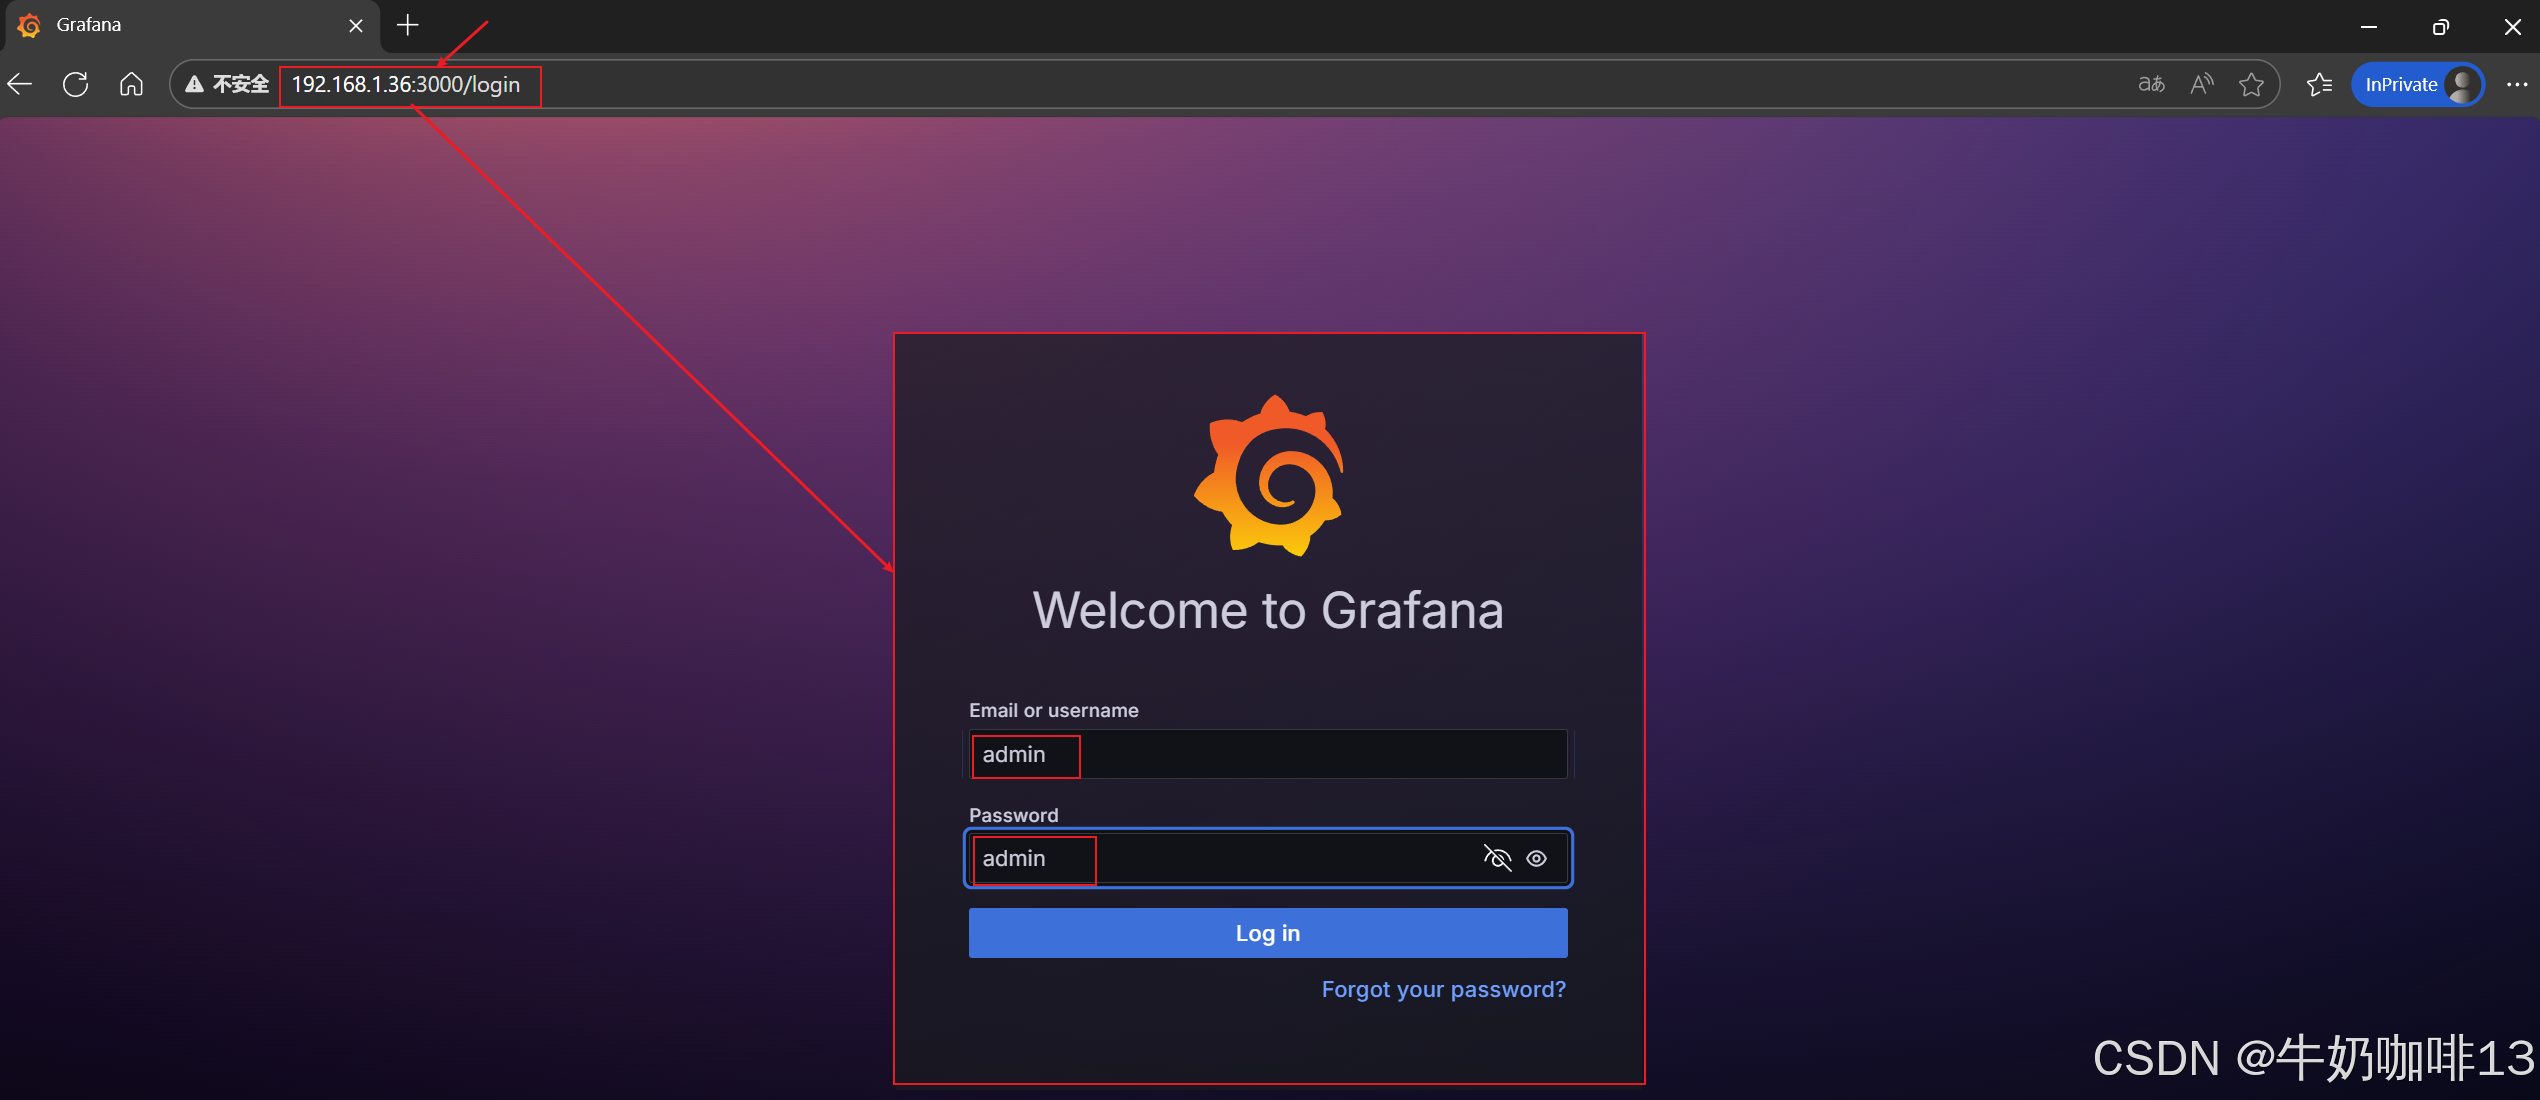
2.2、Grafana中配置显示Prometheus数据
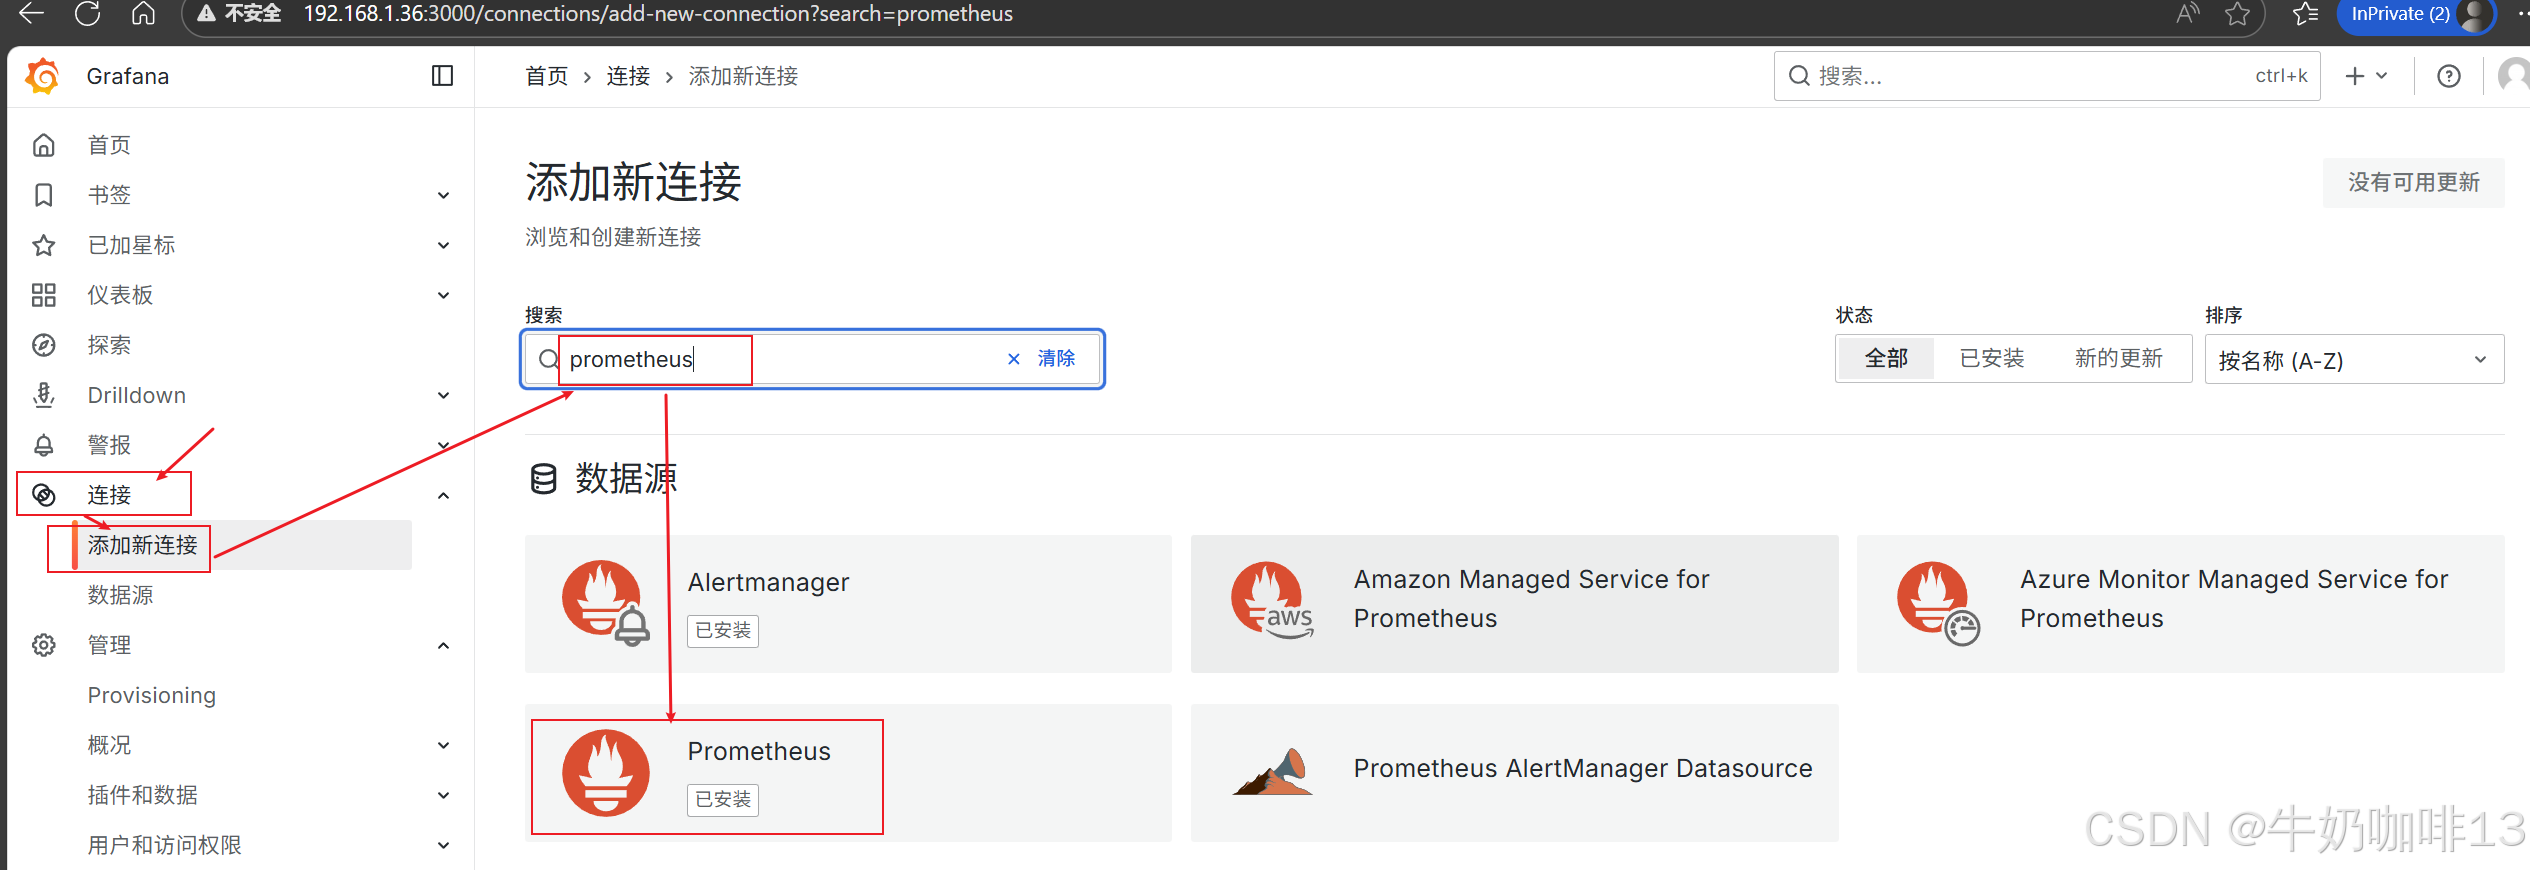
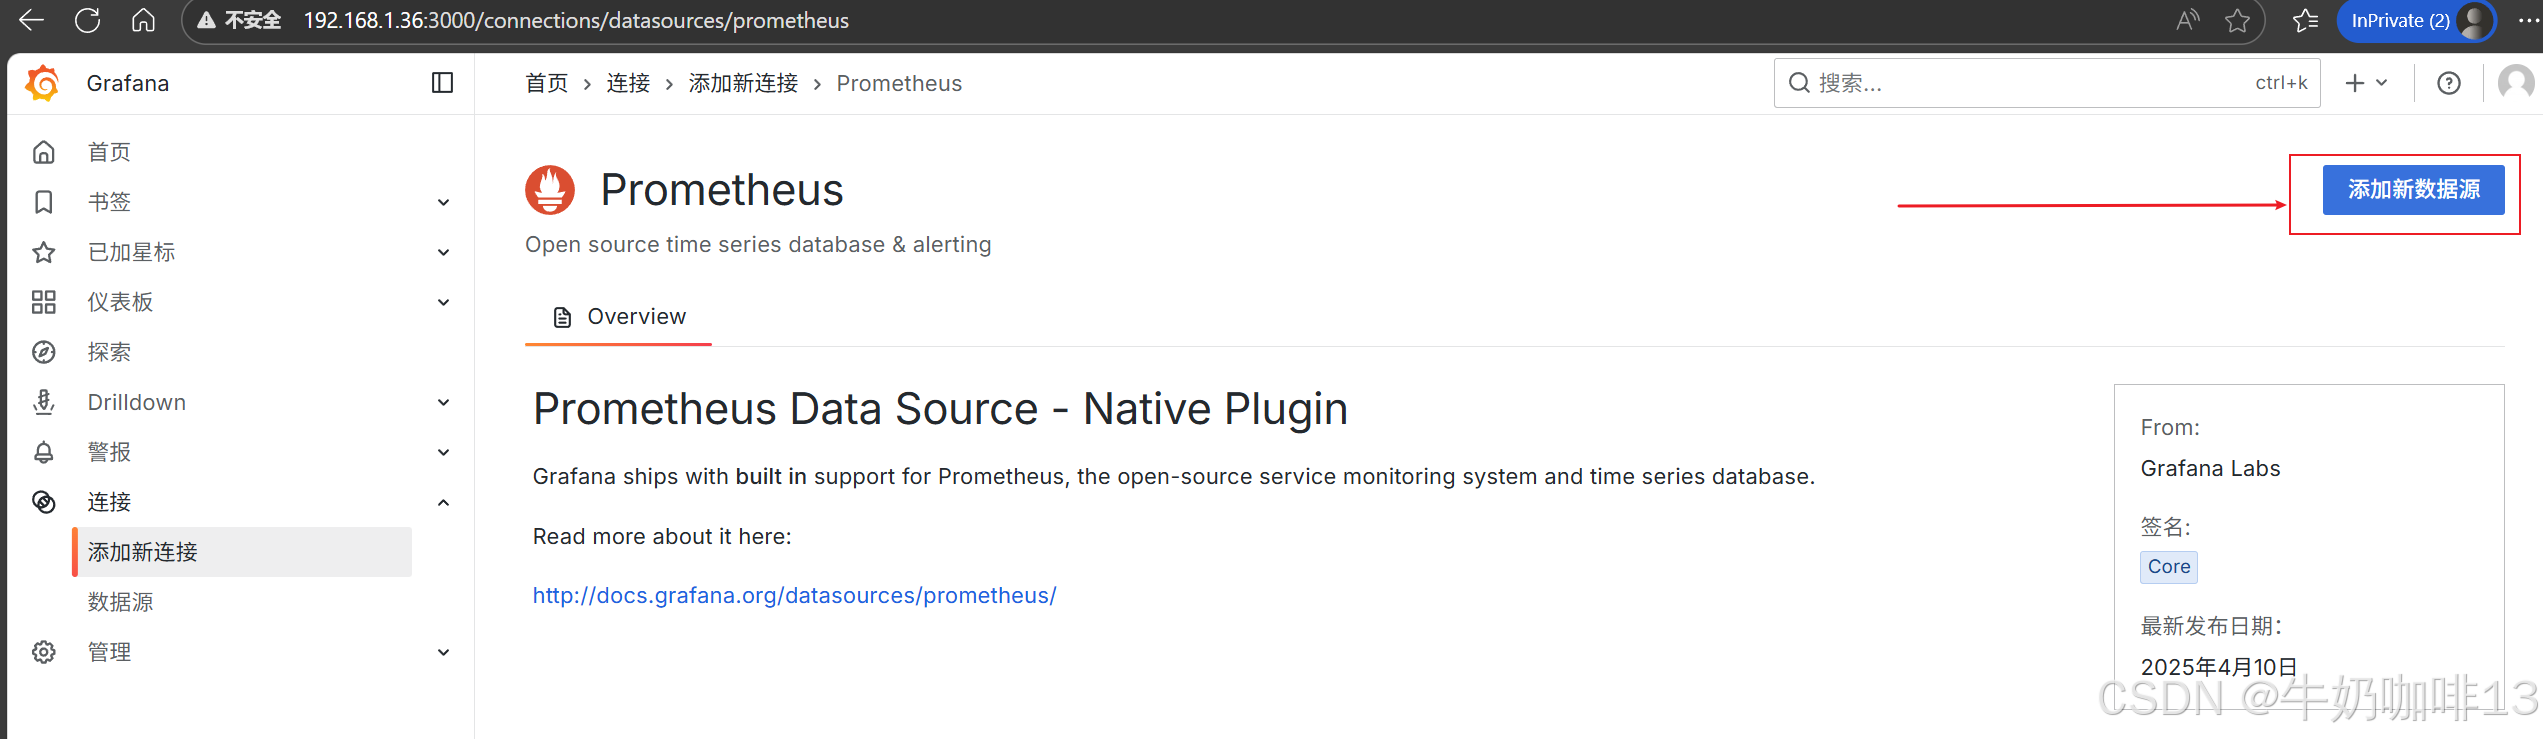
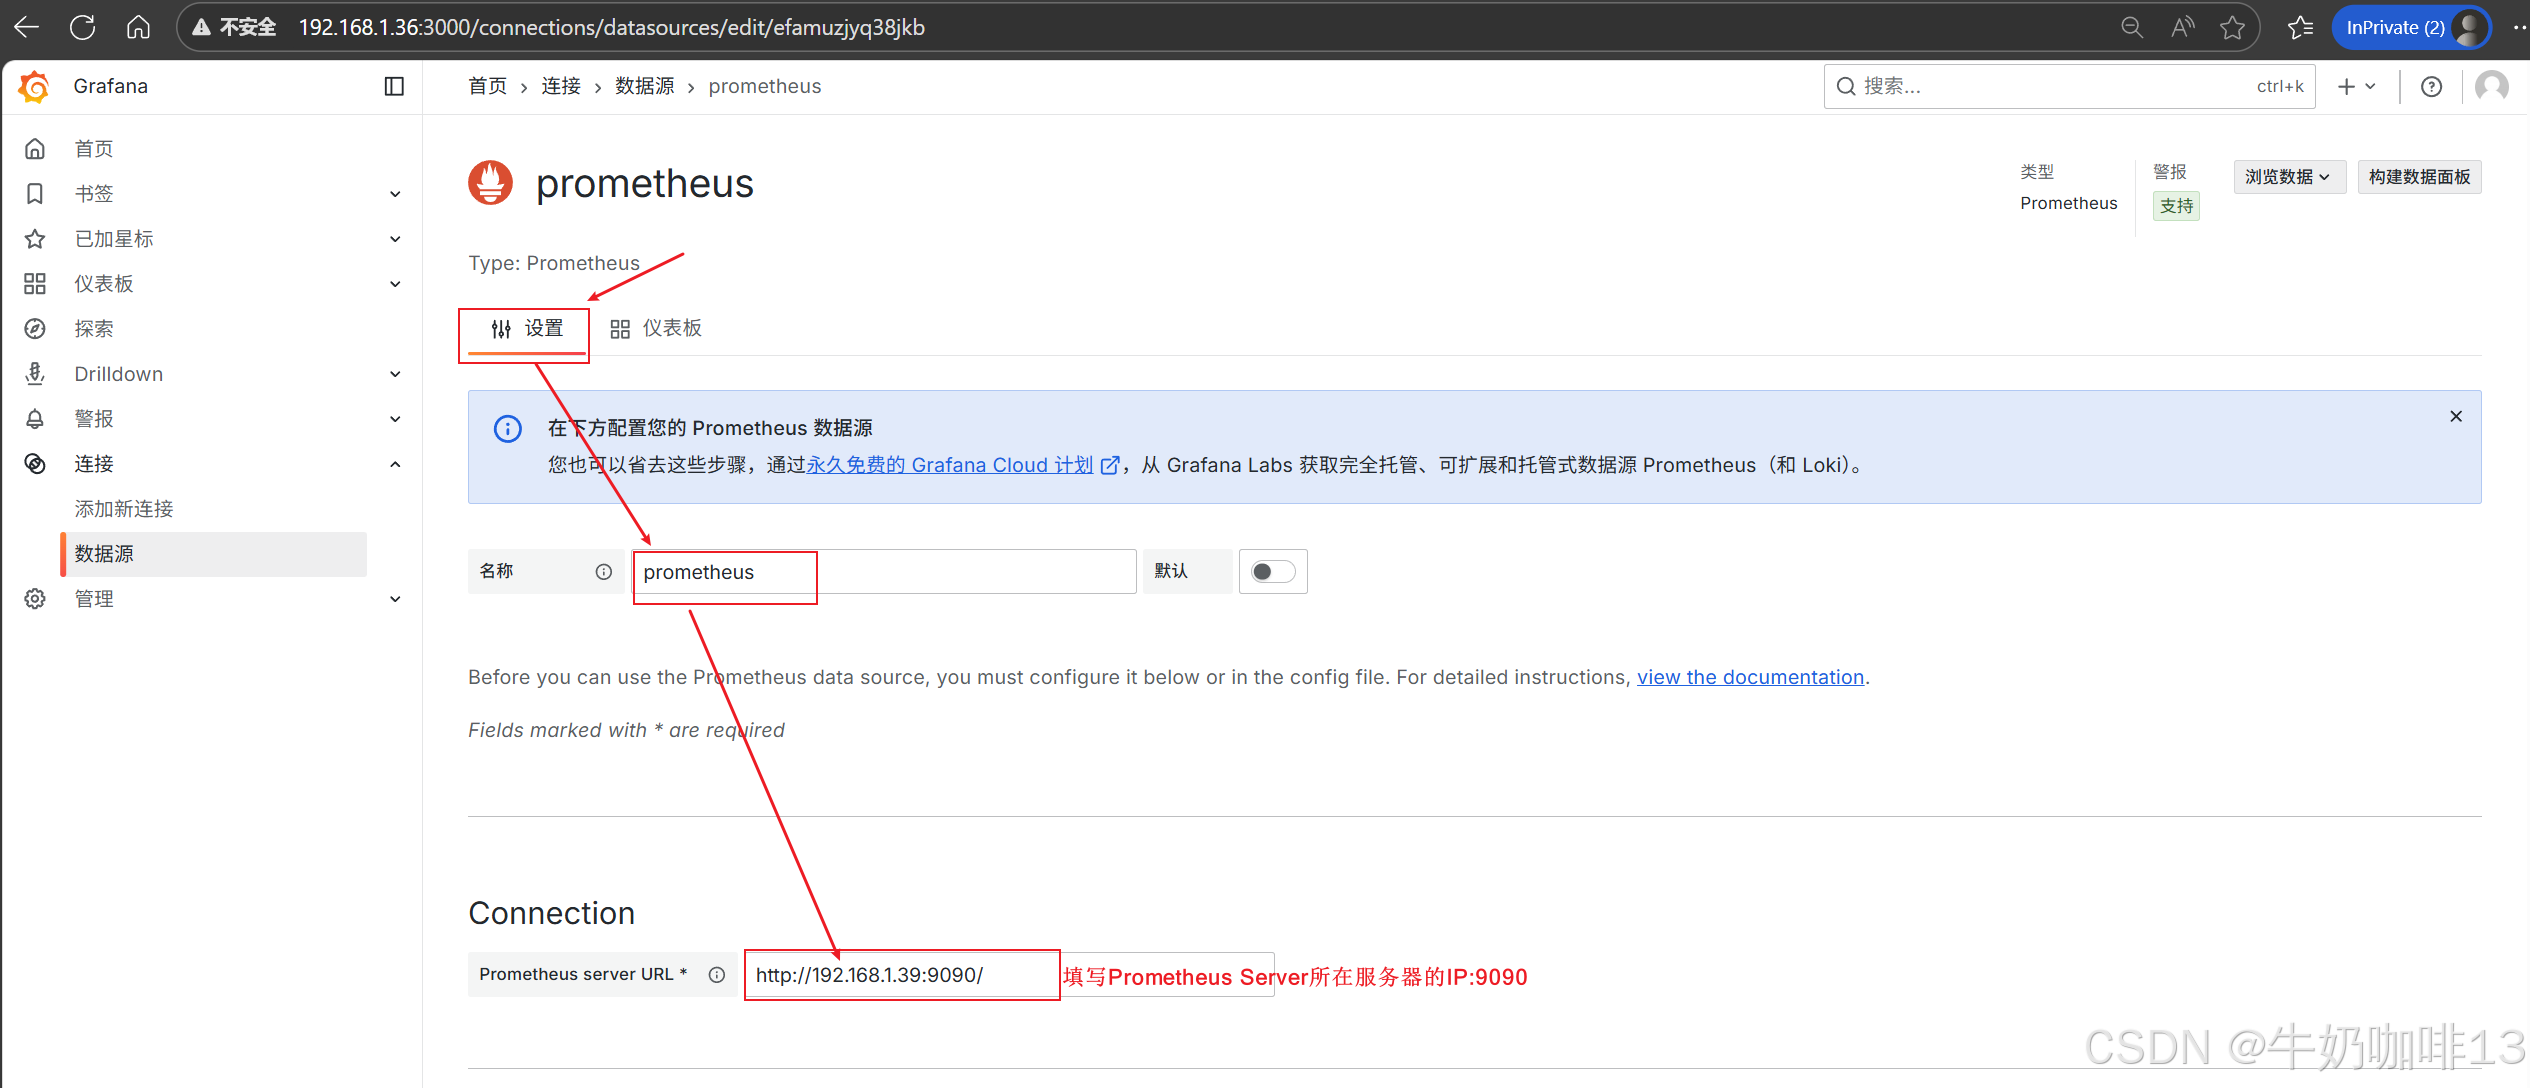
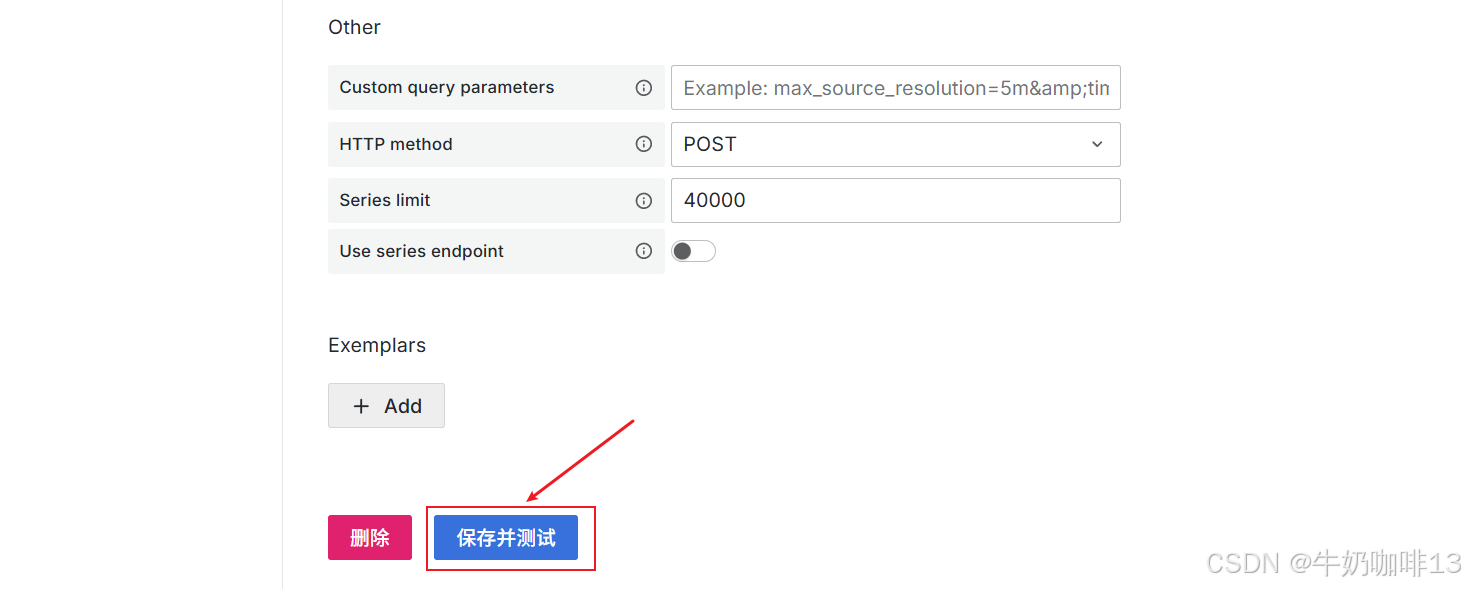
登录到Grafana中选择【连接】-->【添加新连接】-->【搜索Prometheus】后点击Prometheus-->点击右上角的【添加新数据源】则进入设置界面,在设置界面可以填写名称、与prometheus server的URL地址后点击最底部的【保存并测试】。
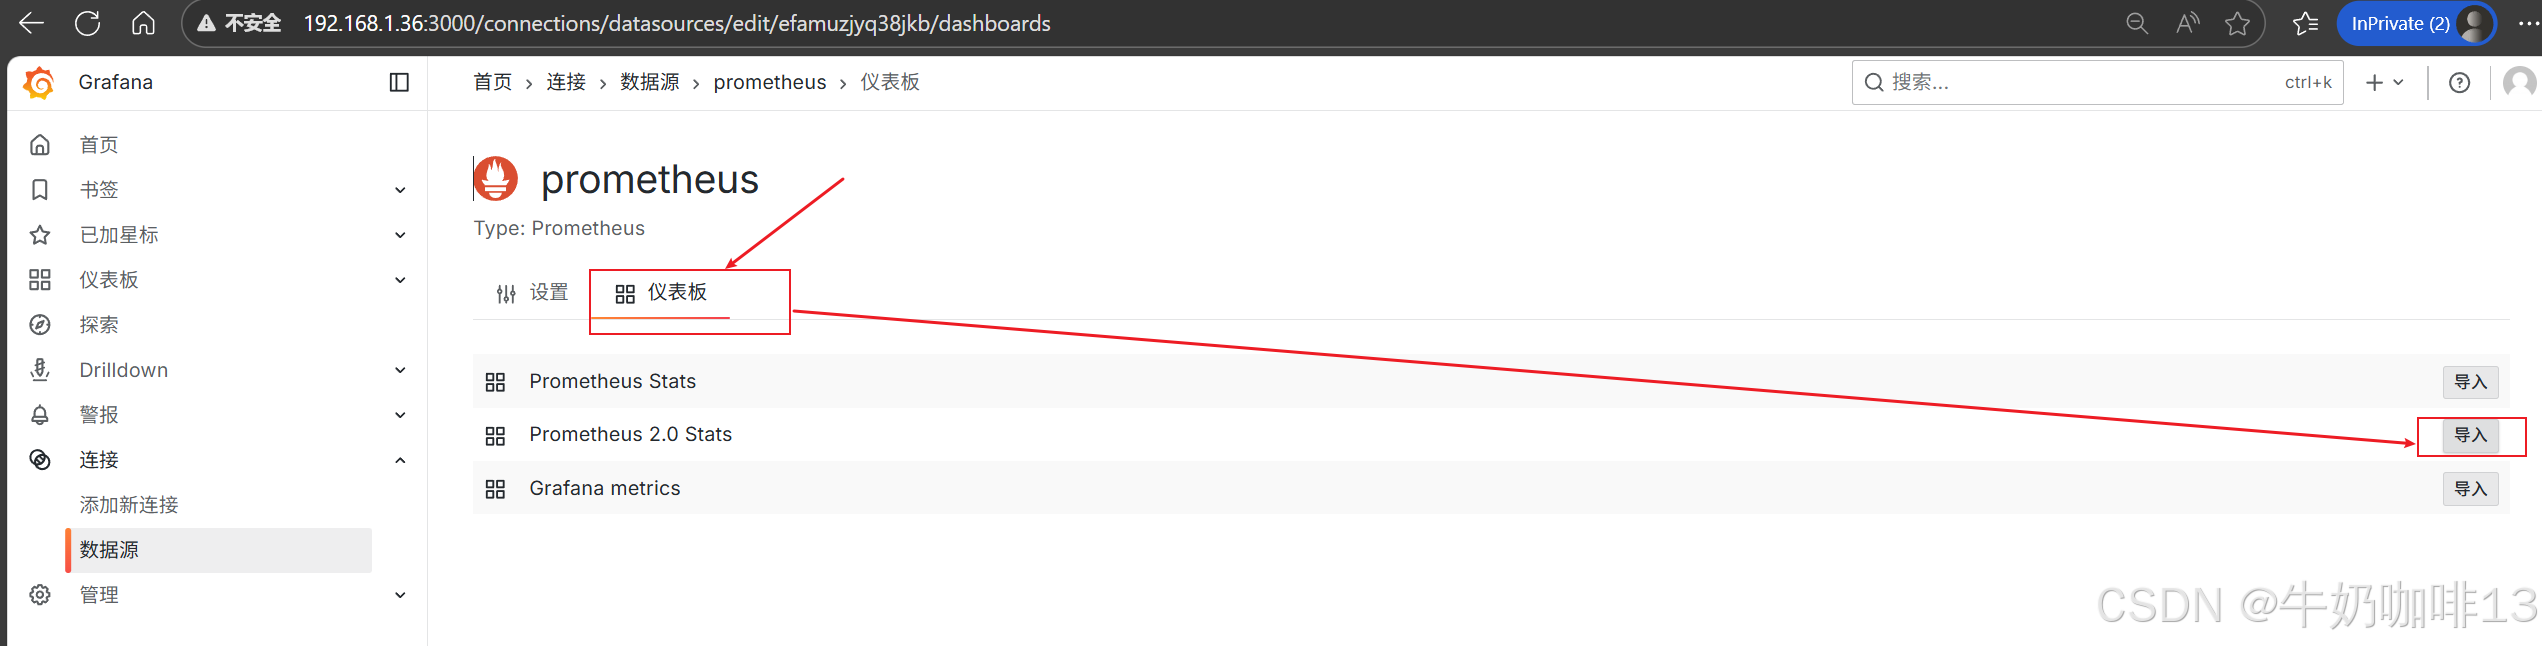
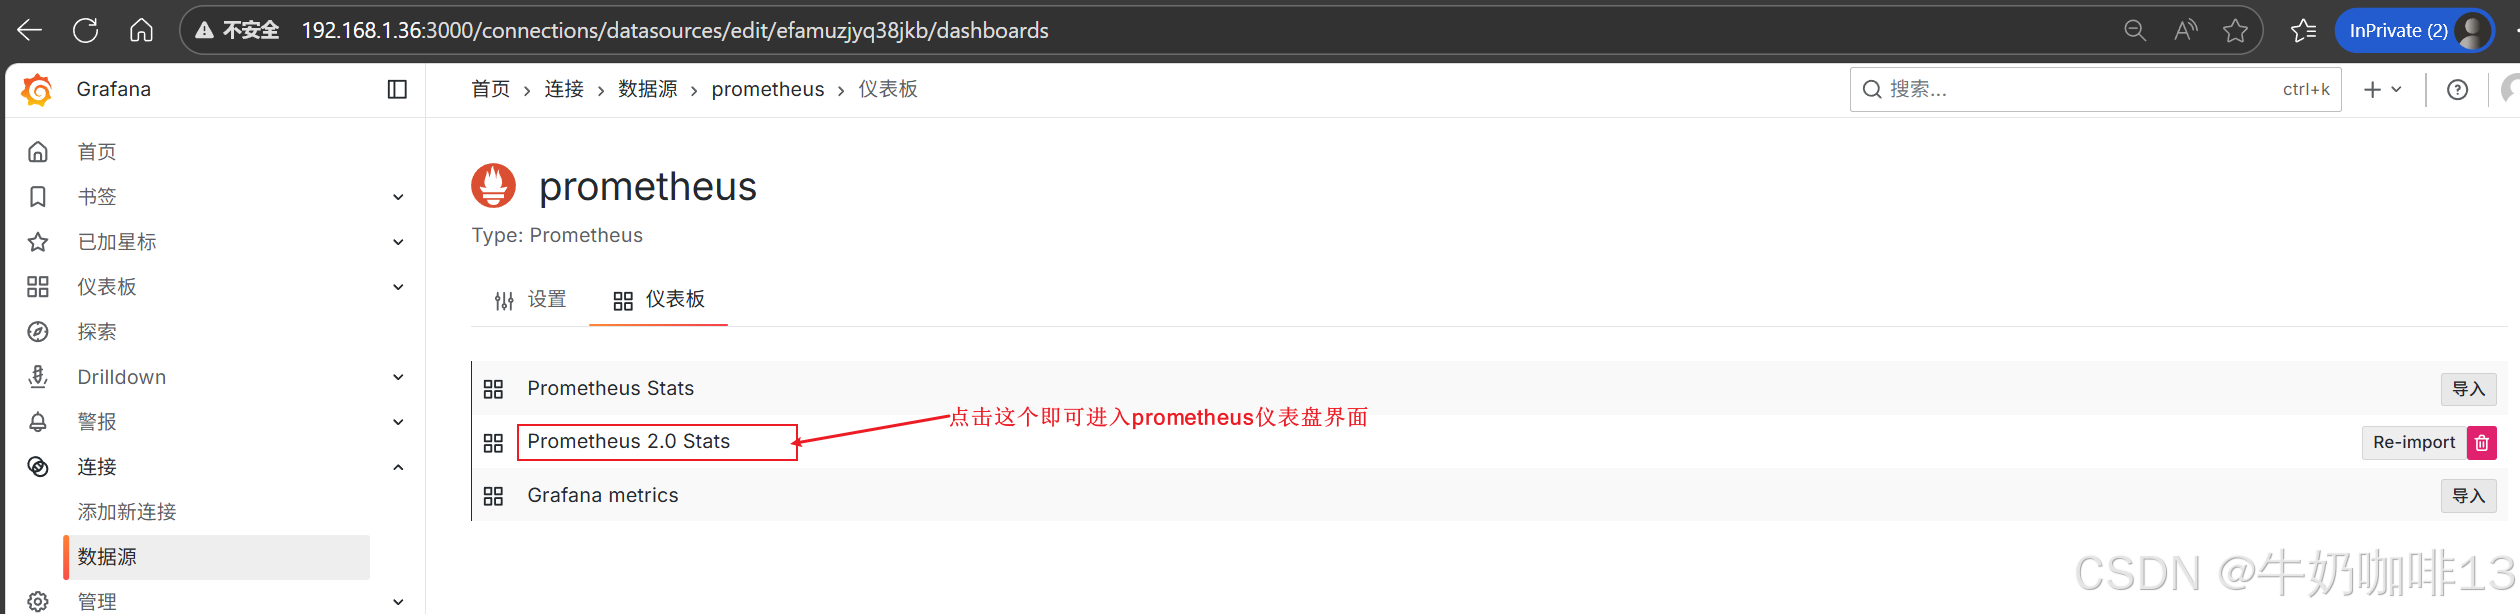
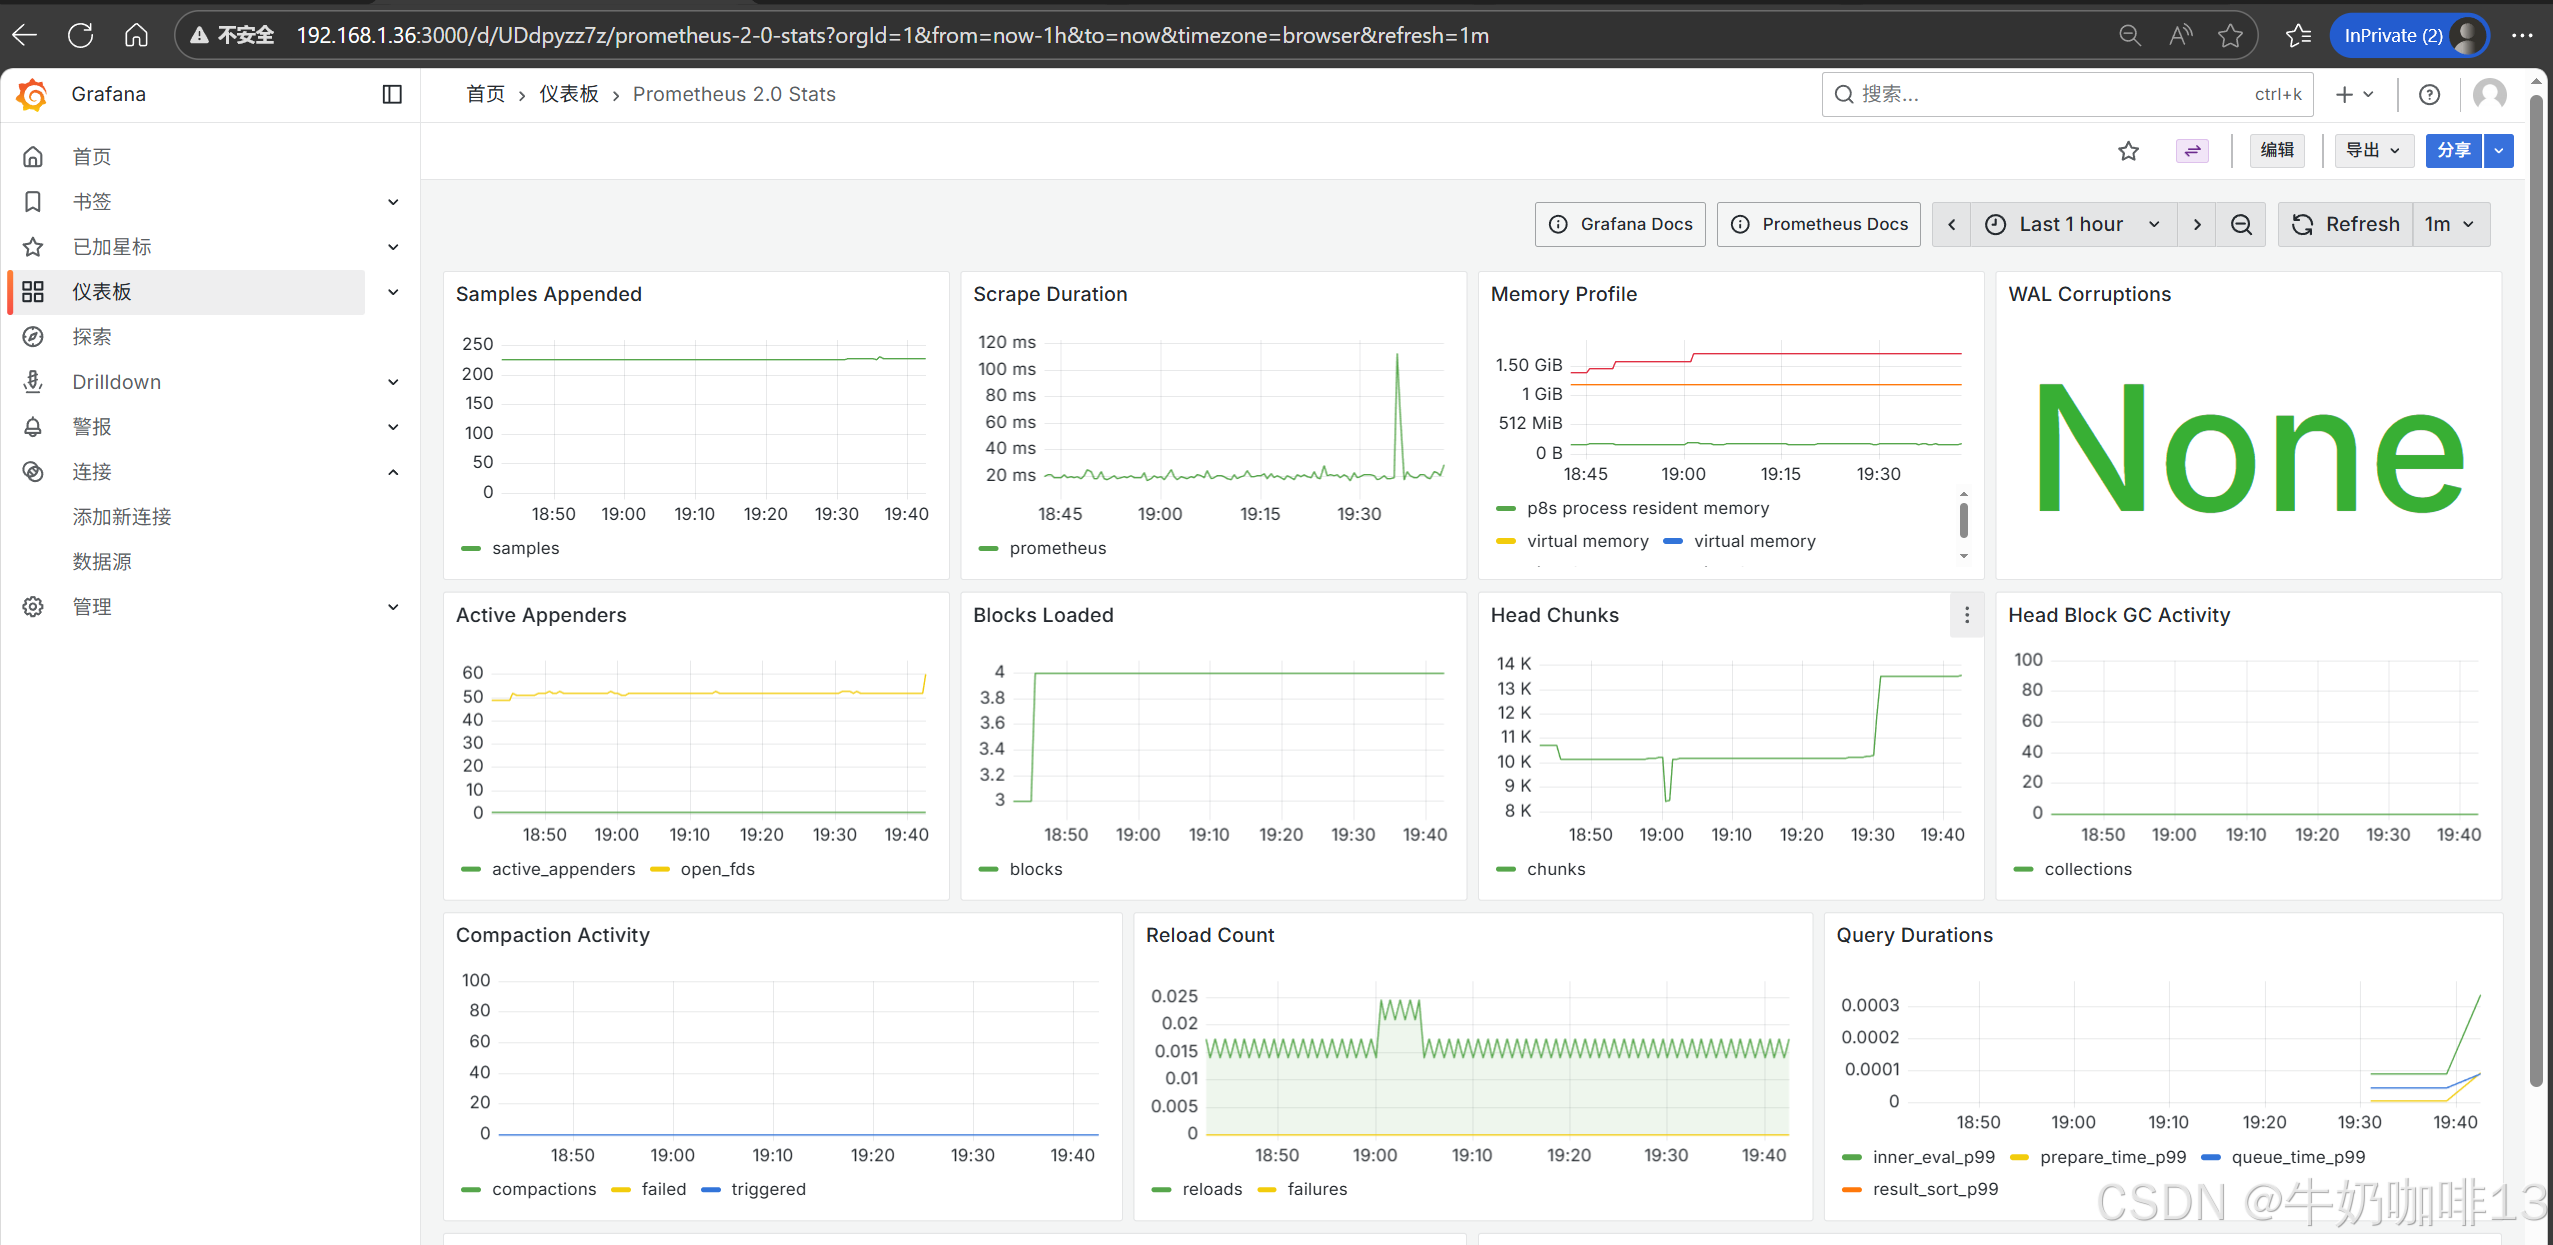
然后配置仪表盘(点击【仪表盘】-->导入【Prometheus 2.0 Stats】模板)如下图所示:
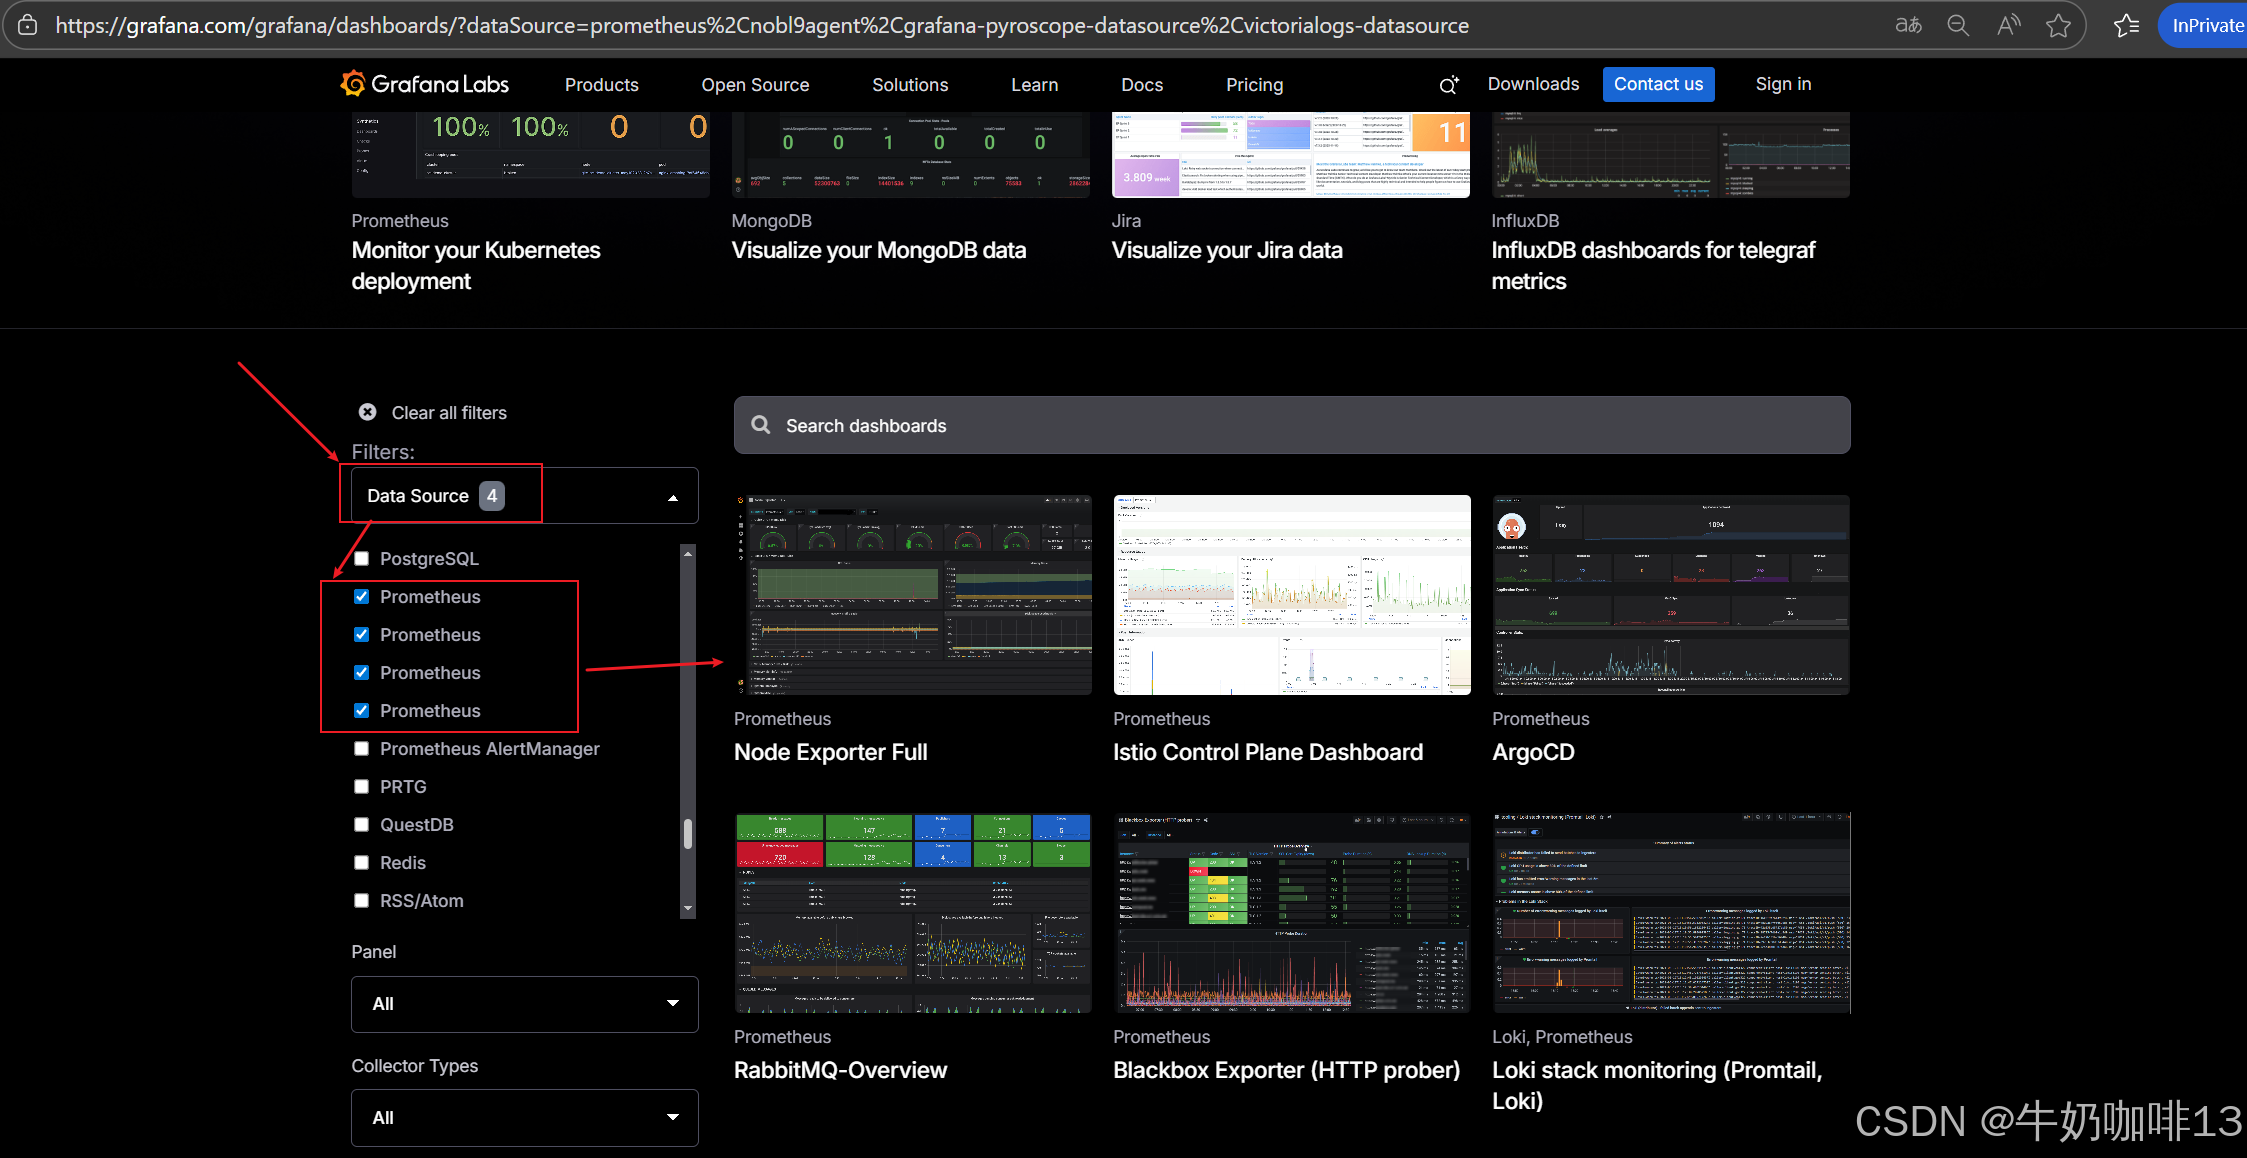
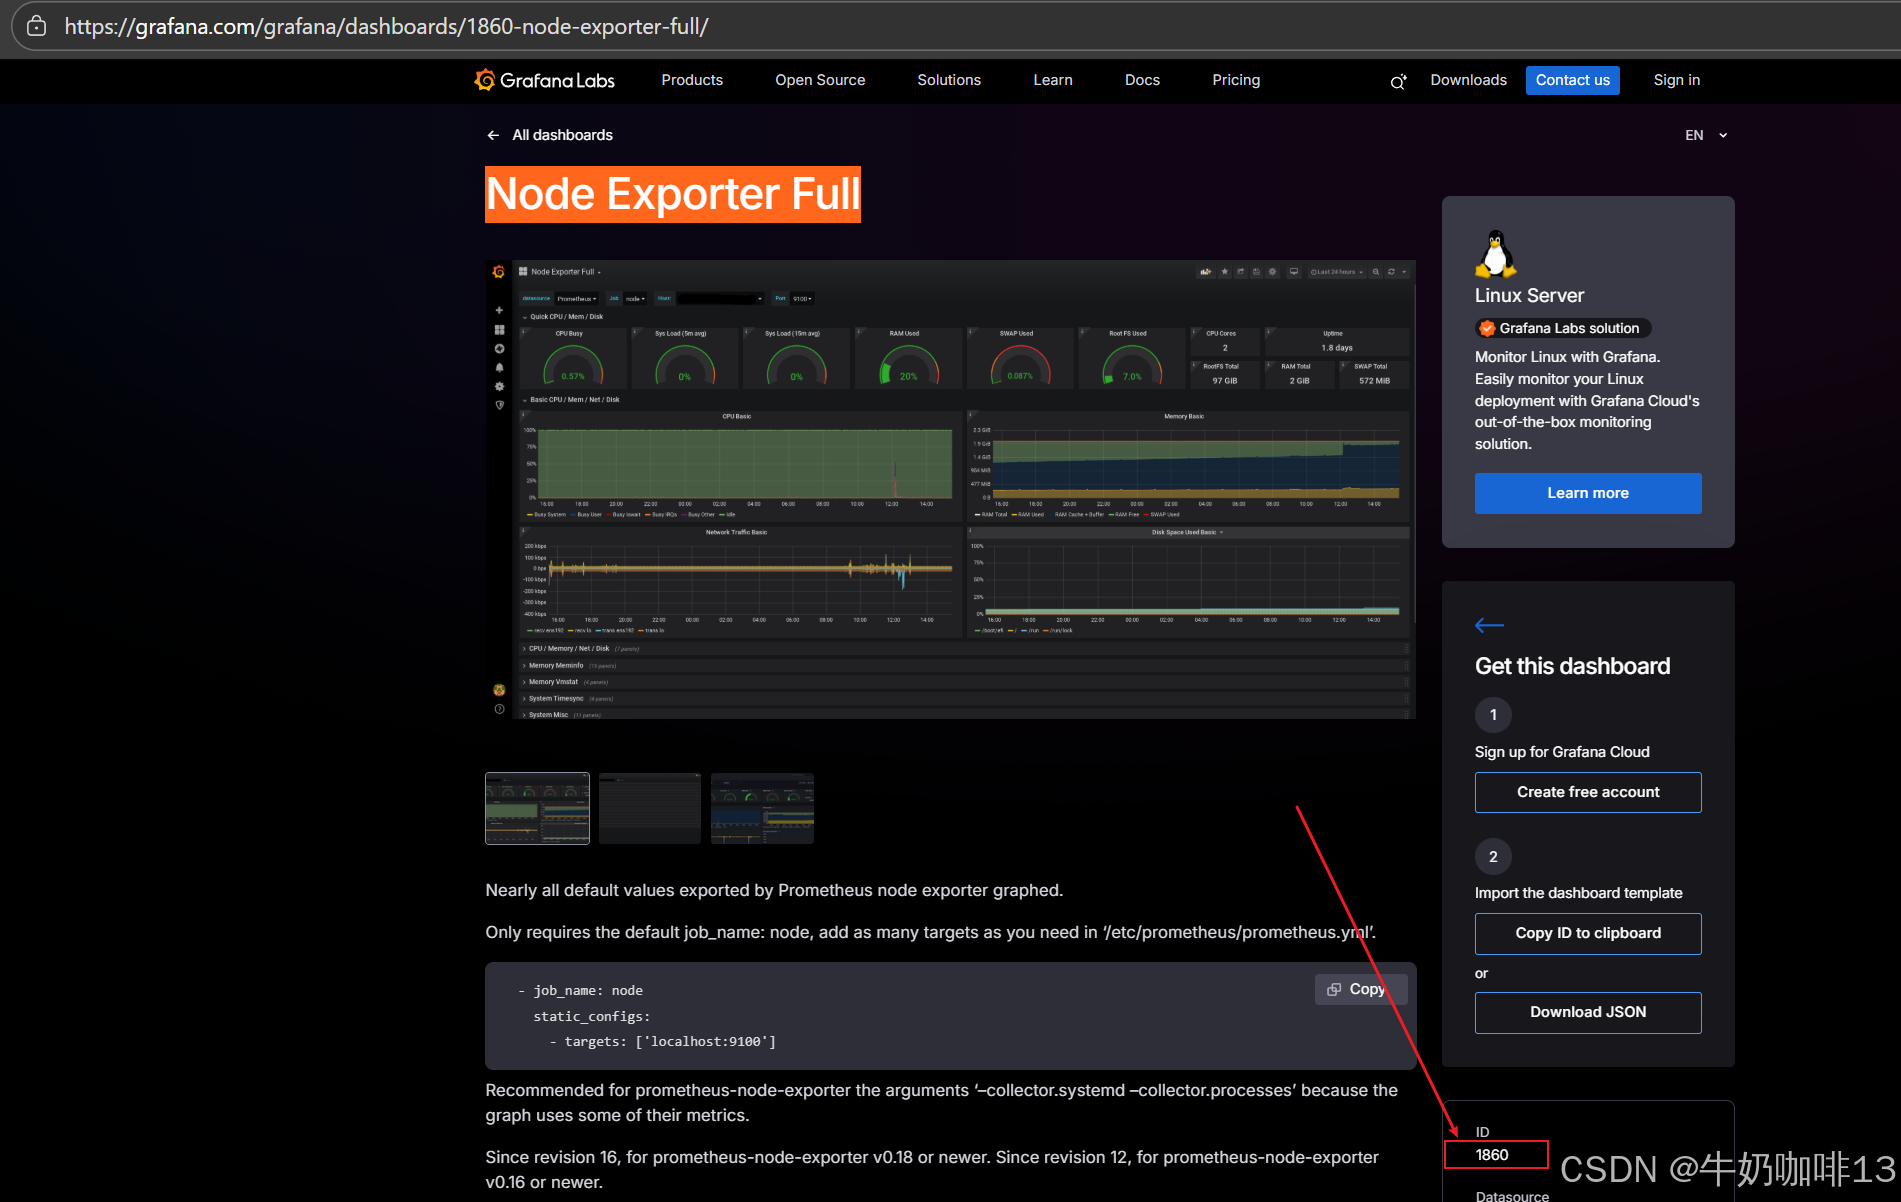
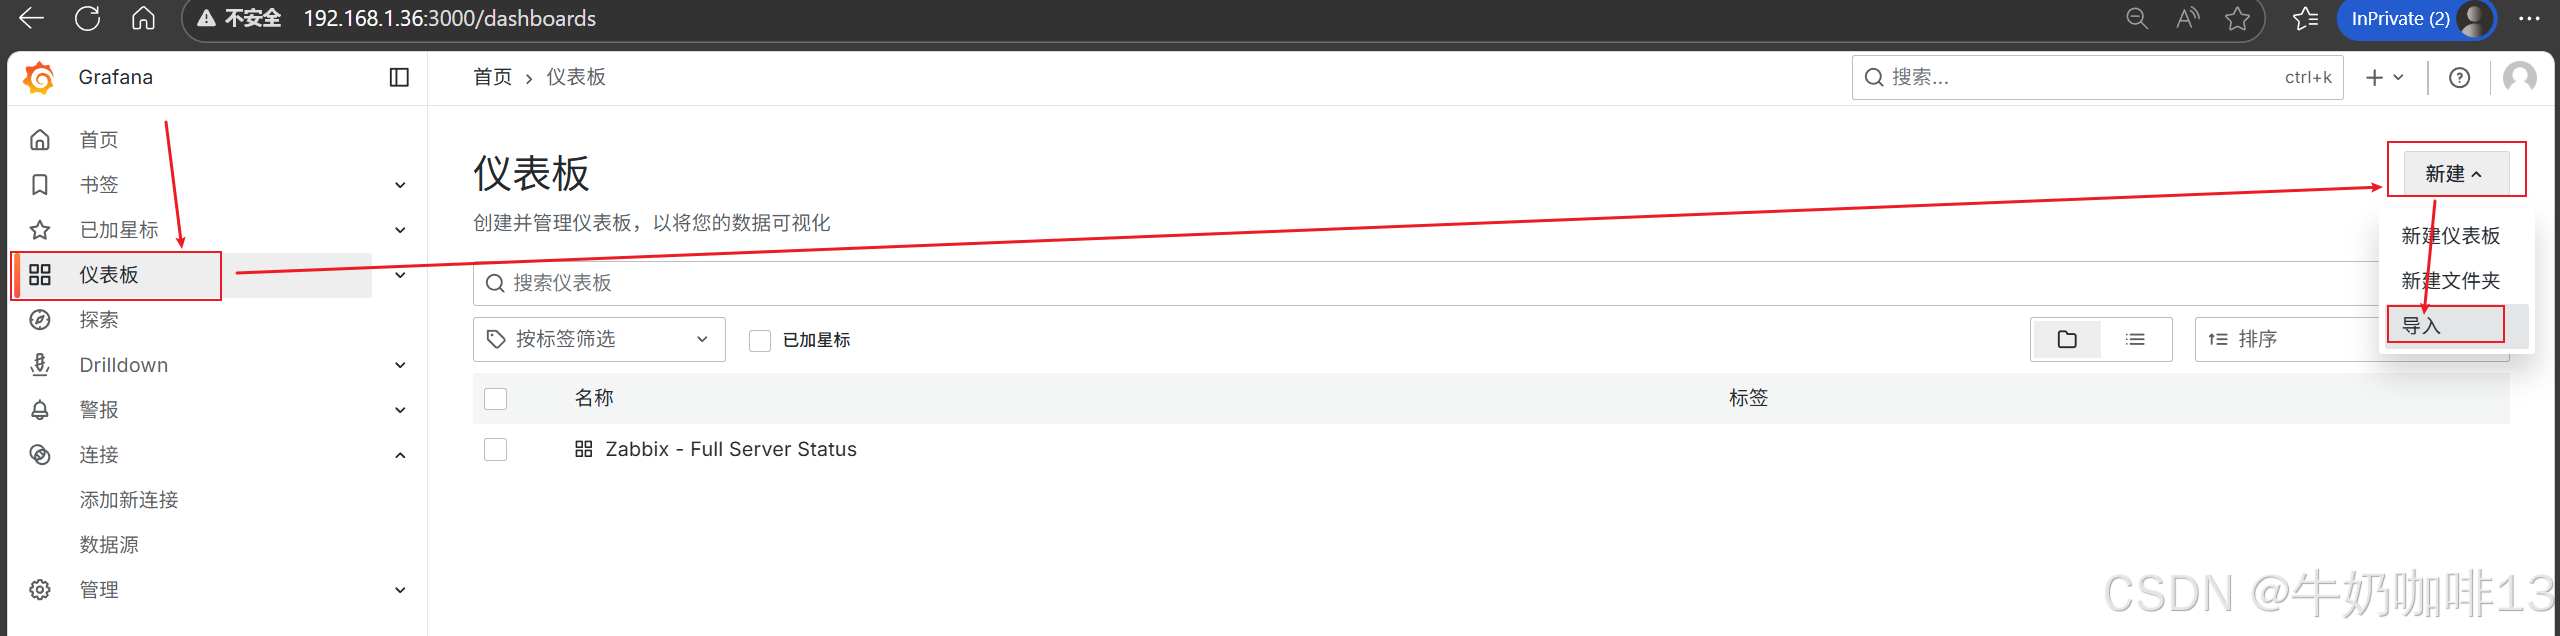
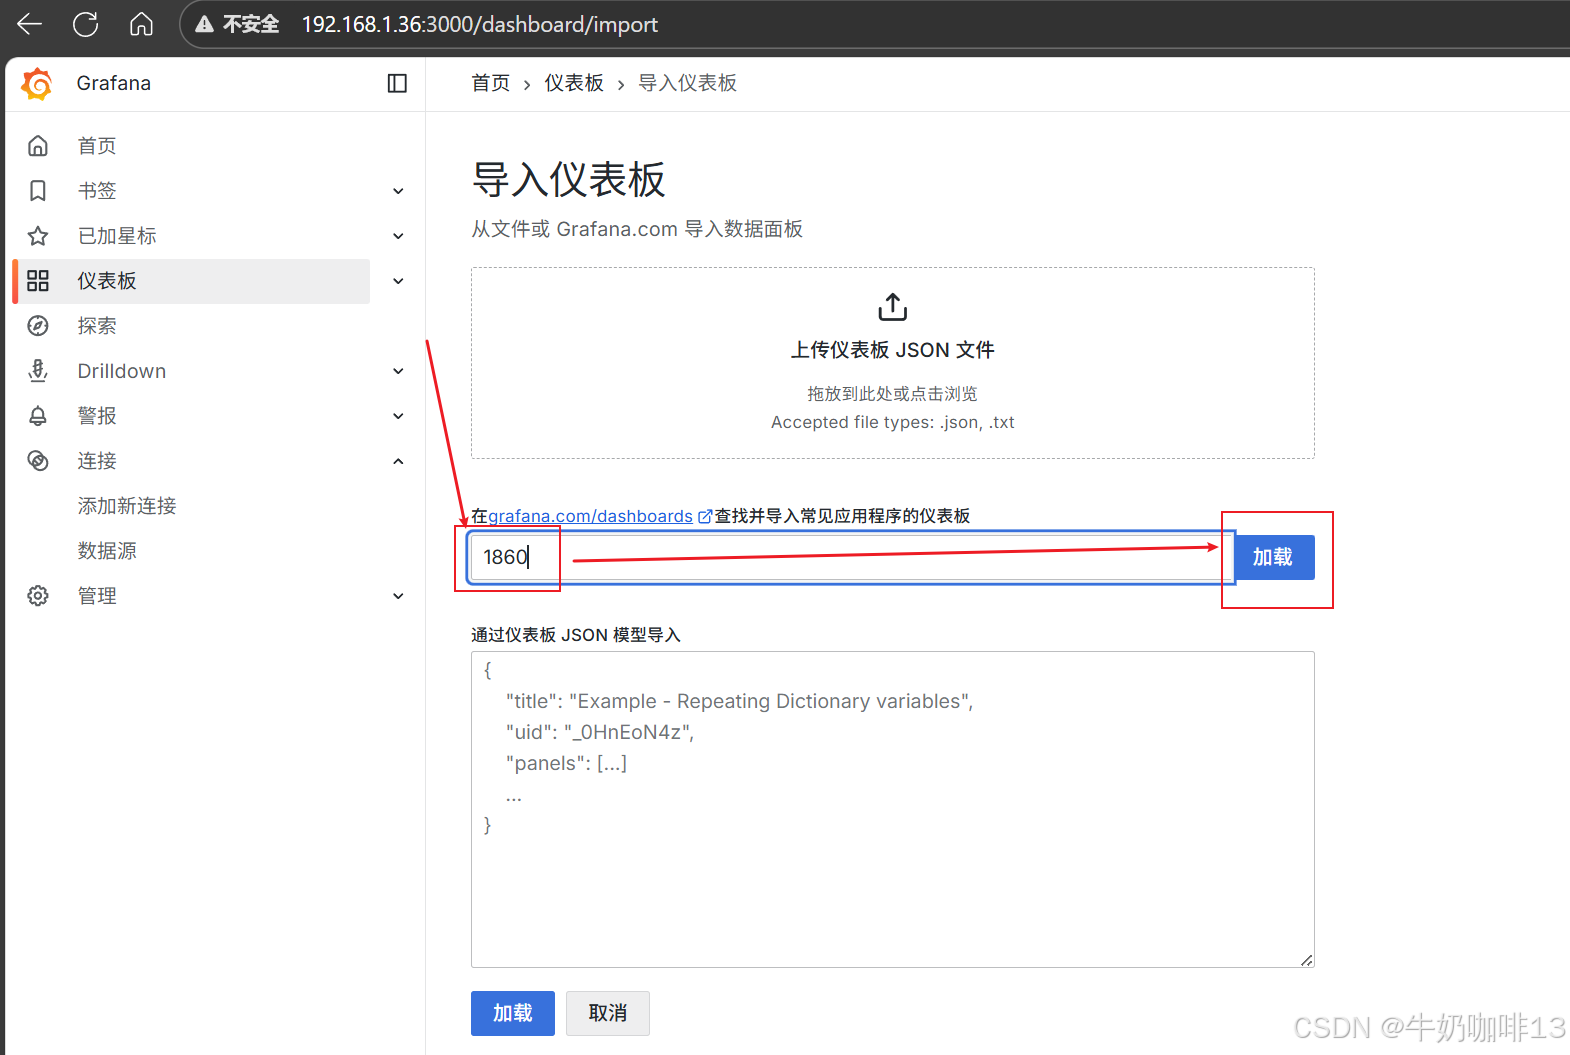
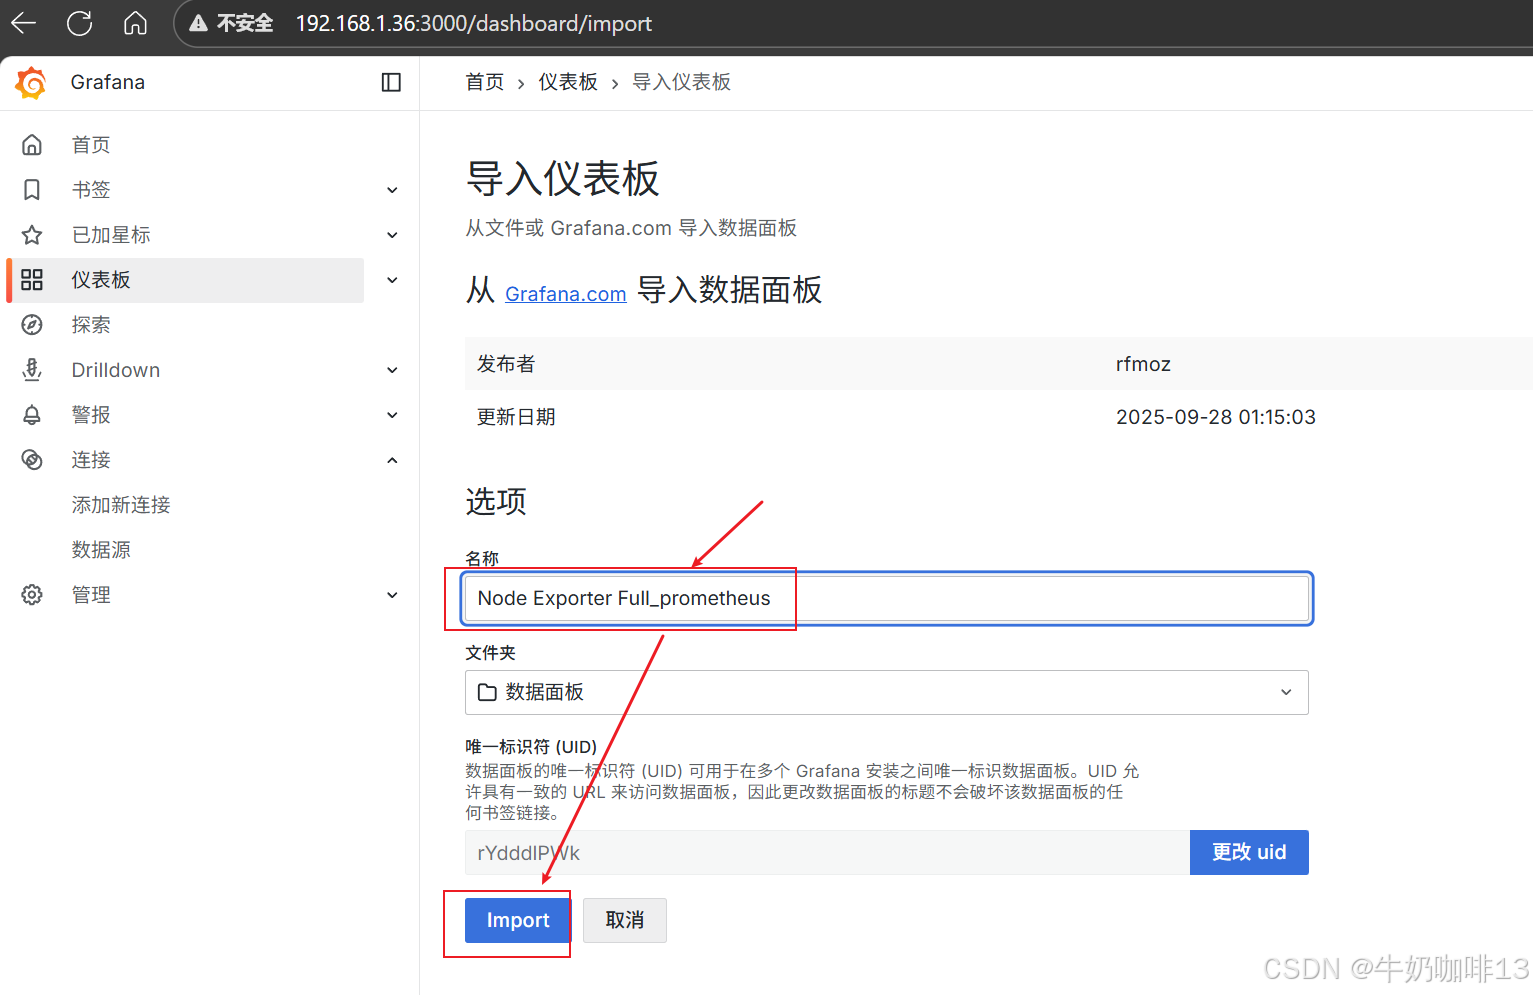
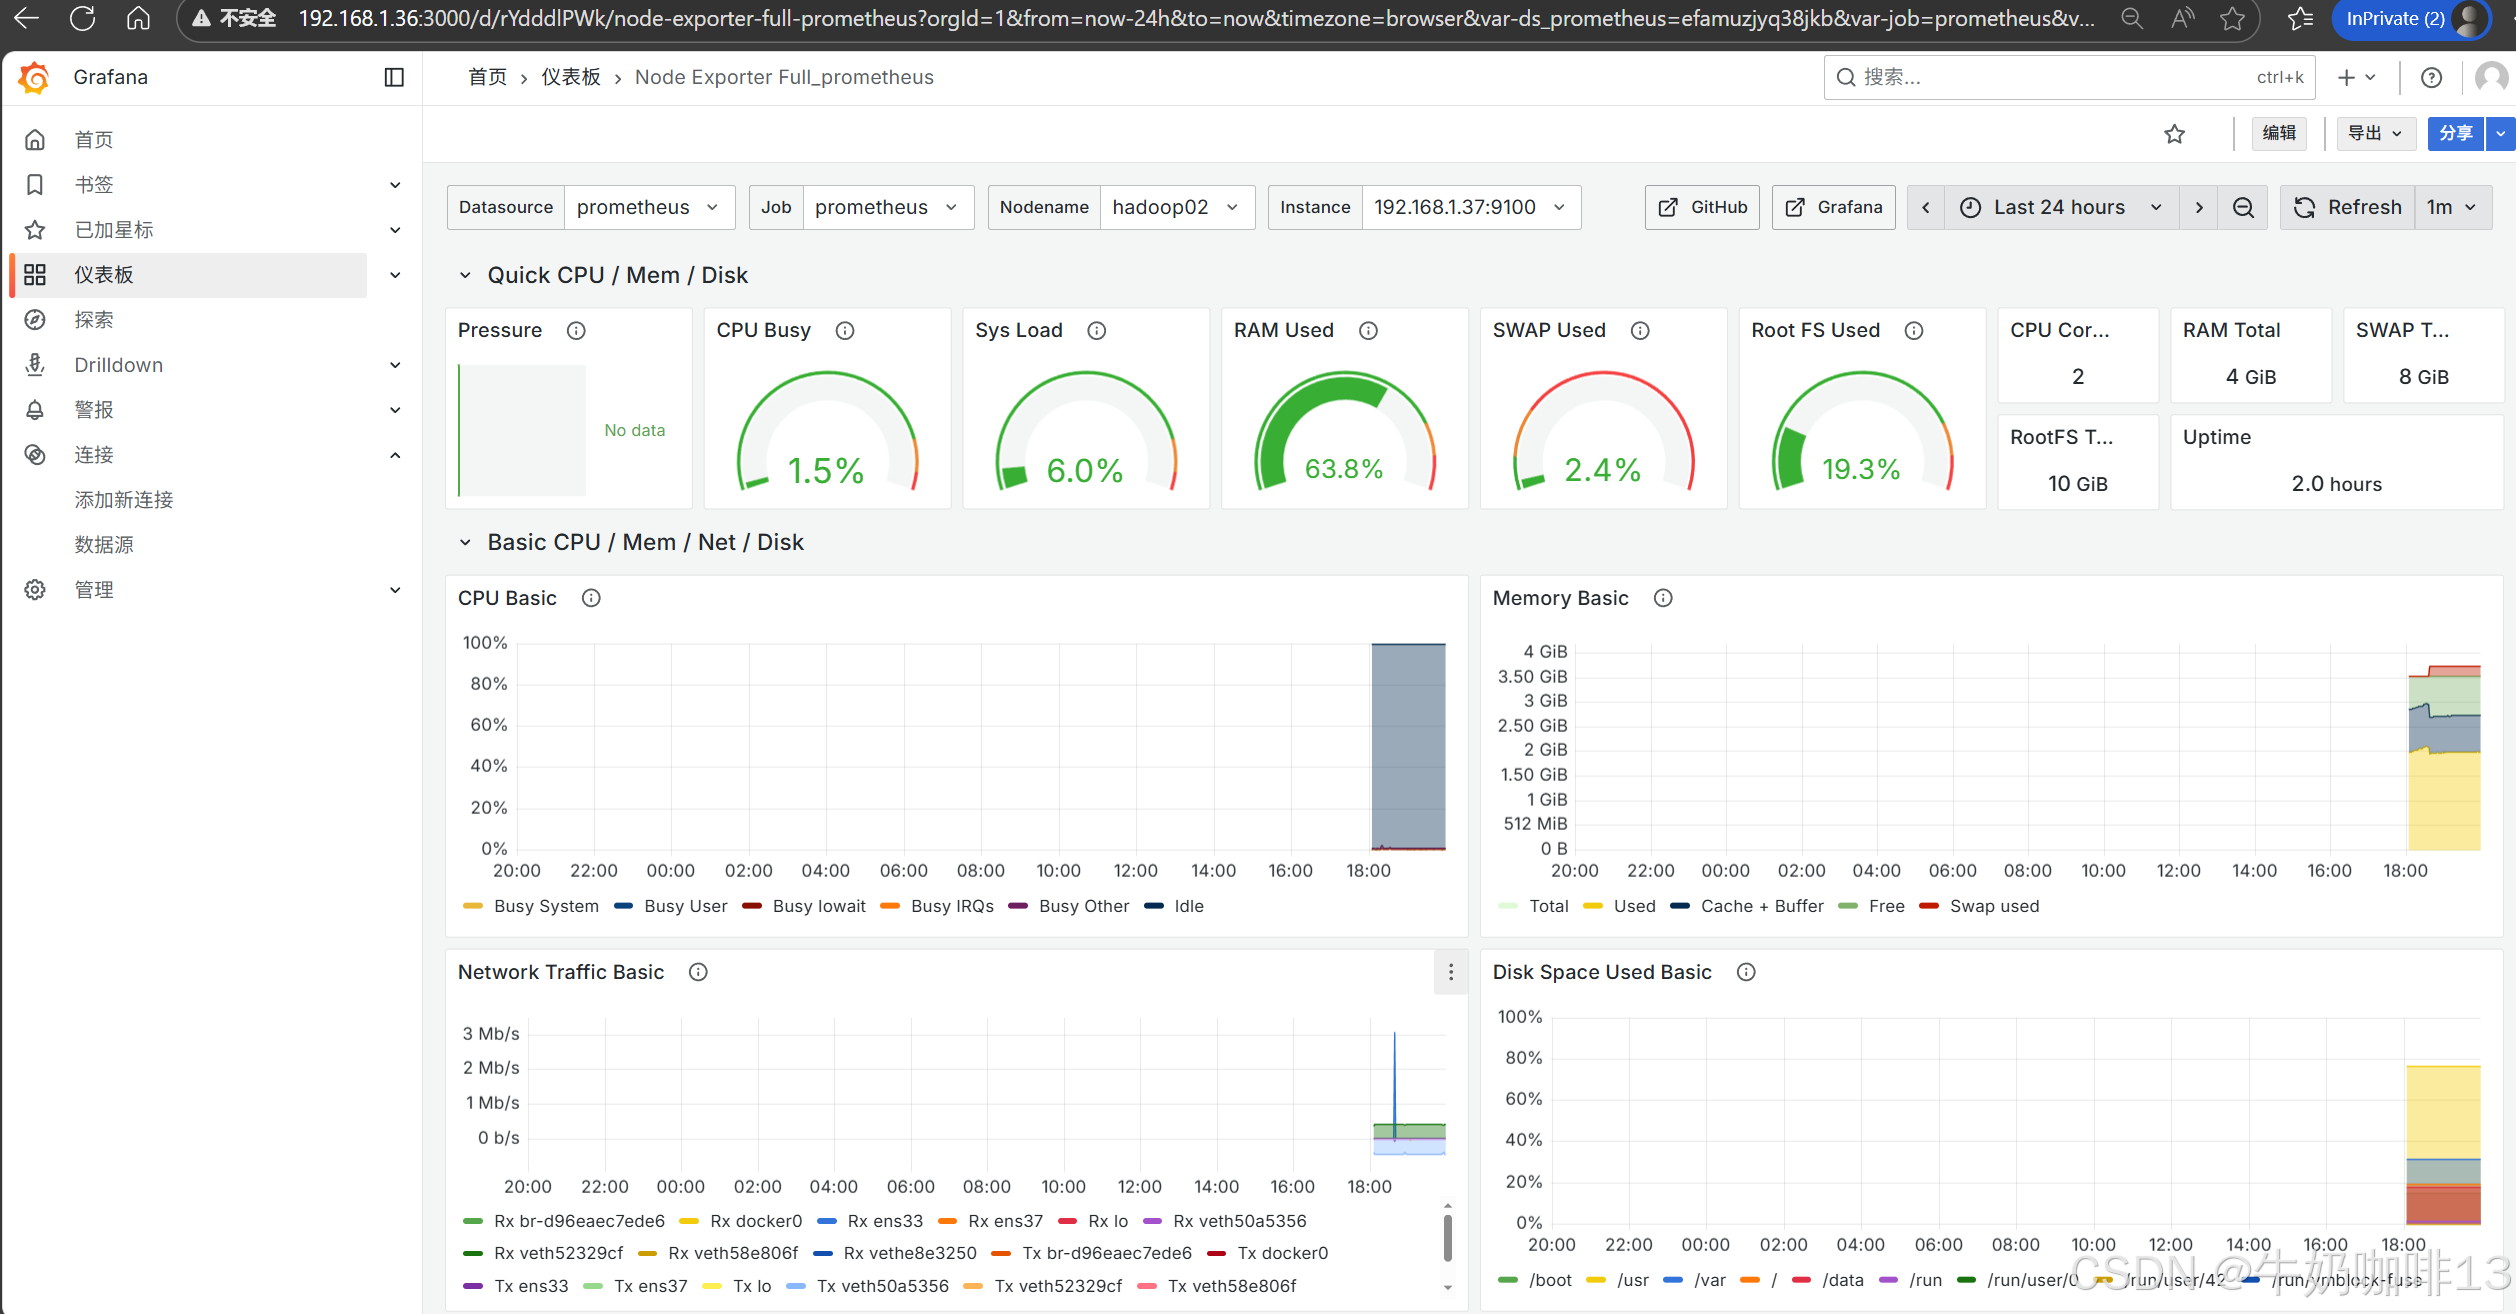
**注意:若对Grafana自带的仪表盘模板不满意,还可以到【Grafana dashboards | Grafana Labs】官网获取更多的仪表盘模板。**在Grafana的仪表盘界面点击左侧的【Data Source】下选择【prometheus】即可列出所有的prometheus模板(如:我们选择【Node Exporter Full】模板进入后,获取到该模板的编号是【1860】)然后在浏览器上进入我们服务器上部署好的Grafana界面的【仪表盘】-->【新建】-->【导入】界面输入模板的编号或者JSON文件内容后点击【加载】后弹出的界面上可以修改模板名称后点击【Import】
三、Prometheus监控mysql数据库
3.1、部署MySQL数据库
全网最全的关系型数据库MySQL解析及其安装部署的保姆级教程![]() https://blog.csdn.net/xiaochenXIHUA/article/details/151891095
https://blog.csdn.net/xiaochenXIHUA/article/details/151891095
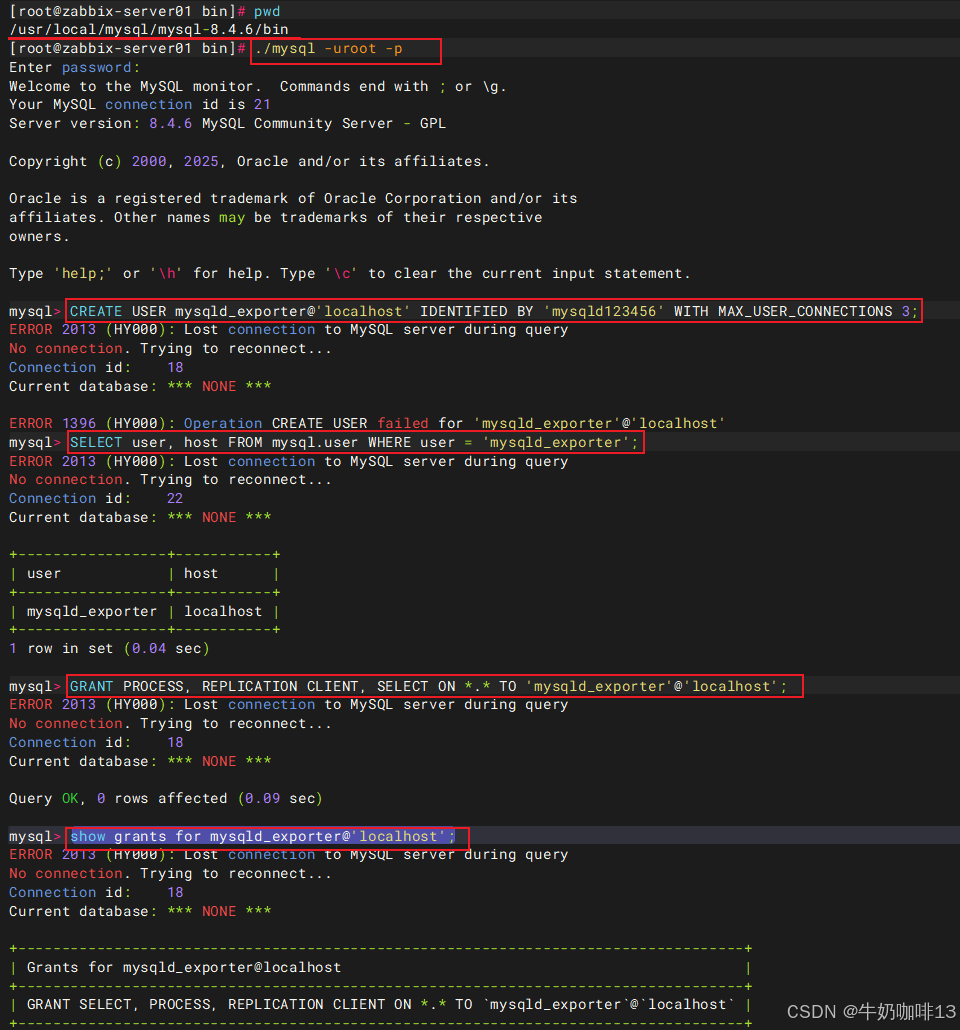
3.2、在数据库上创建监控用户
sql
--登录数据库创建监控用户并授权
cd /usr/local/mysql/mysql-8.4.6/bin

./mysql -uroot -p

CREATE USER mysqld_exporter@'localhost' IDENTIFIED BY 'mysqld123456' WITH MAX_USER_CONNECTIONS 3;

SELECT user, host FROM mysql.user WHERE user = 'mysqld_exporter';

GRANT PROCESS, REPLICATION CLIENT, SELECT ON *.* TO 'mysqld_exporter'@'localhost';

show grants for mysqld_exporter@'localhost';

FLUSH PRIVILEGES;
Mysql或MariaDB数据库的用户与授权操作------实操保姆级教程
3.3、安装部署mysql_exporter监控程序
一般是将mysql_exporter监控程序安装在mysql服务器上,但是也可以将这个监控程序部署到其他服务器上,但是要能够访问mysql数据库。
bash
#下载安装部署mysqld_exporter监控程序
#1-下载mysqld_exporter监控程序
wget https://github.com/prometheus/mysqld_exporter/releases/download/v0.18.0/mysqld_exporter-0.18.0.linux-amd64.tar.gz -c -P /data
#2-解压mysqld_exporter并进入
cd /data
tar -zxvf mysqld_exporter-0.18.0.linux-amd64.tar.gz -C /usr/local/
cd /usr/local
mv mysqld_exporter-0.18.0.linux-amd64 mysqld_exporter-0.18.0
cd mysqld_exporter-0.18.0/
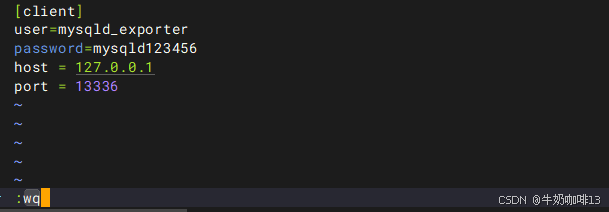
#3-在解压好的mysqld_exporter目录下创建监控mysql的配置文件
vi .my.cnf
#【.my.cnf】文件的完整内容(用户名与密码需要与mysql创建的监控用户内容一致;若mysqld_exporter与mysql不在同一台设备上,则host需要修改为mysql服务器的IP地址)
[client]
user=mysqld_exporter
password=mysqld123456
host = 127.0.0.1
port = 13336
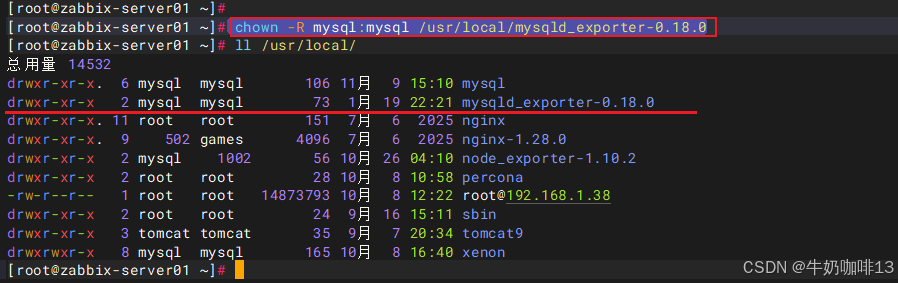
#4-授权mysqld_exporter权限为mysql用户
chown -R mysql:mysql /usr/local/mysqld_exporter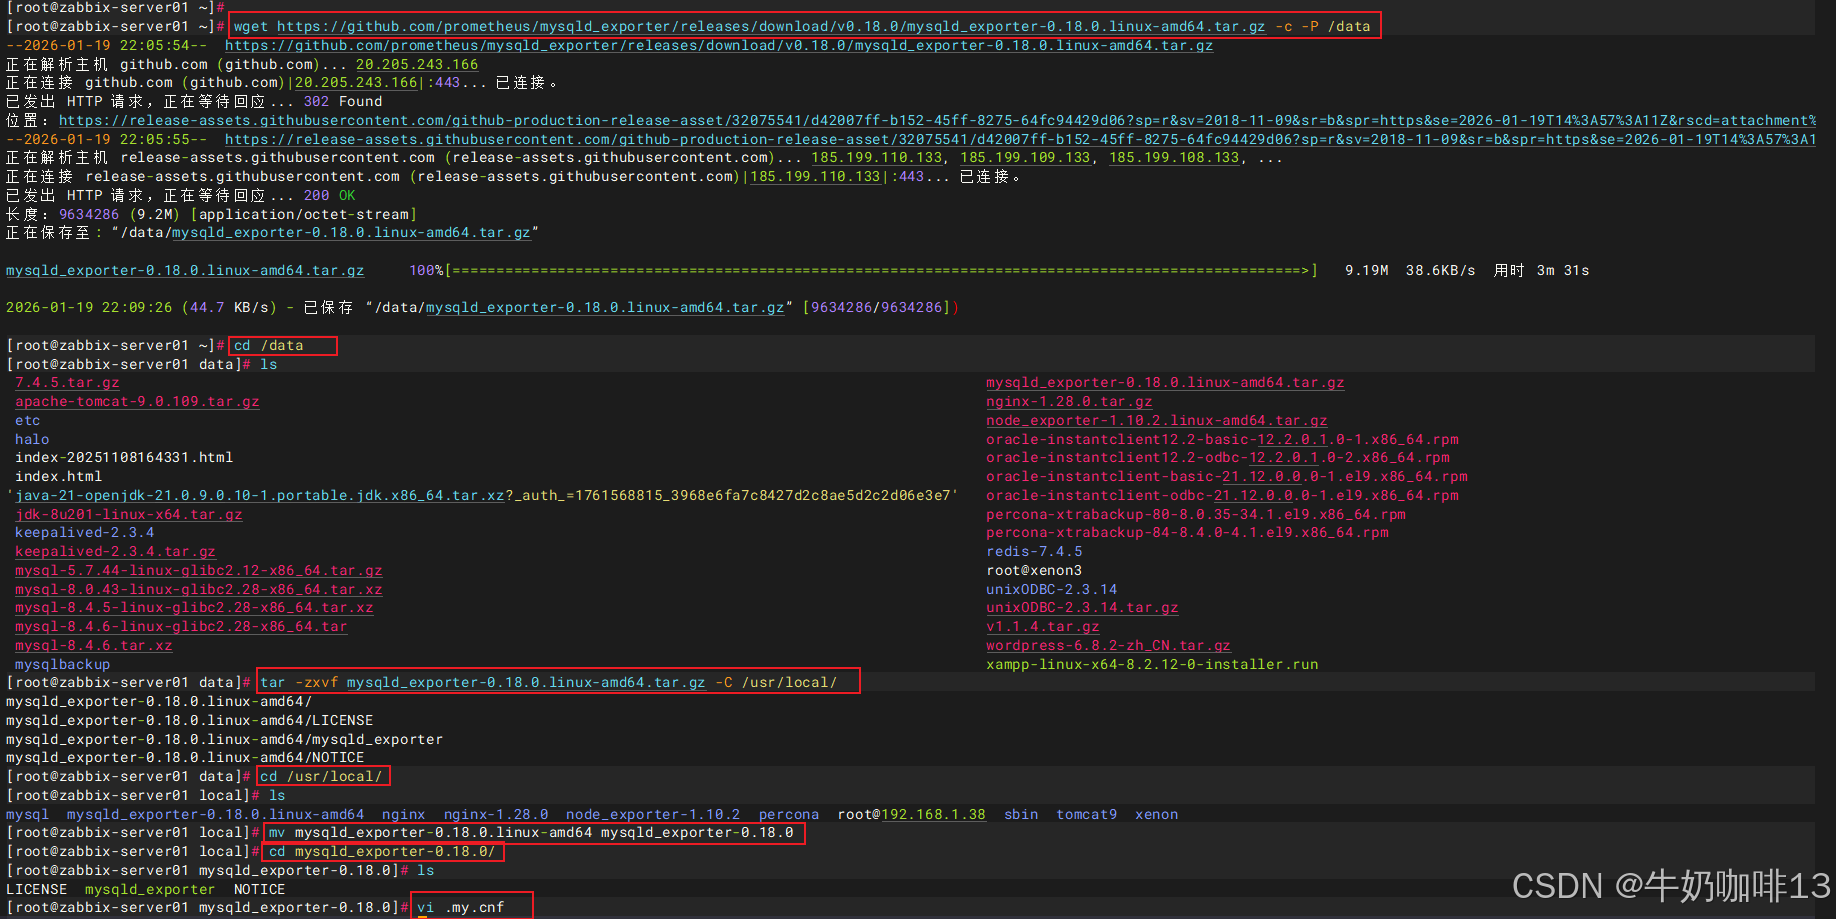
3.4、编写启动mysqld_exporter服务脚本
bash
#编写启动mysqld_exporter服务脚本
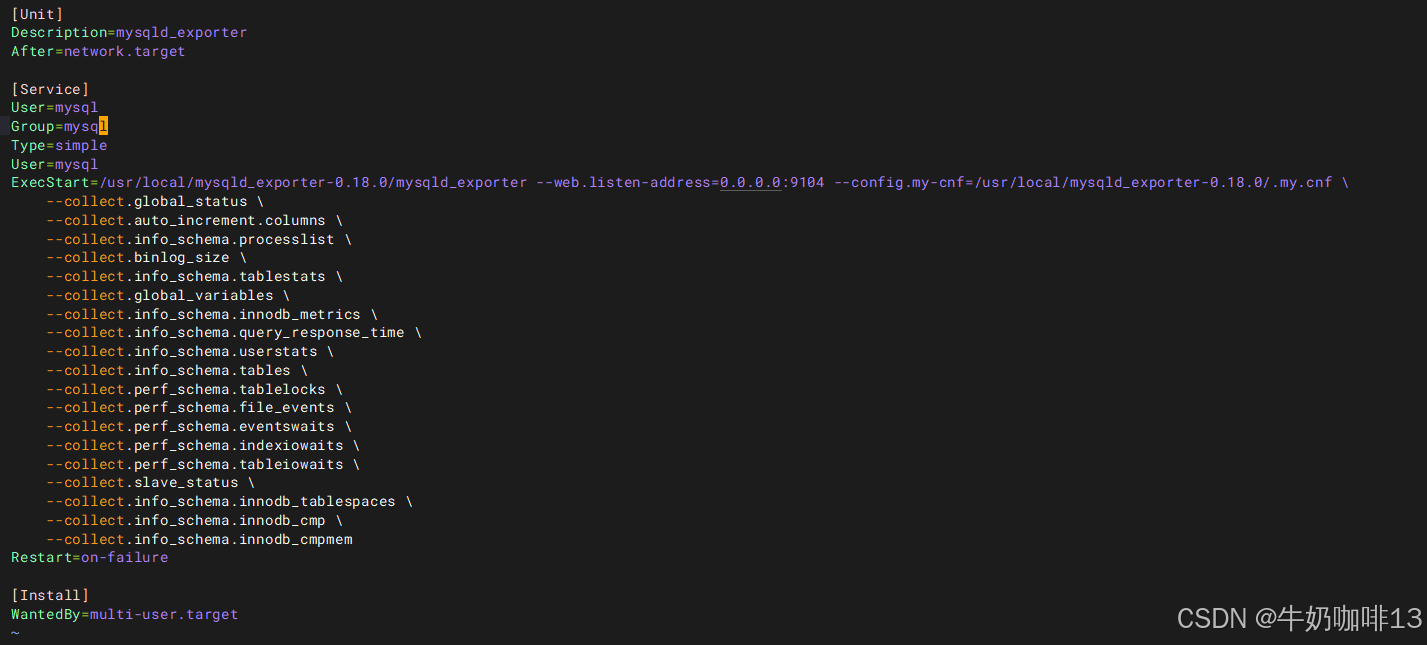
vim /usr/lib/systemd/system/mysqld_exporter.service
#【/usr/lib/systemd/system/mysqld_exporter.service】文件的完整内容
[Unit]
Description=mysqld_exporter
After=network.target
[Service]
User=mysql
Group=mysql
Type=simple
User=mysql
ExecStart=/usr/local/mysqld_exporter-0.18.0/mysqld_exporter --web.listen-address=0.0.0.0:9104 --config.my-cnf=/usr/local/mysqld_exporter-0.18.0/.my.cnf \
--collect.global_status \
--collect.auto_increment.columns \
--collect.info_schema.processlist \
--collect.binlog_size \
--collect.info_schema.tablestats \
--collect.global_variables \
--collect.info_schema.innodb_metrics \
--collect.info_schema.query_response_time \
--collect.info_schema.userstats \
--collect.info_schema.tables \
--collect.perf_schema.tablelocks \
--collect.perf_schema.file_events \
--collect.perf_schema.eventswaits \
--collect.perf_schema.indexiowaits \
--collect.perf_schema.tableiowaits \
--collect.slave_status \
--collect.info_schema.innodb_tablespaces \
--collect.info_schema.innodb_cmp \
--collect.info_schema.innodb_cmpmem
Restart=on-failure
[Install]
WantedBy=multi-user.target
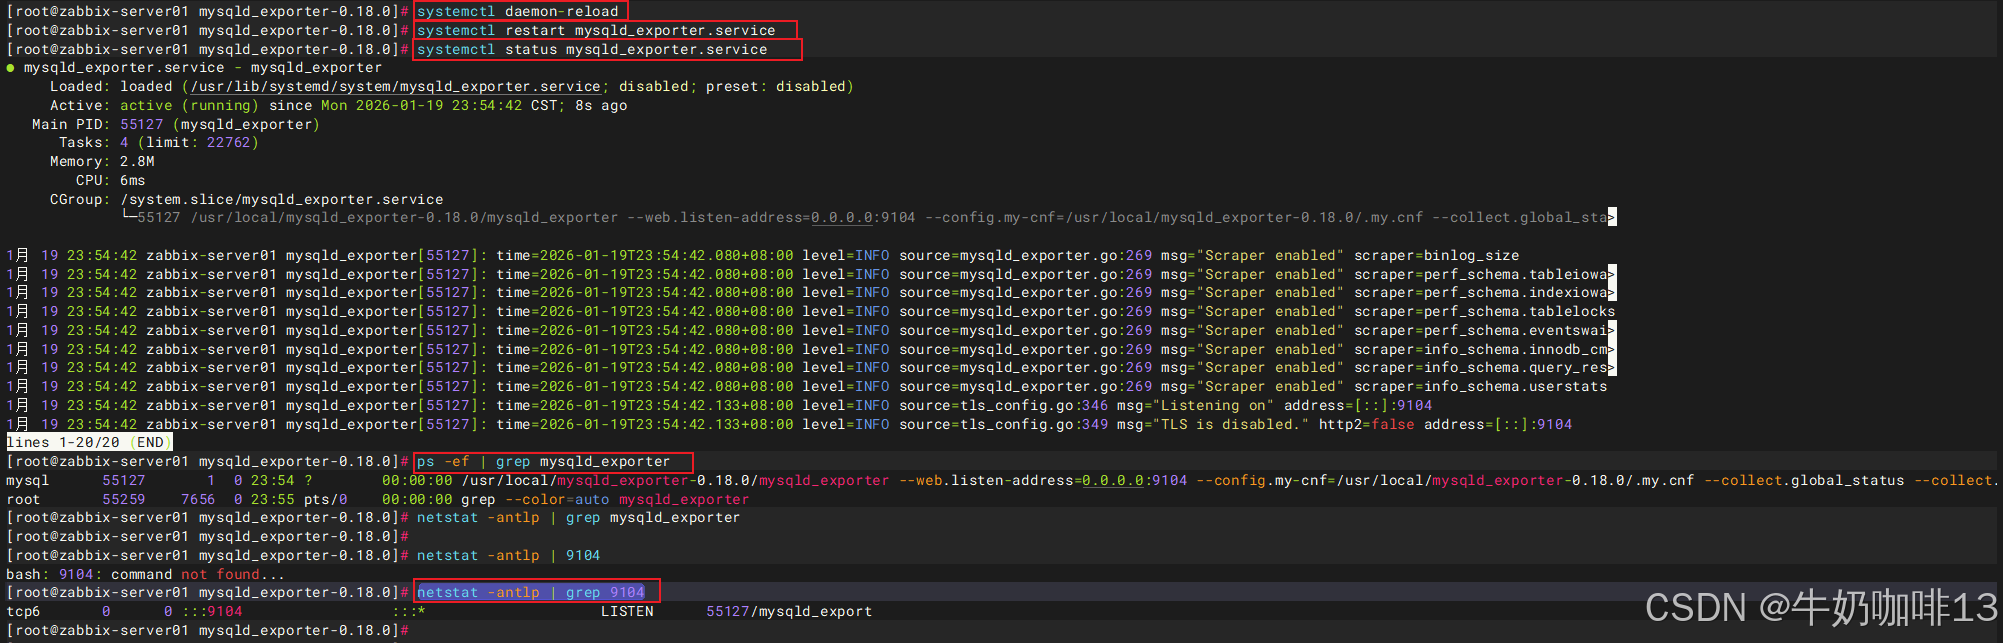
#启动mysqld_exporter服务
systemctl daemon-reload
systemctl start mysqld_exporter
systemctl status mysqld_exporter
ps -ef | grep mysqld_exporter
netstat -antlp | grep 9104
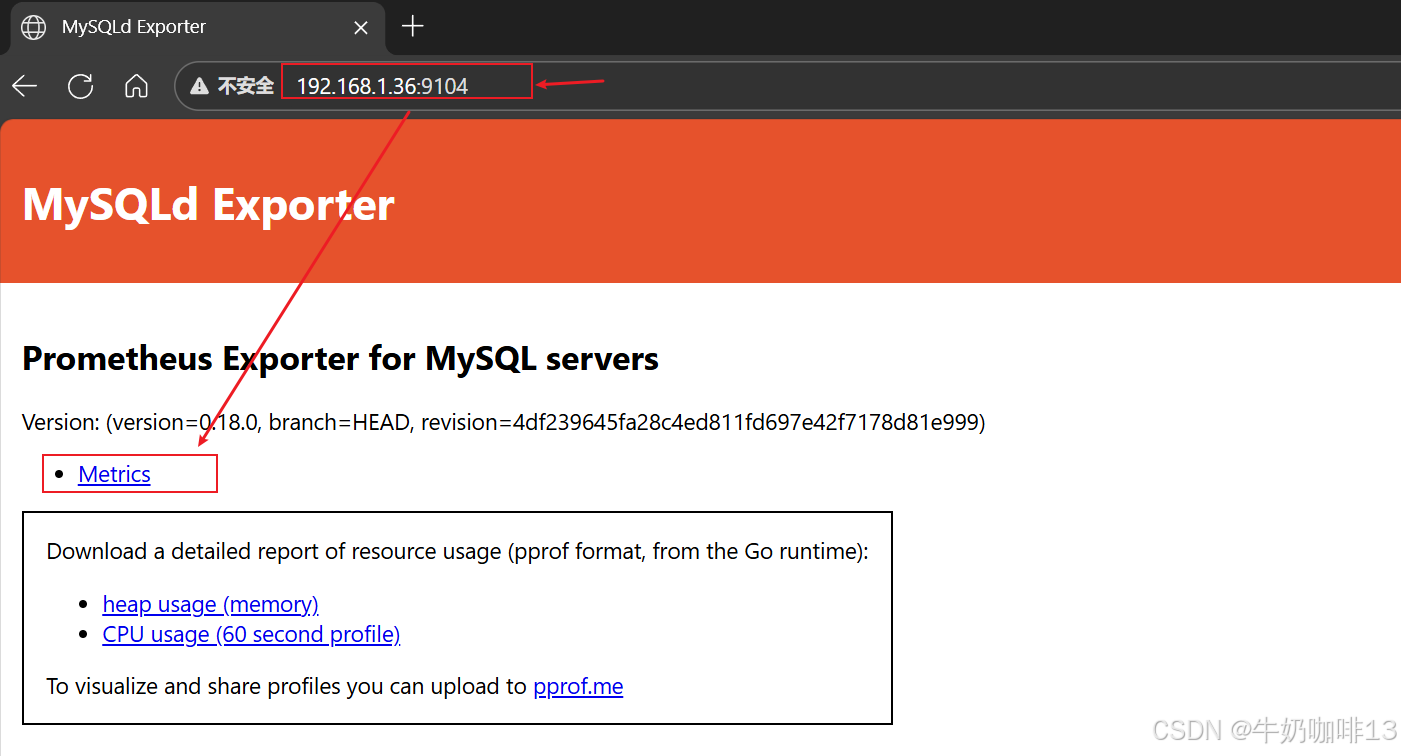
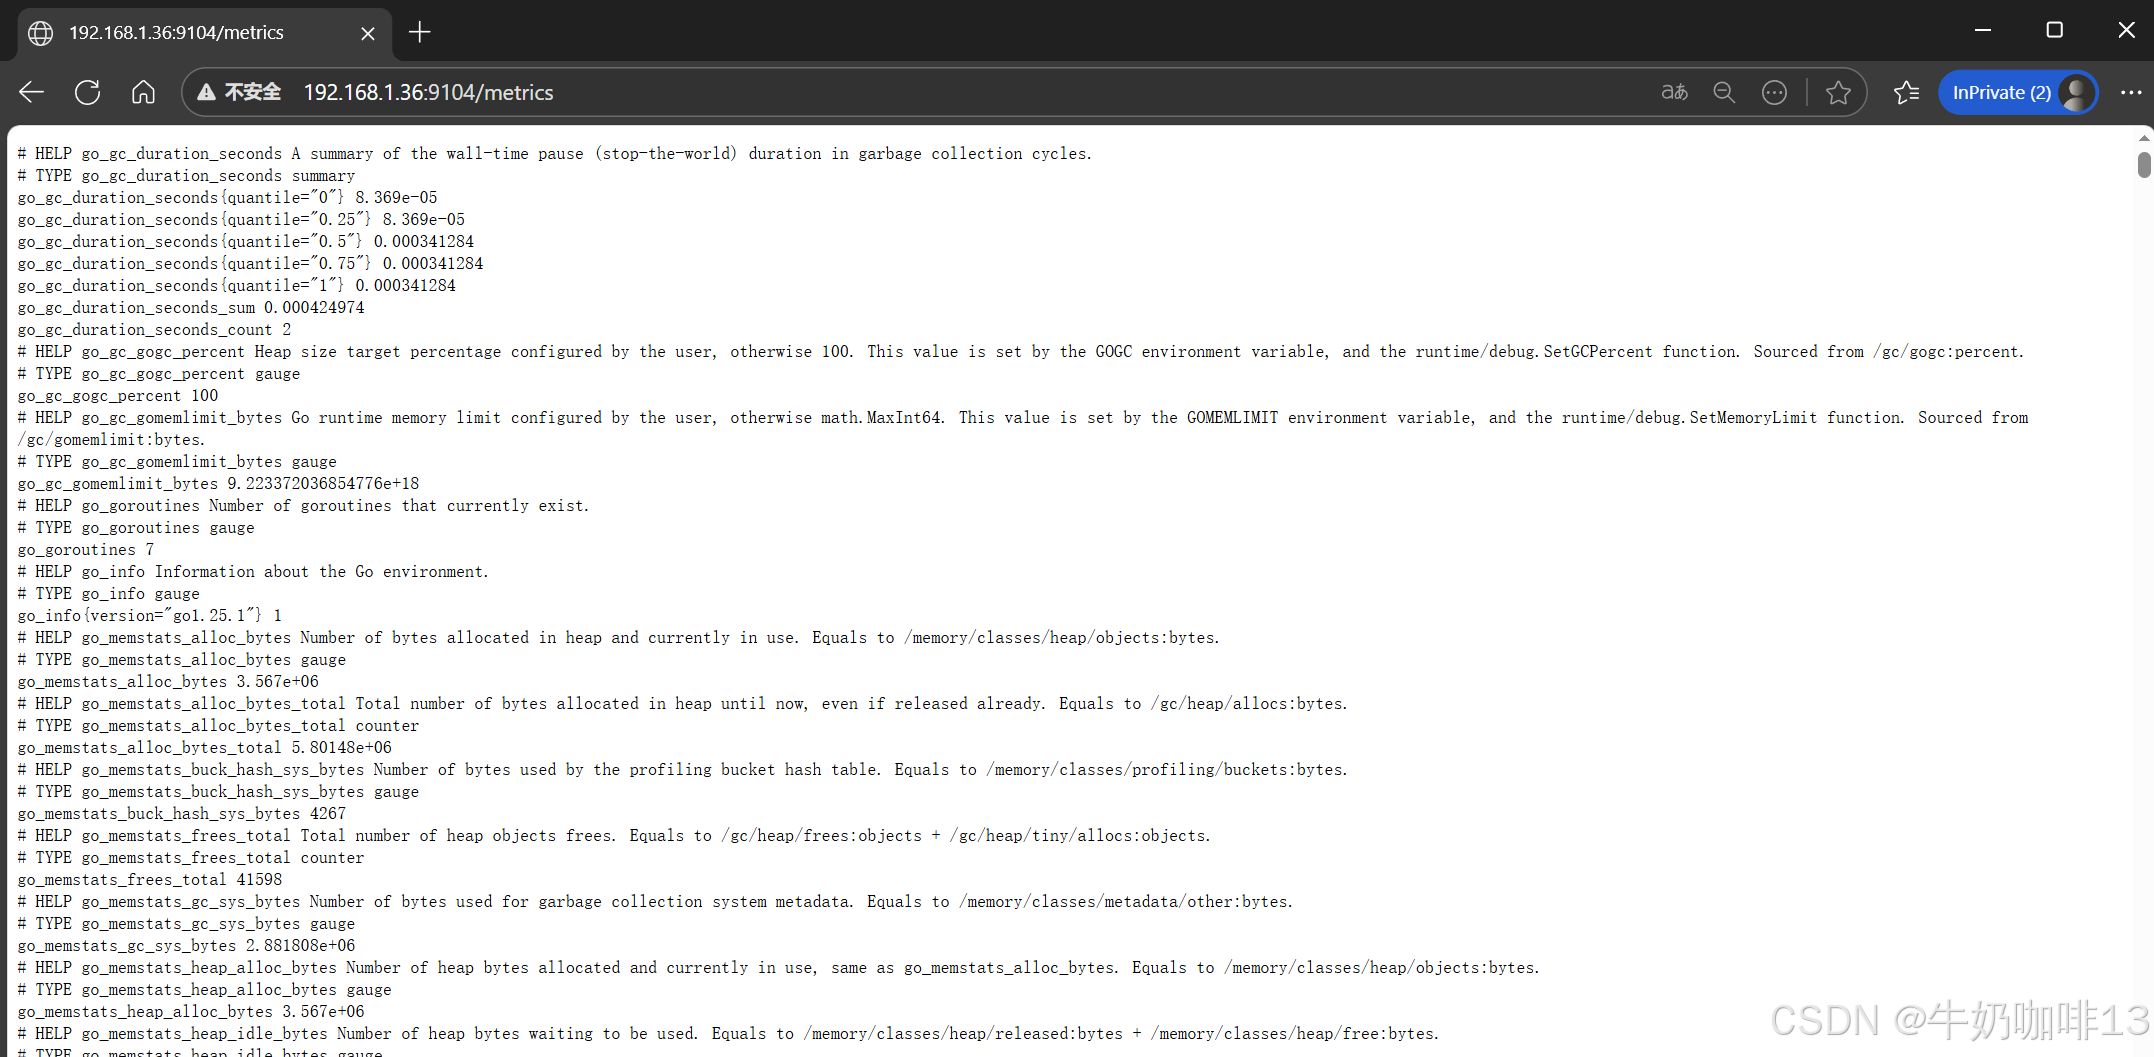
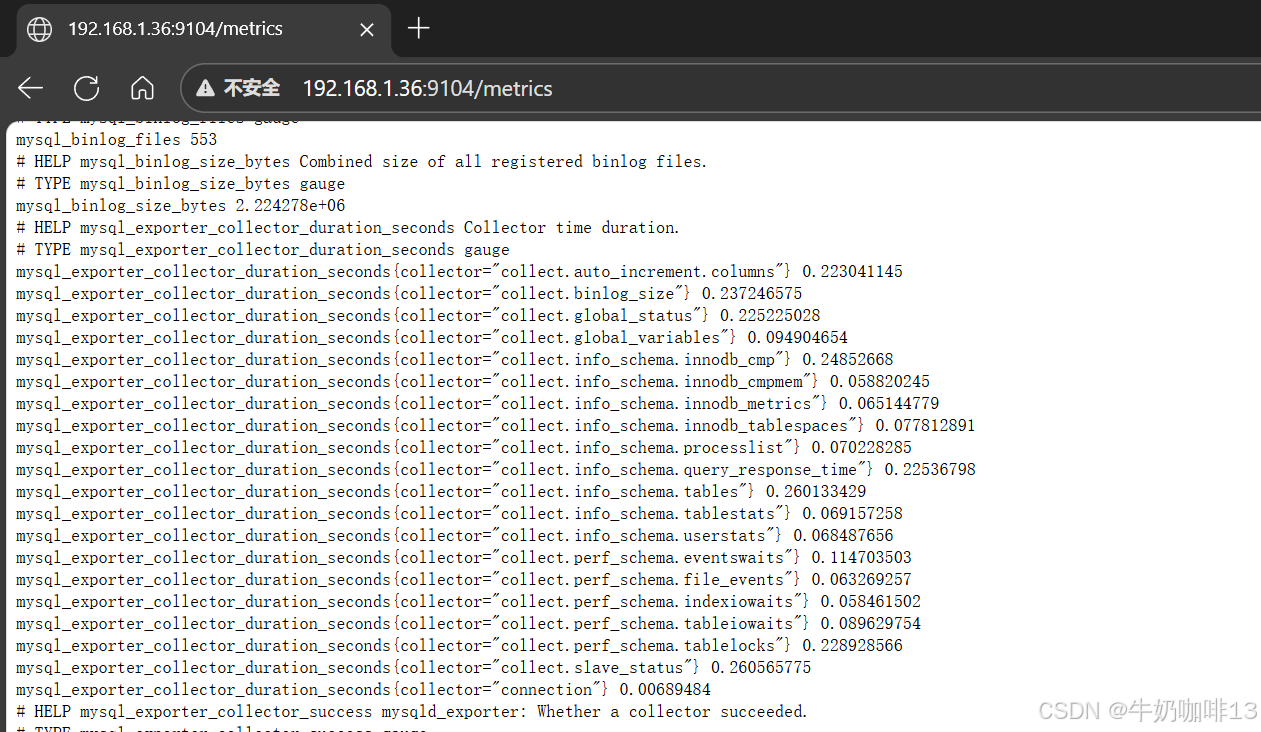
#最后通过【本机IP:9104】在浏览器即可访问到mysqld_exporter收集到的mysql状态数据。
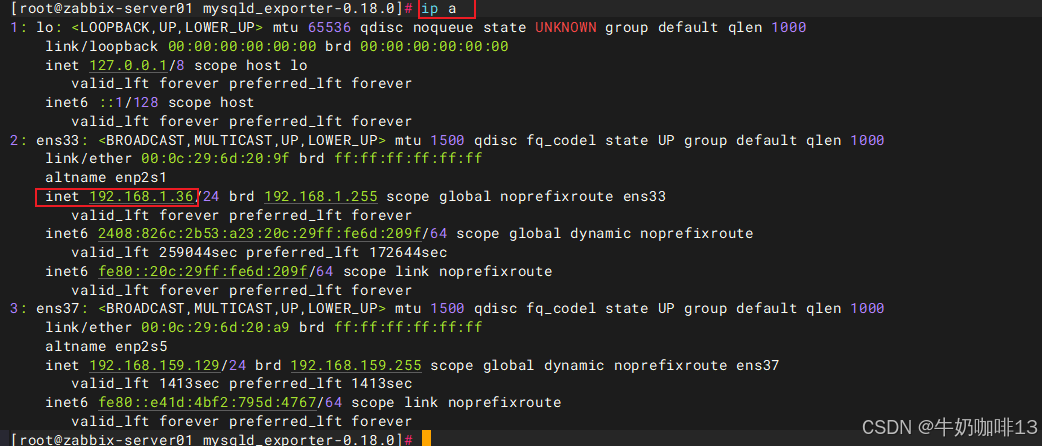
ip a
#注意2:若是启动node_exporter报错,则需要【查看系统日志中node_exporter相关的错误信息】后解决
journalctl -u node_exporter -f|--------|--------------------------|----------------------|
| 序号 | mysqld_exporter重要参数 | 说明 |
| 1 | --config.my-cnf | 指定export连接数据库配置文件的路径 |
| 2 | --web.listen-address | 指定监听的地址,端口 |
| 3 | --log.level | 指定日志级别 |
| 4 | --collect.* | 表示启用对应模块指标收集 |
[mysqld_exporter服务的重要参数解析]
3.5、在Prometheus Server上配置该mysqld_exporter节点
bash
#在Prometheus Server添加该Node_Exporter节点
cd /usr/local/prometheus-3.5.0/
vi prometheus.yml
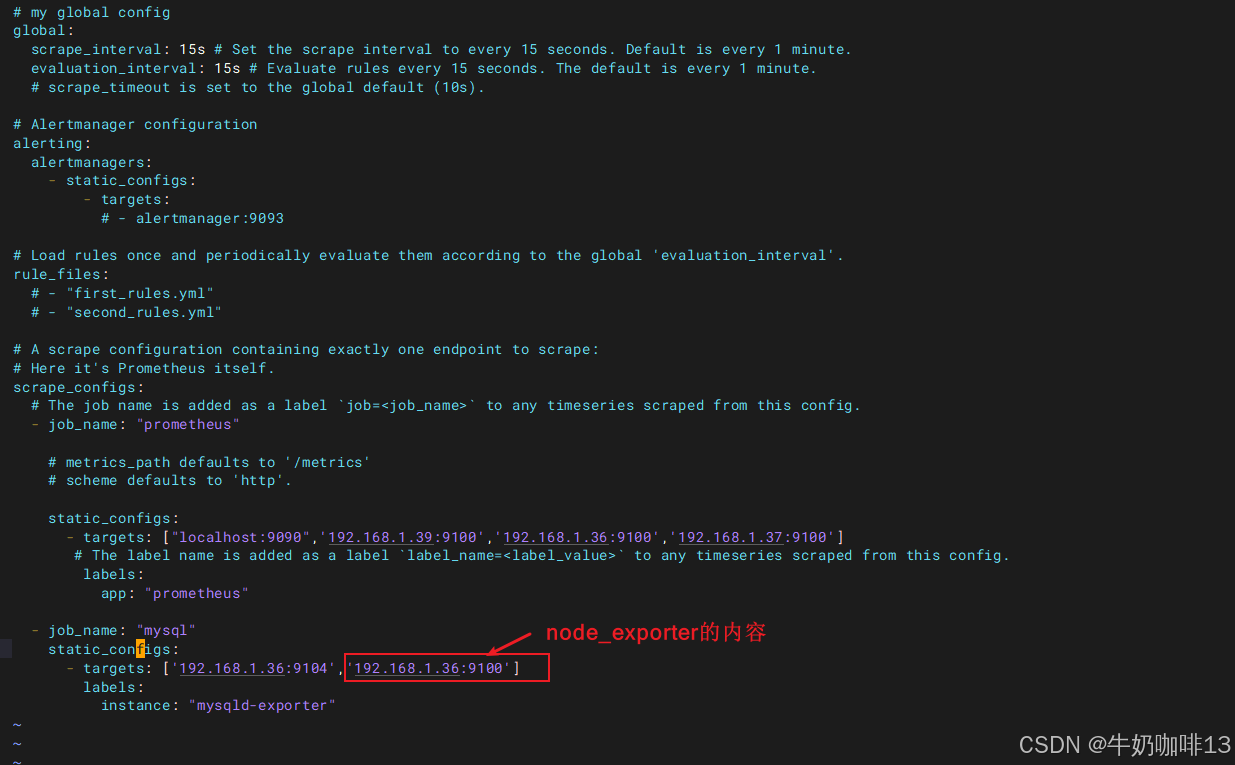
#【prometheus.yml】文件最后的【scrape_configs】节点下新增【job_name-->static_configs-->targets(192.168.1.36:9104)】
scrape_configs:
# The job name is added as a label `job=<job_name>` to any timeseries scraped from this config.
- job_name: "prometheus"
# metrics_path defaults to '/metrics'
# scheme defaults to 'http'.
static_configs:
- targets: ["localhost:9090",'192.168.1.39:9100','192.168.1.36:9100','192.168.1.37:9100']
# The label name is added as a label `label_name=<label_value>` to any timeseries scraped from this config.
labels:
app: "prometheus"
- job_name: "mysql"
static_configs:
- targets: ['192.168.1.36:9104']
labels:
instance: "mysqld-exporter"
#验证修改的prometheus.yml文件配置是否正确并让配置生效
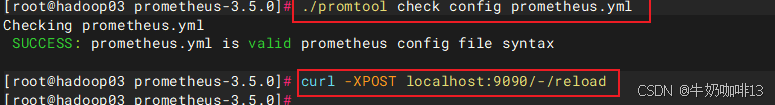
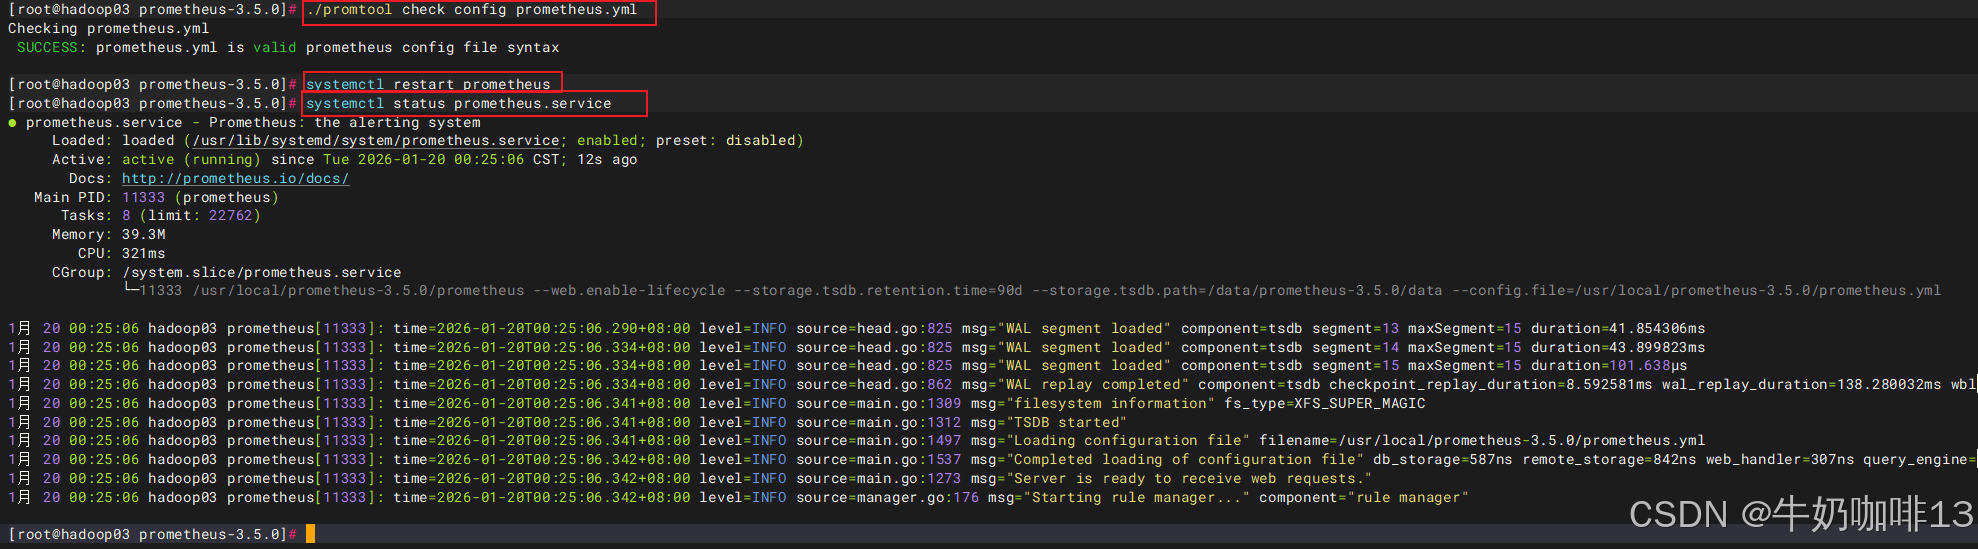
./promtool check config prometheus.yml
#直接使用热启动让prometheus server的配置生效
curl -XPOST localhost:9090/-/reload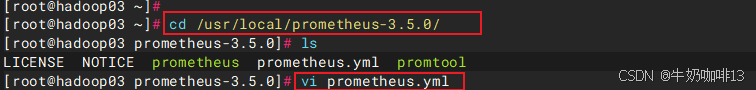
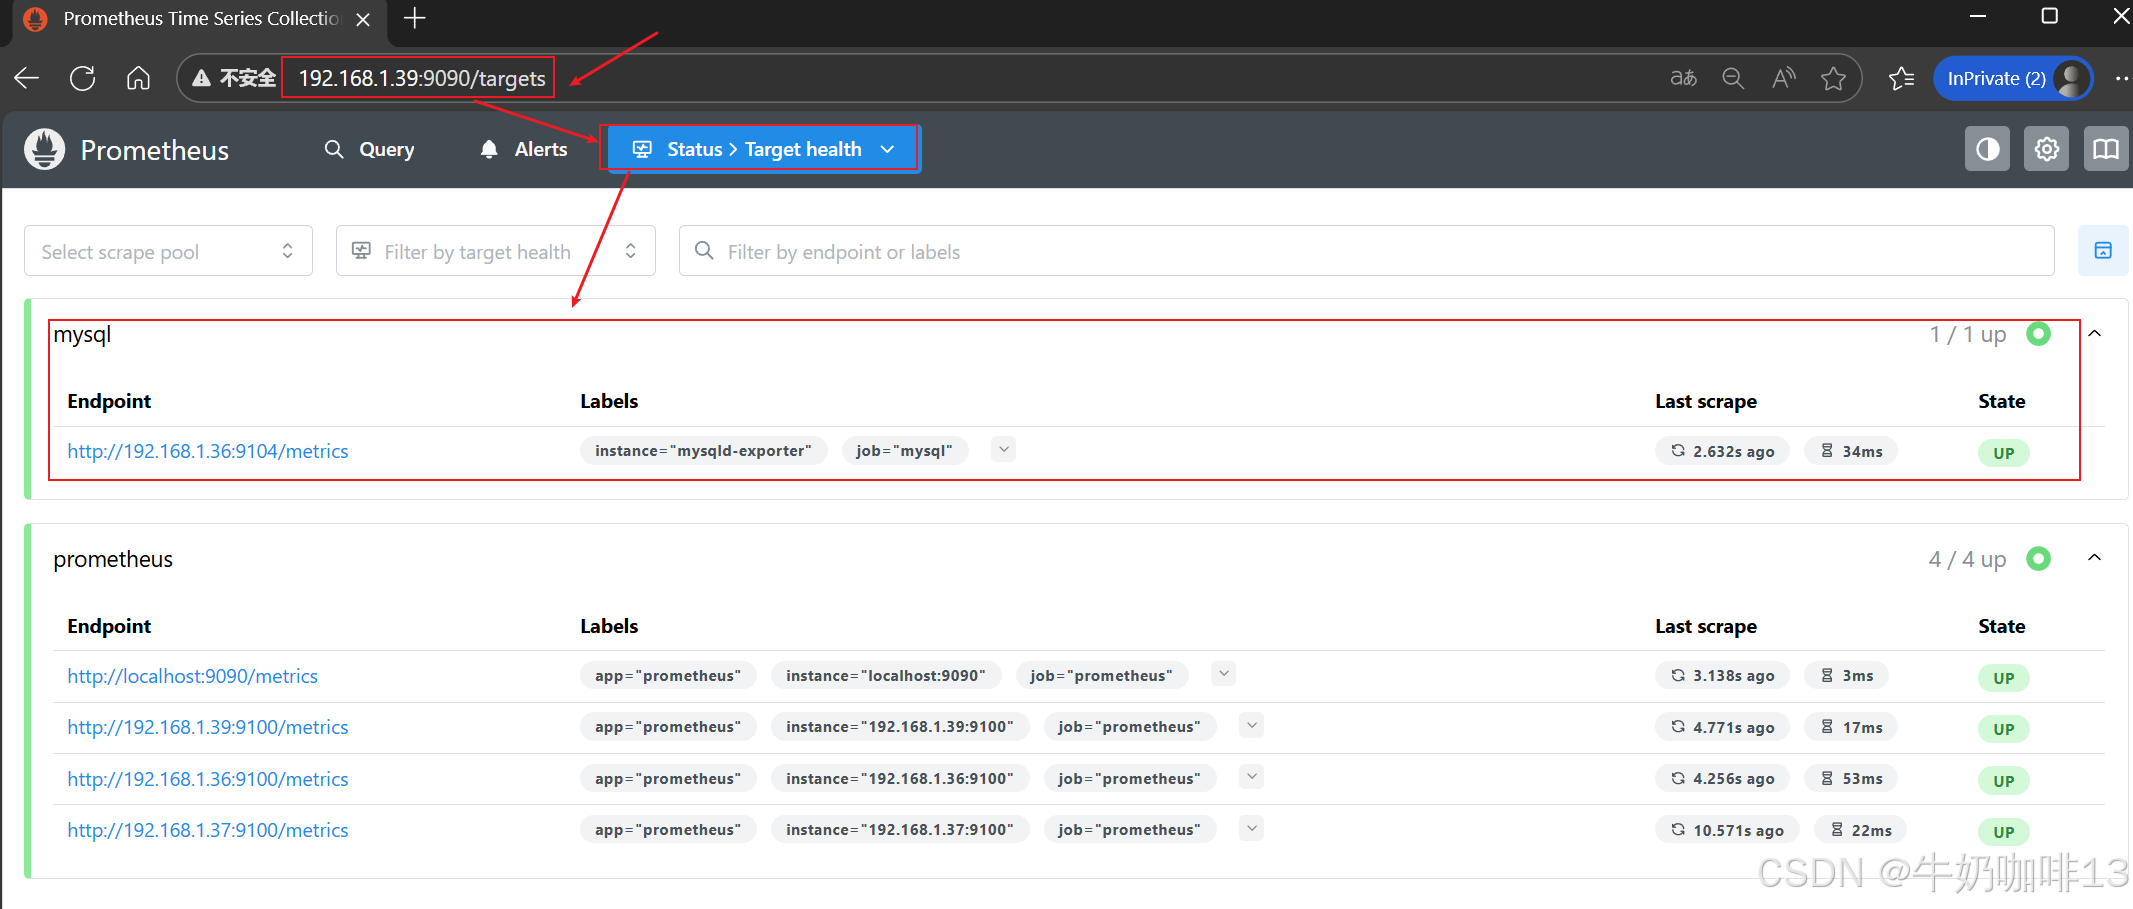
然后打开浏览器进入Prometheus Server的Web界面【IP:9090】查看【Status-->Target health】即可看到添加的node_exporter节点及其状态【up】表示在线【down】表示离线。如下图所示:
3.6、监控mysql的几个重要指标
|--------|------------------|-------------------------------------------------------------------------------------------------------------------------------------------------------------------------------------------------------------------------------------------------------------------------------------------------------------------------------------------------------------------------------------------------------------------------------------------------------------------------------------------------------------------------------------------------------------------------------------|
| 序号 | 监控mysql的重要指标 | 说明 |
| 1 | 延迟监控 | 主要是慢查询,关注慢查询数量。 bash #其中mysql要永久开启慢查询的操作则需要在mysql程序的配置文件【my.cnf】添加如下配置 #慢查询 #查询执行时间的阈值(单位是秒)。当查询的执行时间超过这个阈值时,MySQL将会将该查询记录到慢查询日志中 long_query_time=3 #启动慢查询1表示开启,0表示关闭 slow_query_log=1 slow_query_log_file=/usr/local/mysql/mysql-8.4.6/logs/mysql-slow.log #错误日志存放位置 log-error=/usr/local/mysql/mysql-8.4.6/logs/mysqld-error.log sql --1-在mysql数据库中查看慢查询是否开启命令,且慢查询命令记录的位置 show variables like 'slow_query%'; --2-在mysql数据库中查看慢查询的默认时间(即:查询超过这个设置时间的即为慢查询) show variables like 'long_query_time'; --3-在mysql数据库中查询慢查询语句数量命令 show global status like 'show_queries'; |
| 2 | 流量 | 统计 SELECT、UPDATE、DELETE、INSERT 等语句执行的数量。 sql --统计SELECT、UPDATE、DELETE、INSERT 等语句执行的数量命令 show global status where Variable_name regexp 'Com_insert|Com_update|Com_delete|Com_select|Questions|Queries'; |
| 3 | 错误 | 错误量这类指标有多个应用场景,比如客户端连接 MySQL 失败了,或者语句发给MySQL,执行的时候失败了,都需要有失败计数。另外就是最大连接数的监控。 sql --查询mysql的默认最大连接数sql语句(若太小则可以设置) show variables like 'max_connections'; --临时设置mysql的最大连接数sql语句(如:设置为2048)若想持久化设置则需要在mysql的配置文件设置 set global max_connections=1024; --查看超过最大连接数的错误数量与终止连接错误数量sql语句 show global status where variable_name regexp 'connection_errors_max_connections|Aborted_connects'; |
[监控mysql的几个重要指标]
bash
#更详细的my.cnf配置文件内容如下【这个配置内容可以根据自己的项目实际需要自行选择配置】:
[mysqld]
bind-address=0.0.0.0
#端口号
port=3336
#用户
user=mysql

#默认存储引擎
default-storage-engine=INNODB

#默认字符集编码
character-set-server=utf8mb4
collation-server=utf8mb4_general_ci

#mysql程序路径
basedir=/usr/local/mysql/mysql-8.4.6
#mysql数据路径
datadir=/usr/local/mysql/mysql-8.4.6/data
socket=/tmp/mysql.sock
#进程文件
pid-file=/usr/local/mysql/mysql-8.4.6/logs/mysqld.pid

#设置最大连接数(根据服务器资源调整,建议不超过 2000,避免内存耗尽)
max_connections = 1000

#通用查询
#用于控制MySQL的日志输出格式,可以设置为FILE、TABLE或NONE。当设置为FILE时,日志将被写入到指定的文件中,这通常用于记录慢查询日志和一般日志
log-output=FILE
#开启 general log 将所有到达MySQL SQL语句记录下来。一般不会开启开功能,因为log的量会非常庞大
general-log=0
general_log_file=/usr/local/mysql/mysql-8.4.6/logs/mysql-general.log

#慢查询
#查询执行时间的阈值(单位是秒)。当查询的执行时间超过这个阈值时,MySQL将会将该查询记录到慢查询日志中
long_query_time=3
#启动慢查询1表示开启,0表示关闭
slow_query_log=1
slow_query_log_file=/usr/local/mysql/mysql-8.4.6/logs/mysql-slow.log
#错误日志存放位置
log-error=/usr/local/mysql/mysql-8.4.6/logs/mysqld-error.log

#表名和字段名不区分大小写
lower_case_table_names=1

#同一客户端连接尝试失败次数,超出次数即被冻结
max_connect_errors=128

#数据库开启的最大进程连接数
max_connections=600
#设置在网络传输中一次消息传输量的最大值
max_allowed_packet = 64M
#默认时区(东八区)
default-time-zone='+8:00'
#数据库日志时间匹配系统时区
log_timestamps=system

#在并发连接数较高的情况下,需要确保table_open_cache的值足够大,以便能够存储所有并发连接中涉及的表。假设如果有600个并发连接,每个连接中涉及的表的最大数量是N,那么table_open_cache的值至少应该设置为600*N
#table_open_cache=2000
#设置内存临时表的最大大小
#tmp_table_size=512M
#专门用于MyISAM存储引擎的索引缓存。这个参数的设置对数据库性能有着显著的影响,尤其是在处理索引读取操作时,在内存中缓存索引数据可以显著提高数据库查询的速度,因为它减少了从磁盘读取数据的次数。
#key_buffer_size=512M
#控制事务日志的刷新策略。其默认值为 1,即每次事务提交时都会将日志缓冲区的数据写入日志文件,并立即刷新到磁盘。
#innodb_flush_log_at_trx_commit=1
#是 InnoDB 存储引擎中用于写入磁盘上的日志文件的缓冲区大小。默认值为16MB。设置合适的大小可以减少写操作,提高性能。
#innodb_log_buffer_size=16M
# *极其重要的数据库内存参数,一般建议将服务器物理内存的 50% 到 70% 分配给 innodb_buffer_pool_size,这里8G及以下内存适合生产环境低并发用户
innodb_buffer_pool_size=3G
#用于定义重做日志文件(Redo Log)的大小。它直接影响数据库的性能、事务处理效率以及崩溃恢复时间。(innodb_log_file_size 的总可用日志空间由以下公式计算:总日志空间 = innodb_log_file_size × innodb_log_files_in_group 默认情况下,innodb_log_files_in_group 的值为 2,因此调整 innodb_log_file_size 即可控制总日志空间。日志文件越大,崩溃后的恢复时间越长。一般情况下,每 1GB 的日志文件恢复时间约为 5 分钟。)
innodb_redo_log_capacity=1G
#innodb_log_file_size=1G#innodb_log_file_size已经弃用使用innodb_redo_log_capacity替代
#设置每次自动扩展数据文件时增长的大小(单位是MB)
innodb_autoextend_increment=64

#该参数值请根据innodb_buffer_pool_size大小来设置,4G以下不需要设置该参数
#当innodb_buffer_pool_size在8G以上时可以设置为4;32G以上可以设置为8
#innodb_buffer_pool_instances=4
#定义了 InnoDB 层能够同时打开的文件数量上限
innodb_open_files=300
#设置是否每个数据库的每个表都会生成一个数据空间,1表示开启
innodb_file_per_table=1

[client]
#修改默认编码
default-character-set=utf8mb4
3.7、Grafana可视化mysql监控数据
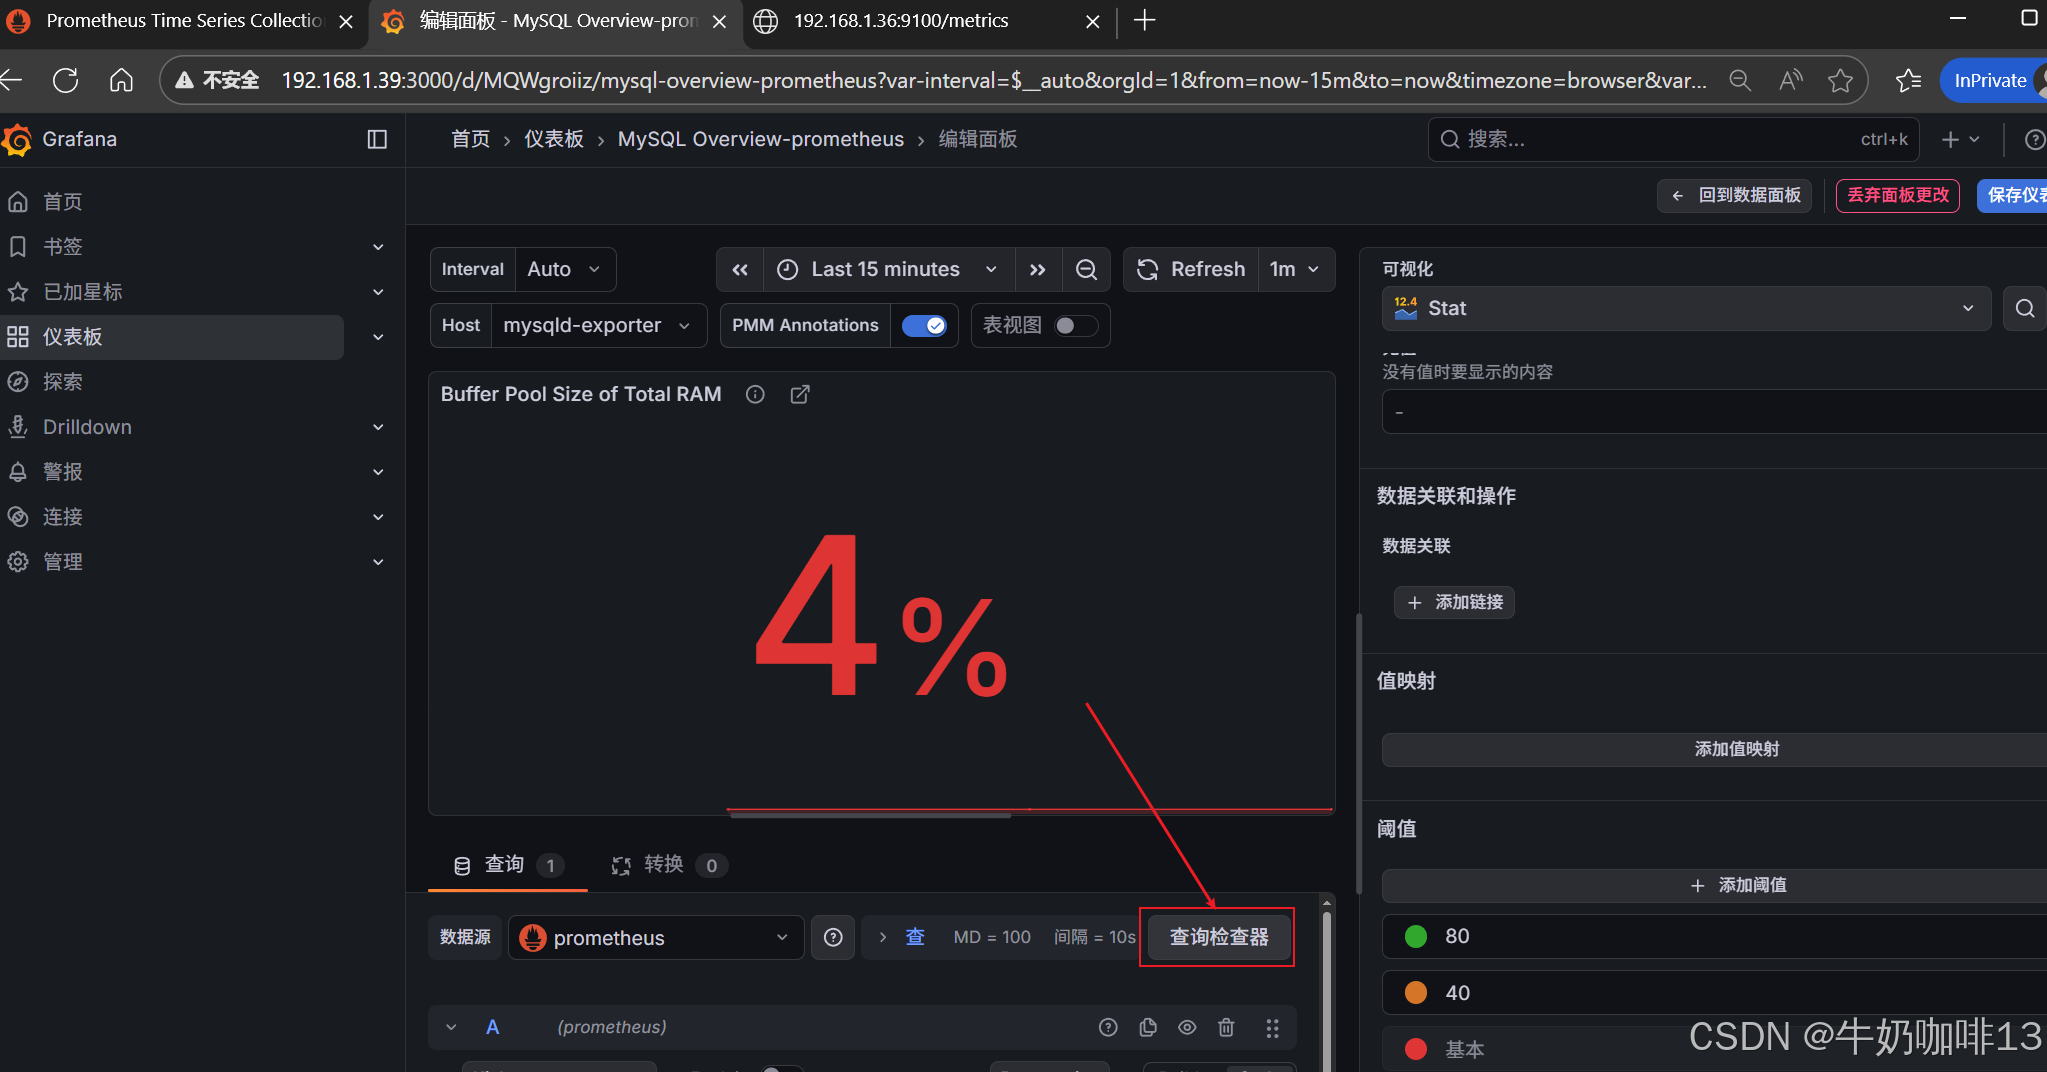
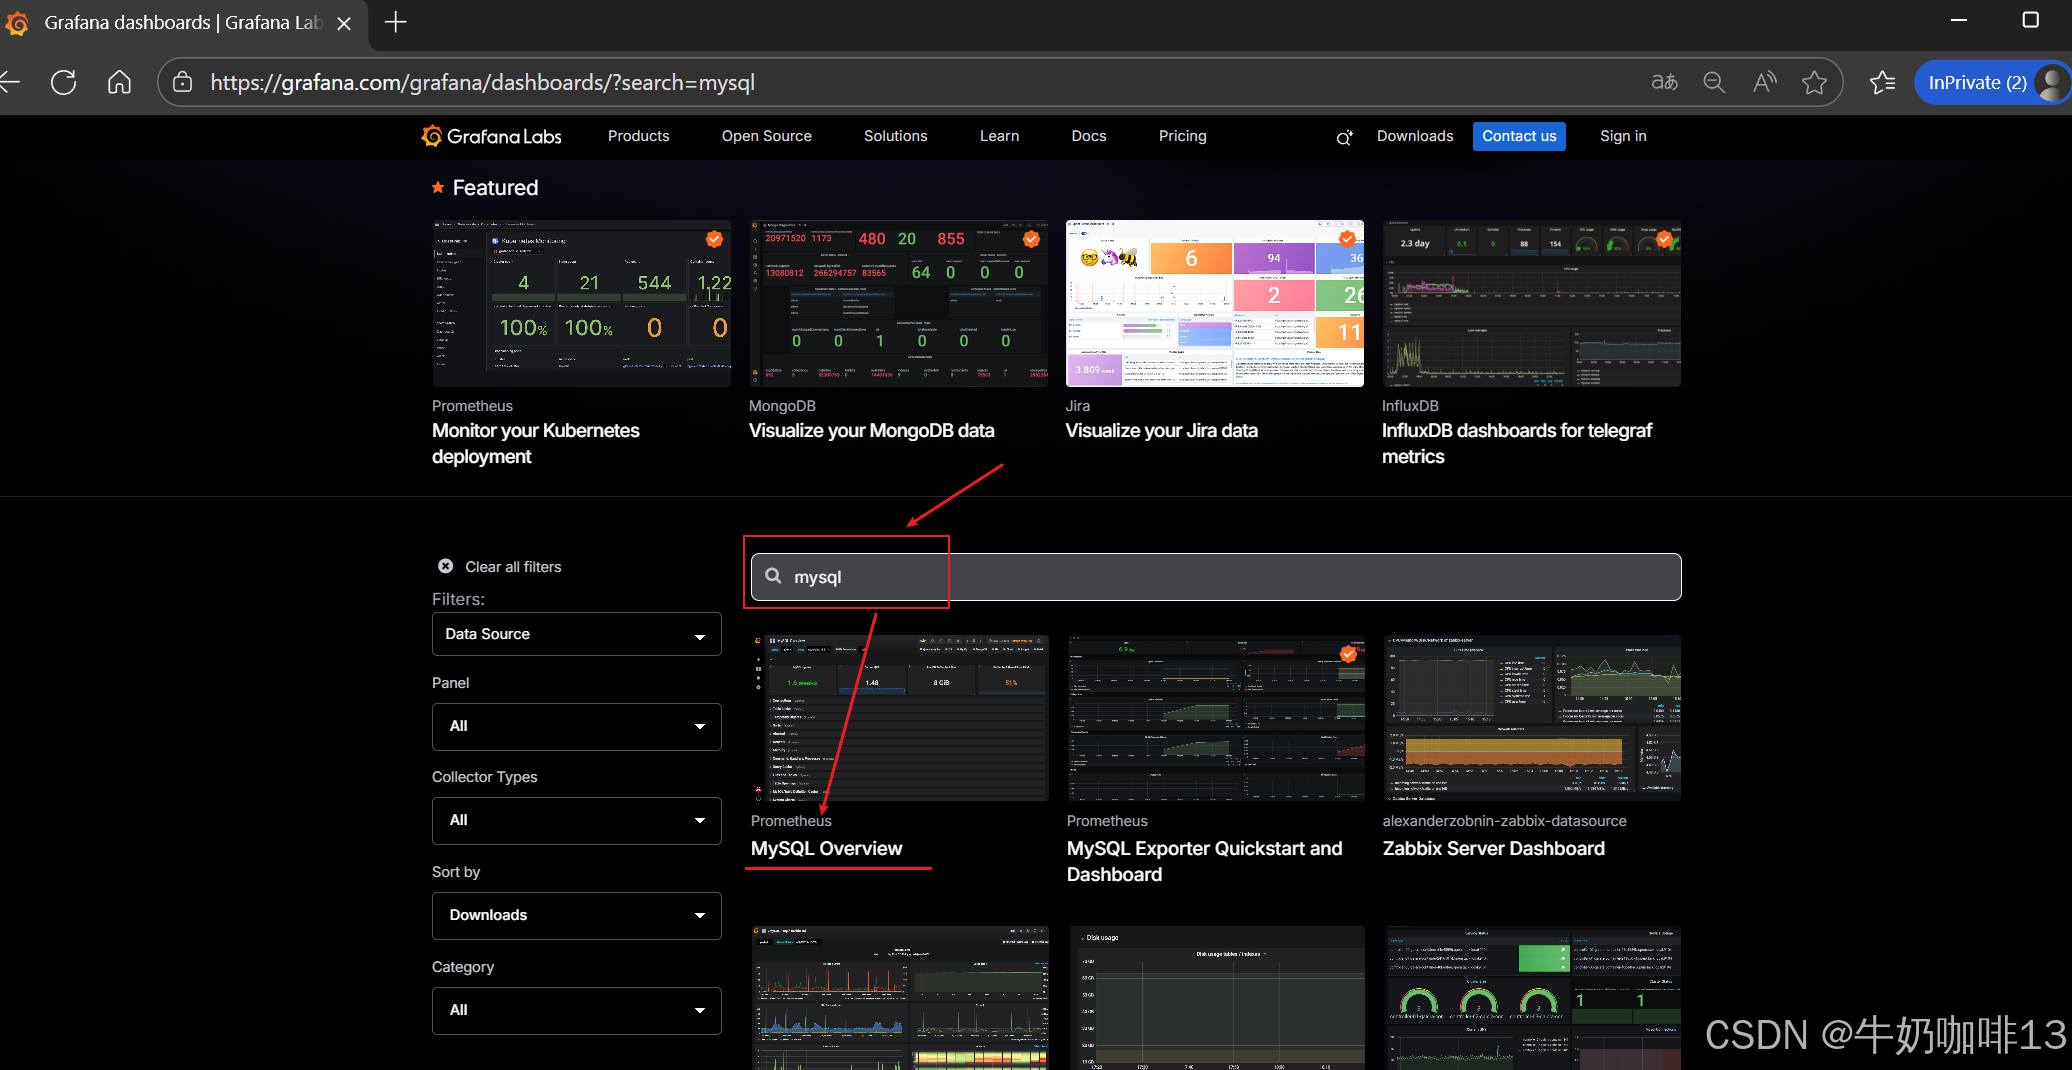
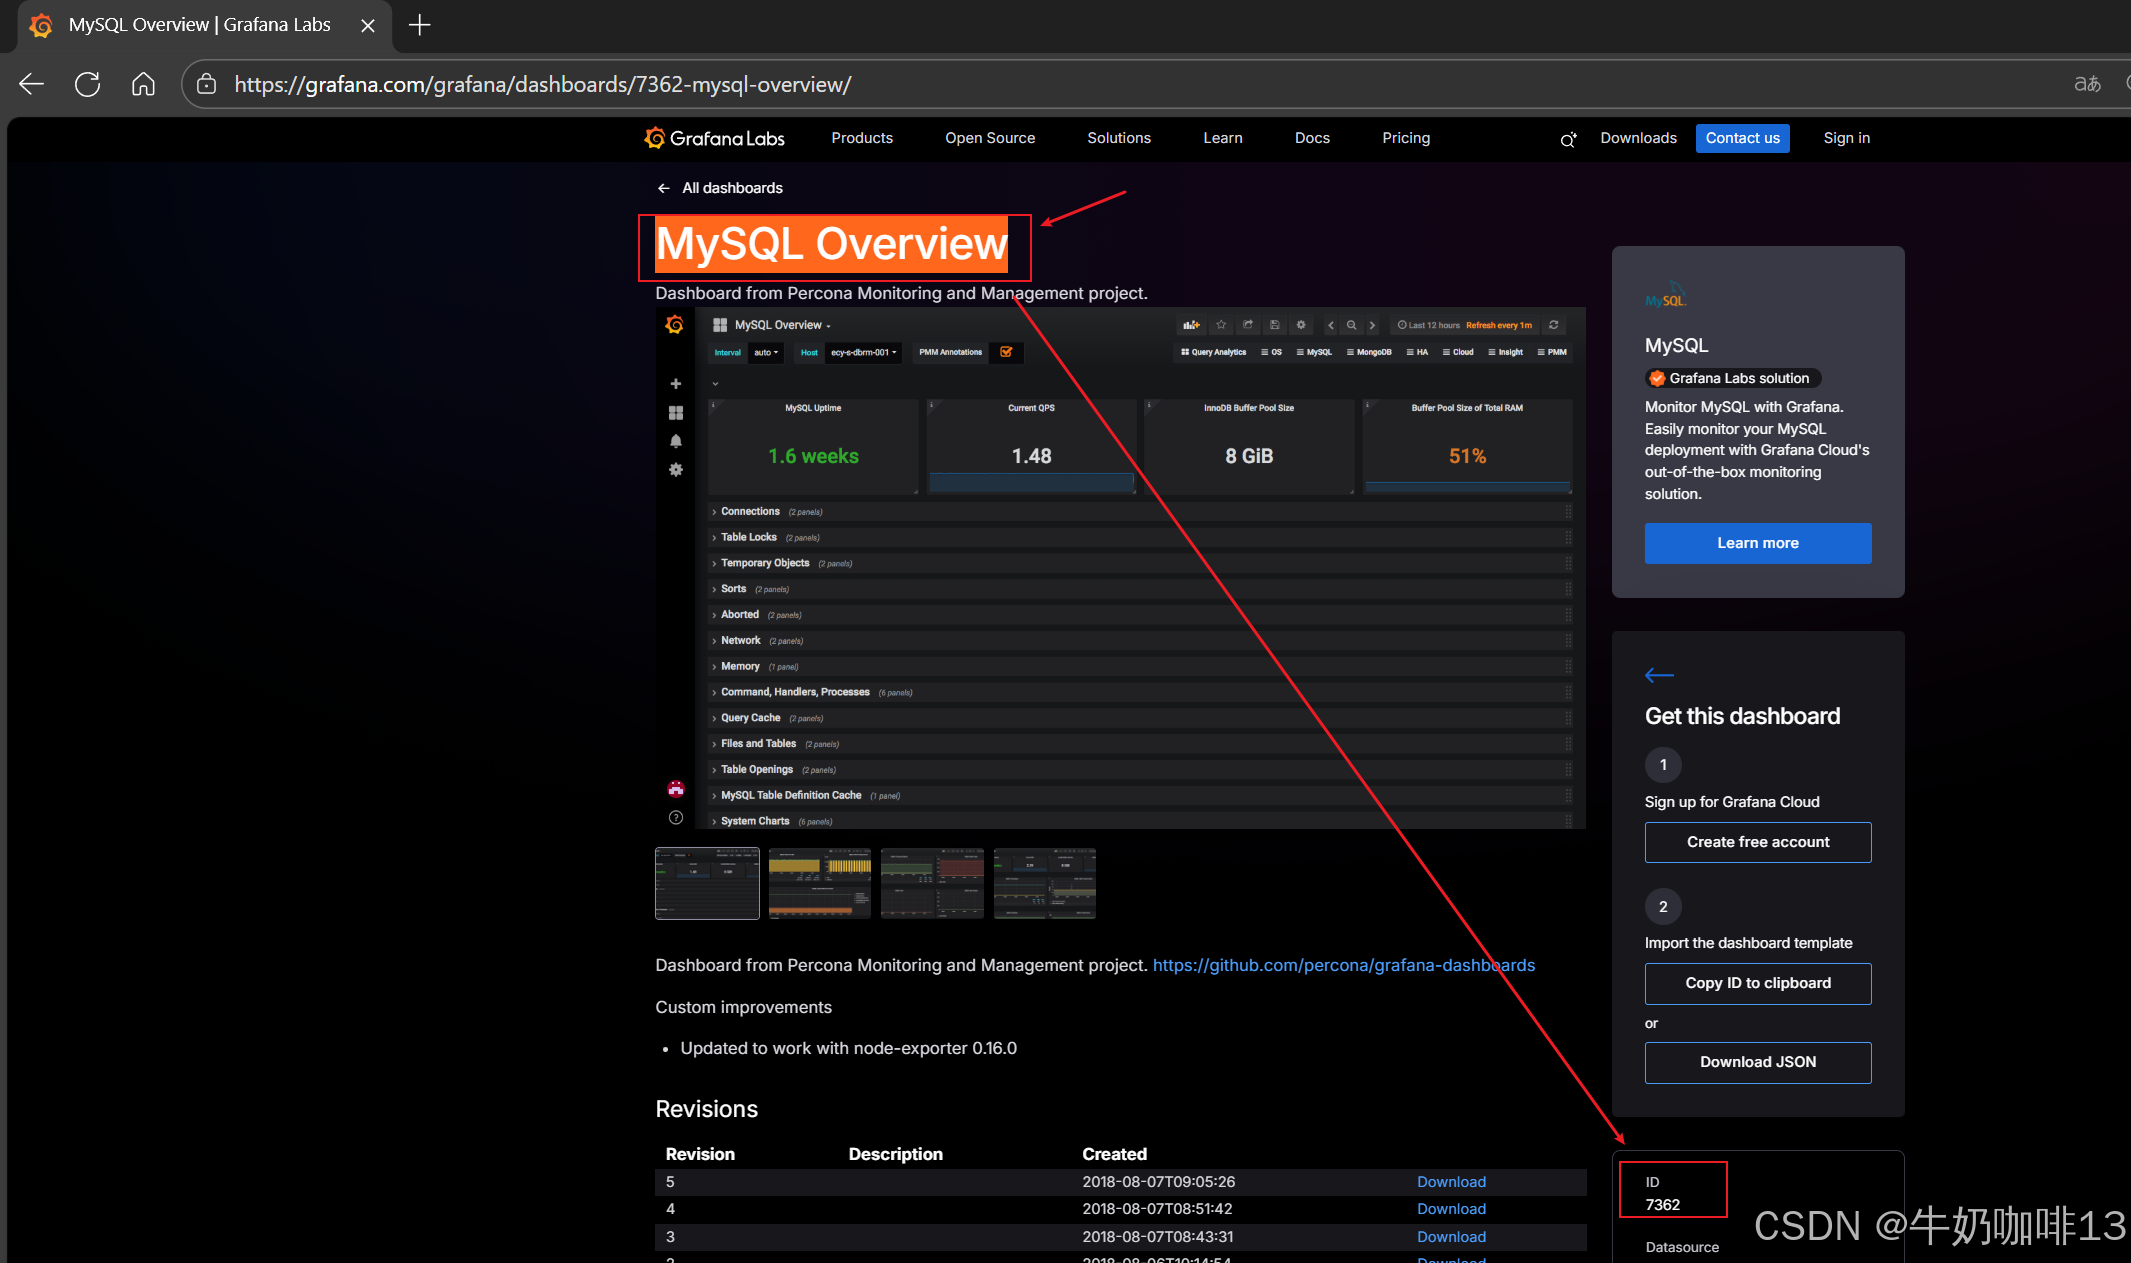
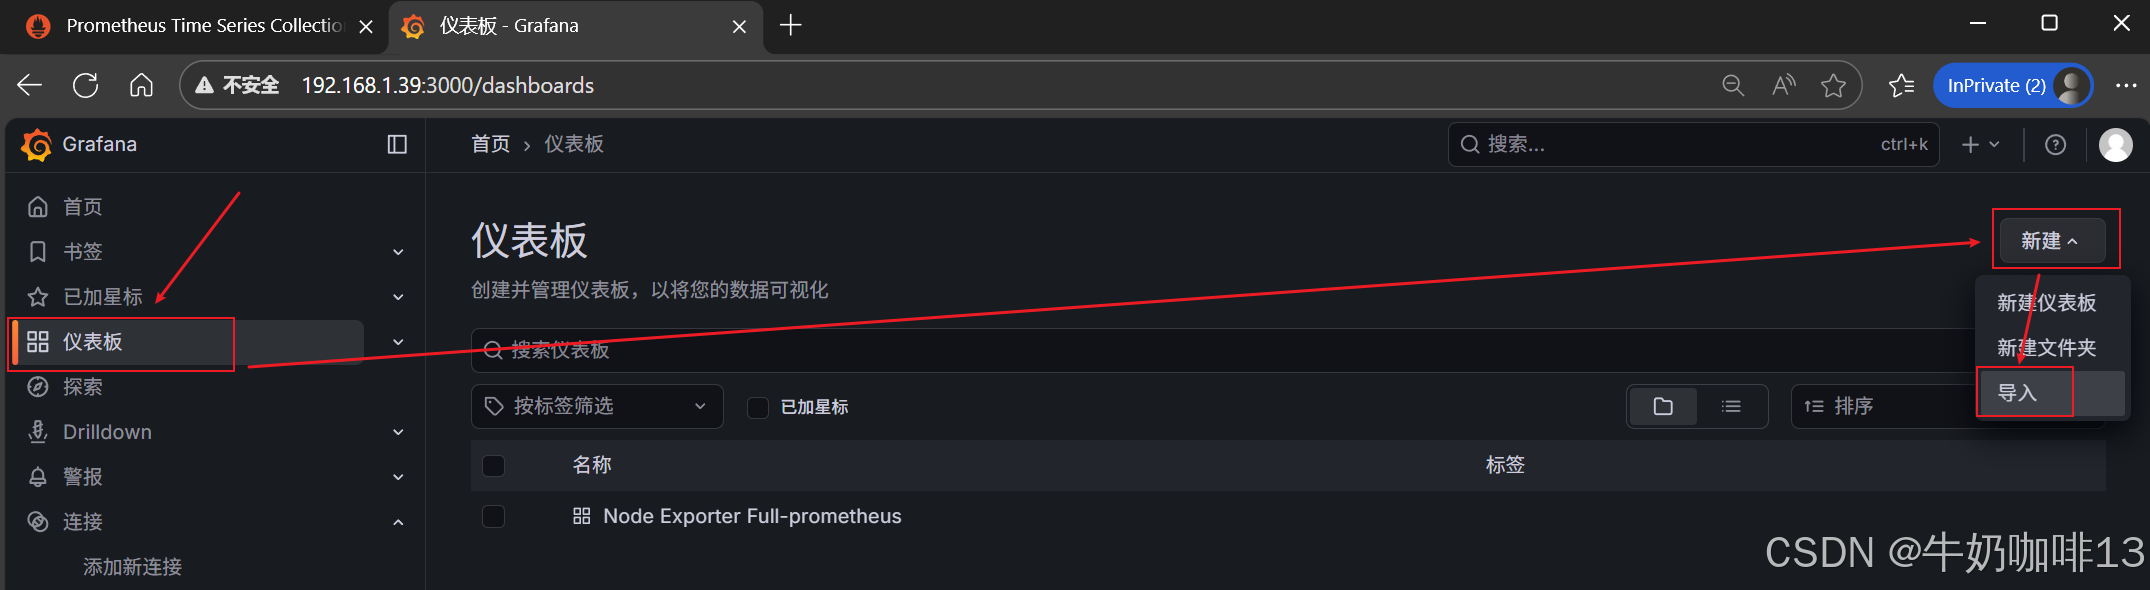
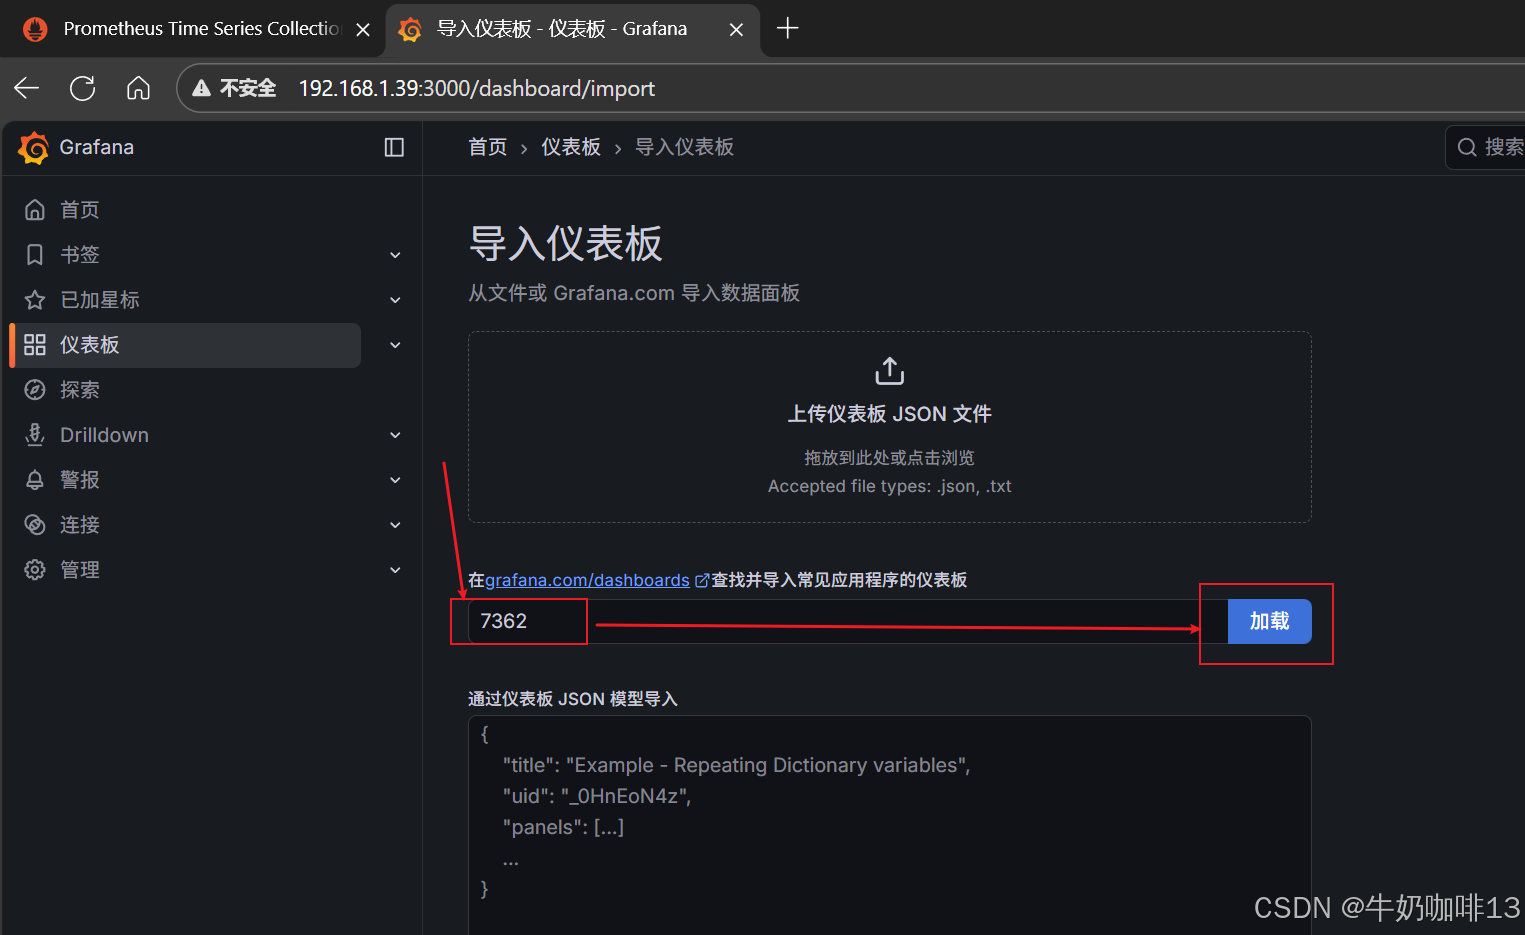
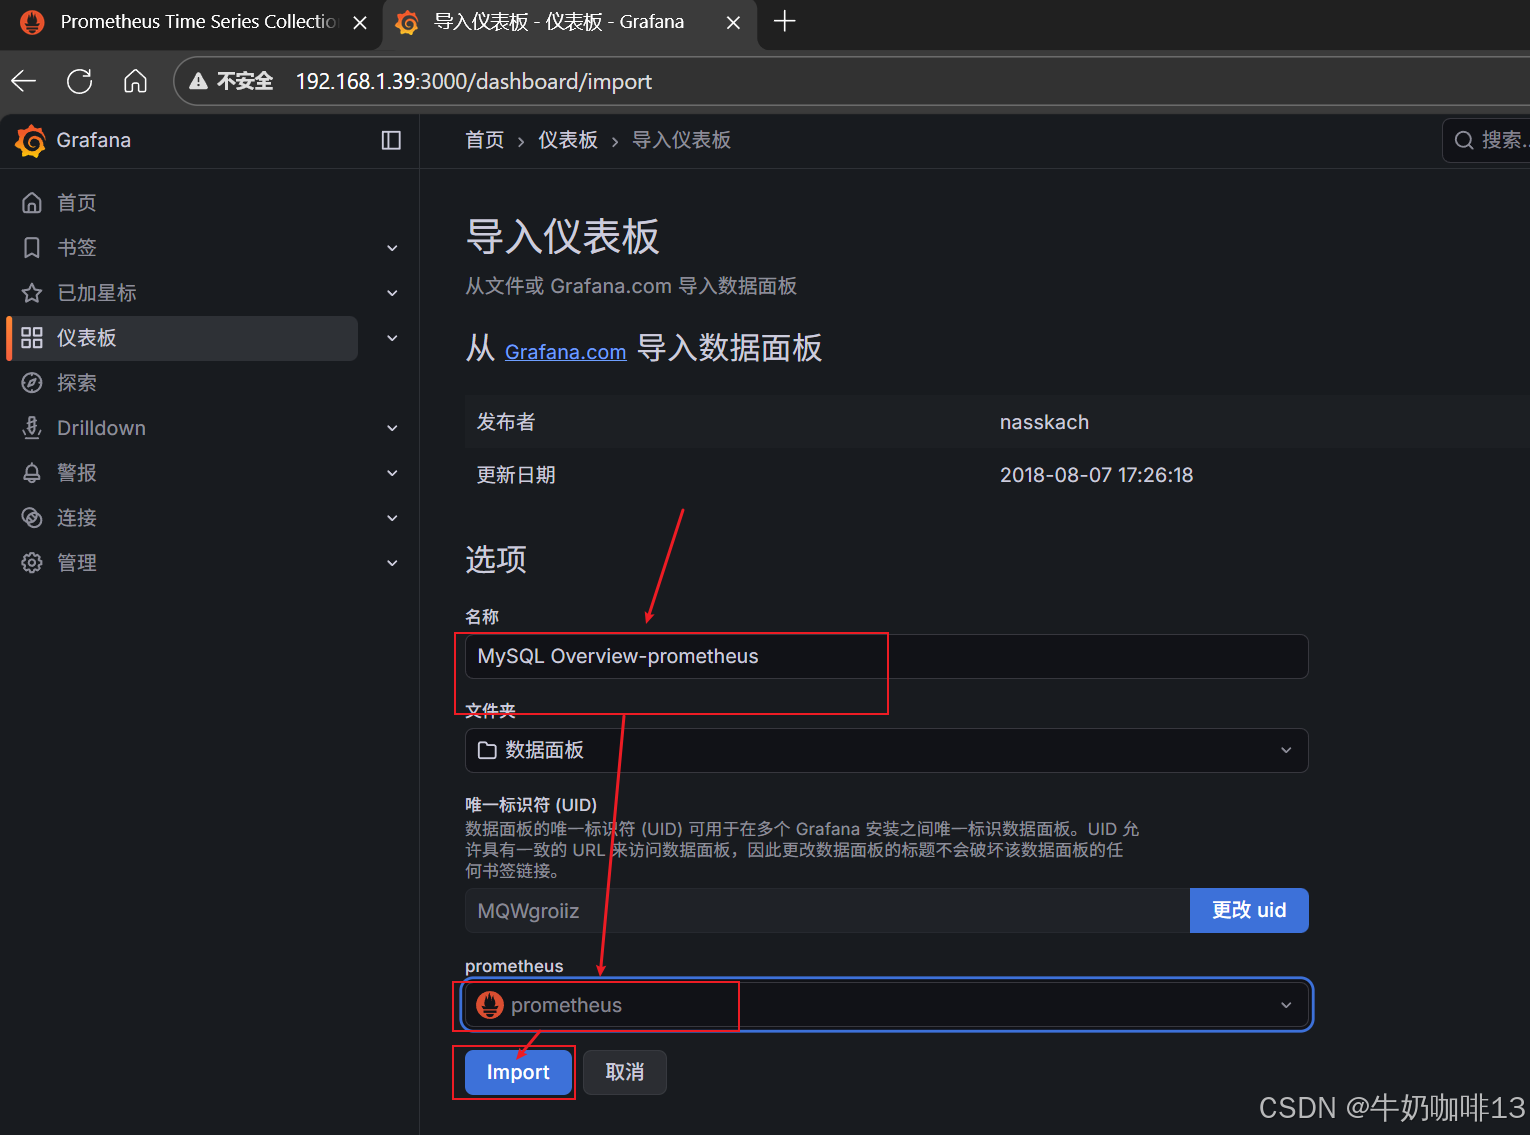
到【Grafana dashboards | Grafana Labs**】官网获取更多的仪表盘模板。**在Grafana的仪表盘界面中间的输入框输入【mysql】后按下Enter键查询,即可列出所有相关mysql的模板(如:我们选择【MySQL Overview】模板进入后,获取到该模板的编号是【7362】)然后在浏览器上进入我们服务器上部署好的Grafana界面的【仪表盘】-->【新建】-->【导入】界面输入模板的编号或者JSON文件内容后点击【加载】后弹出的界面上可以修改模板名称、prometheus后点击【Import】后如下图所示:
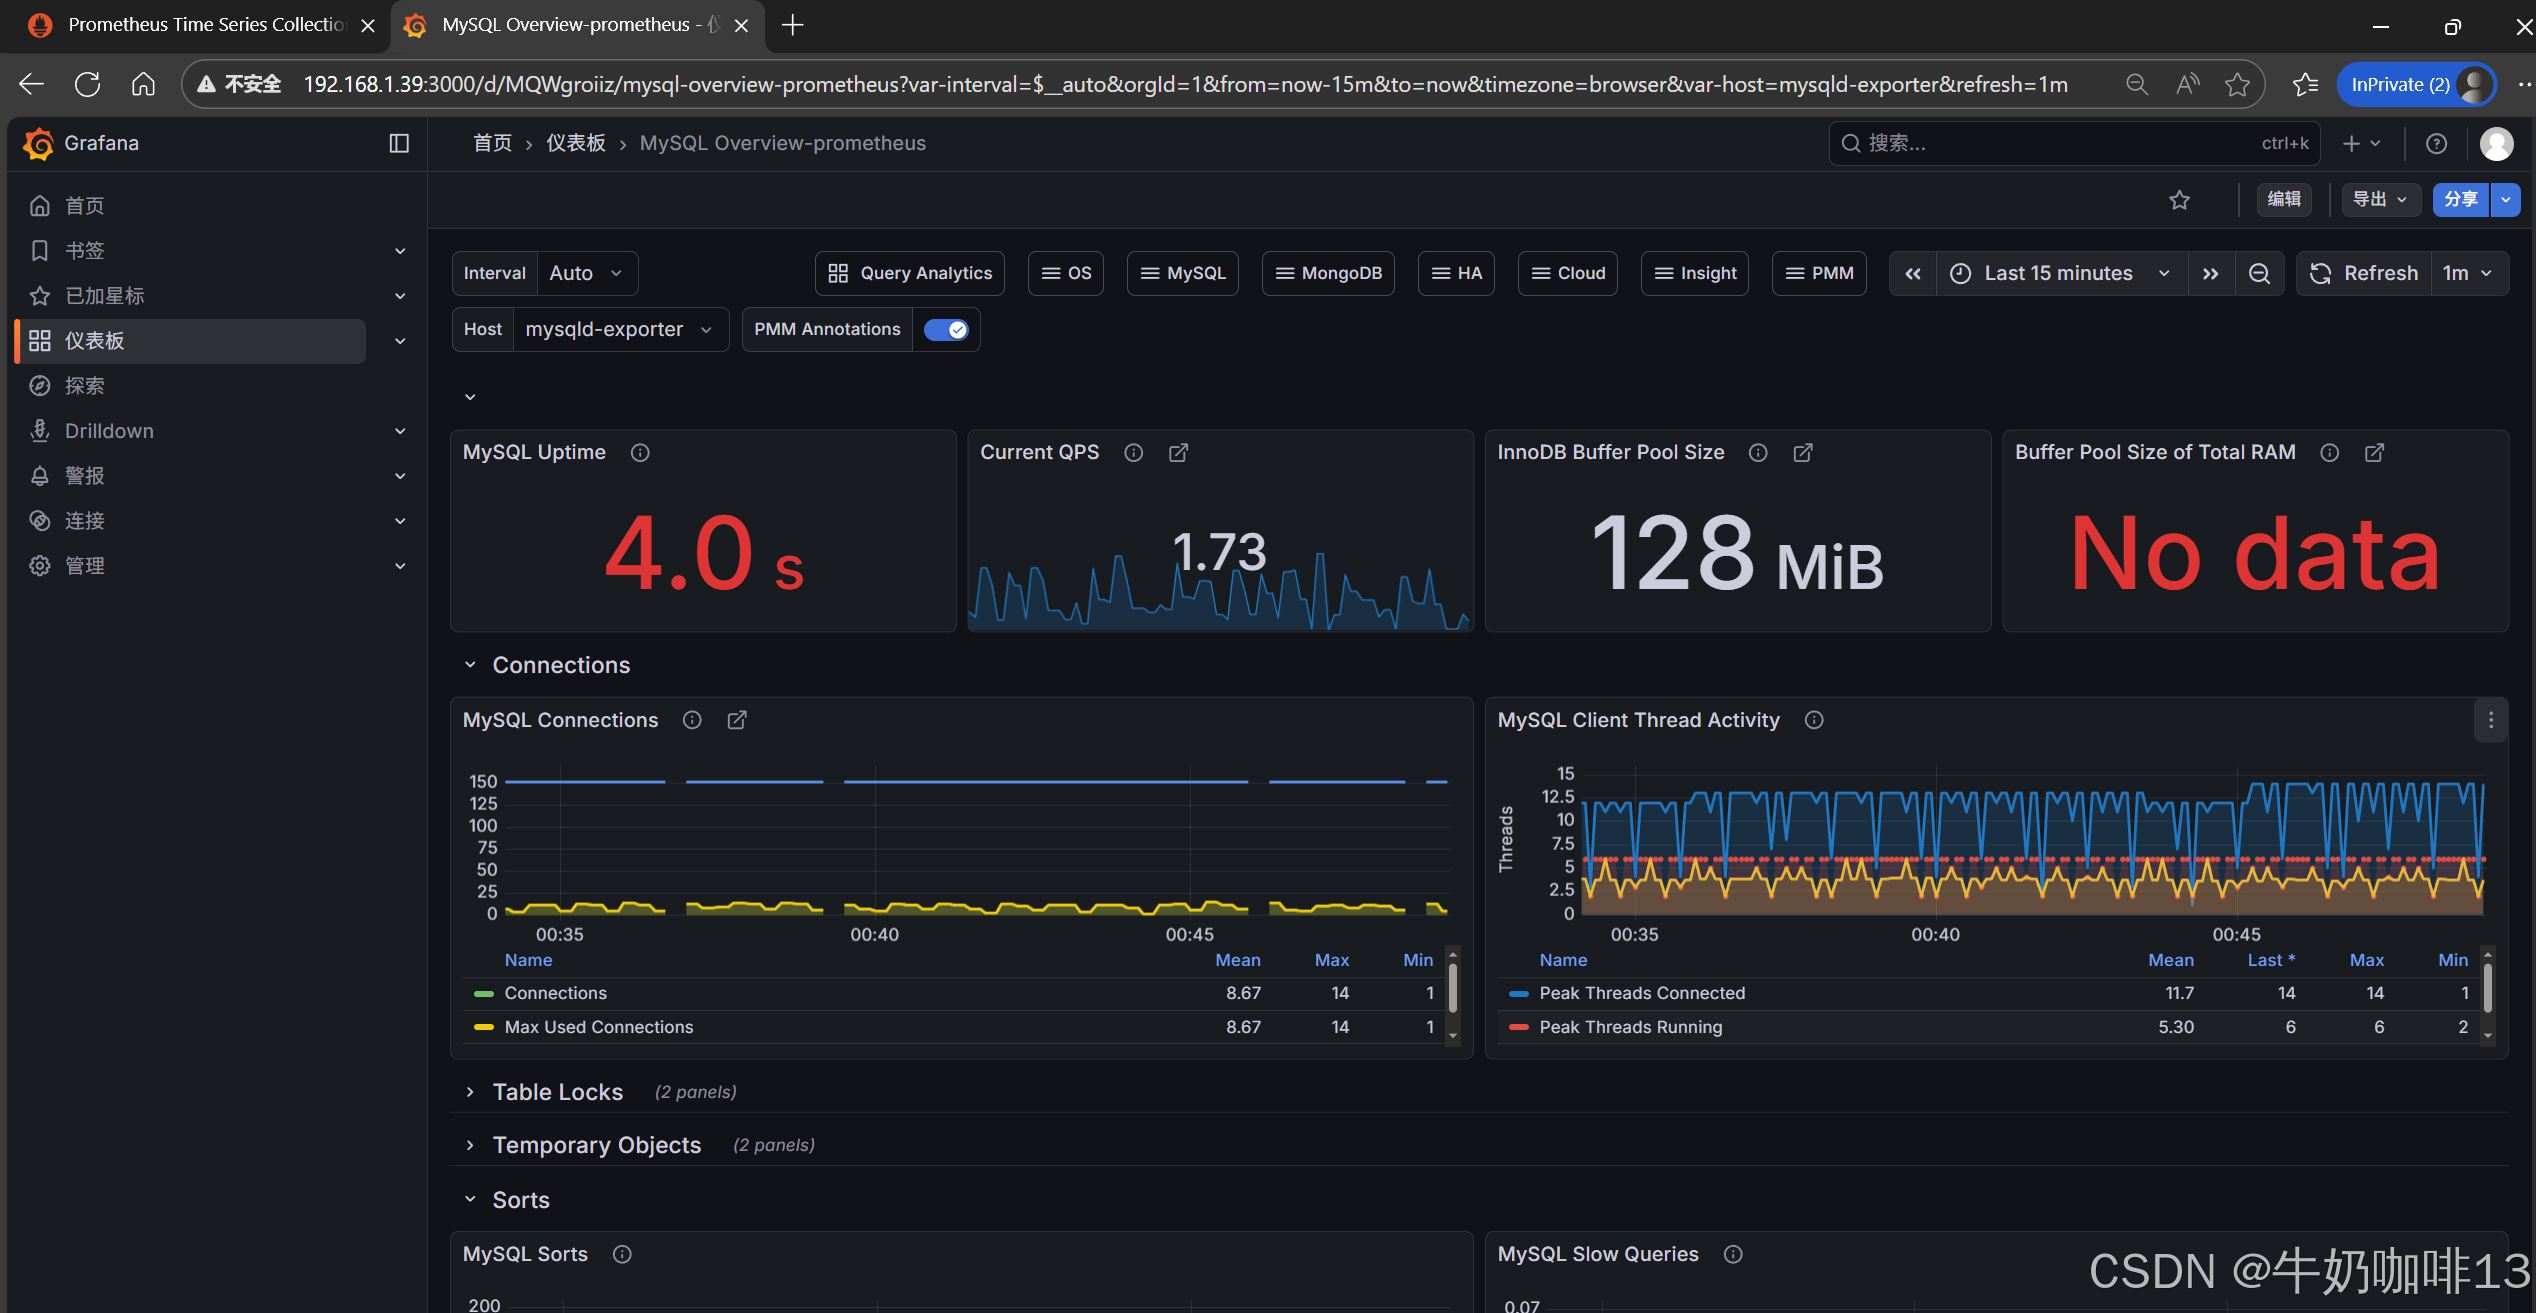
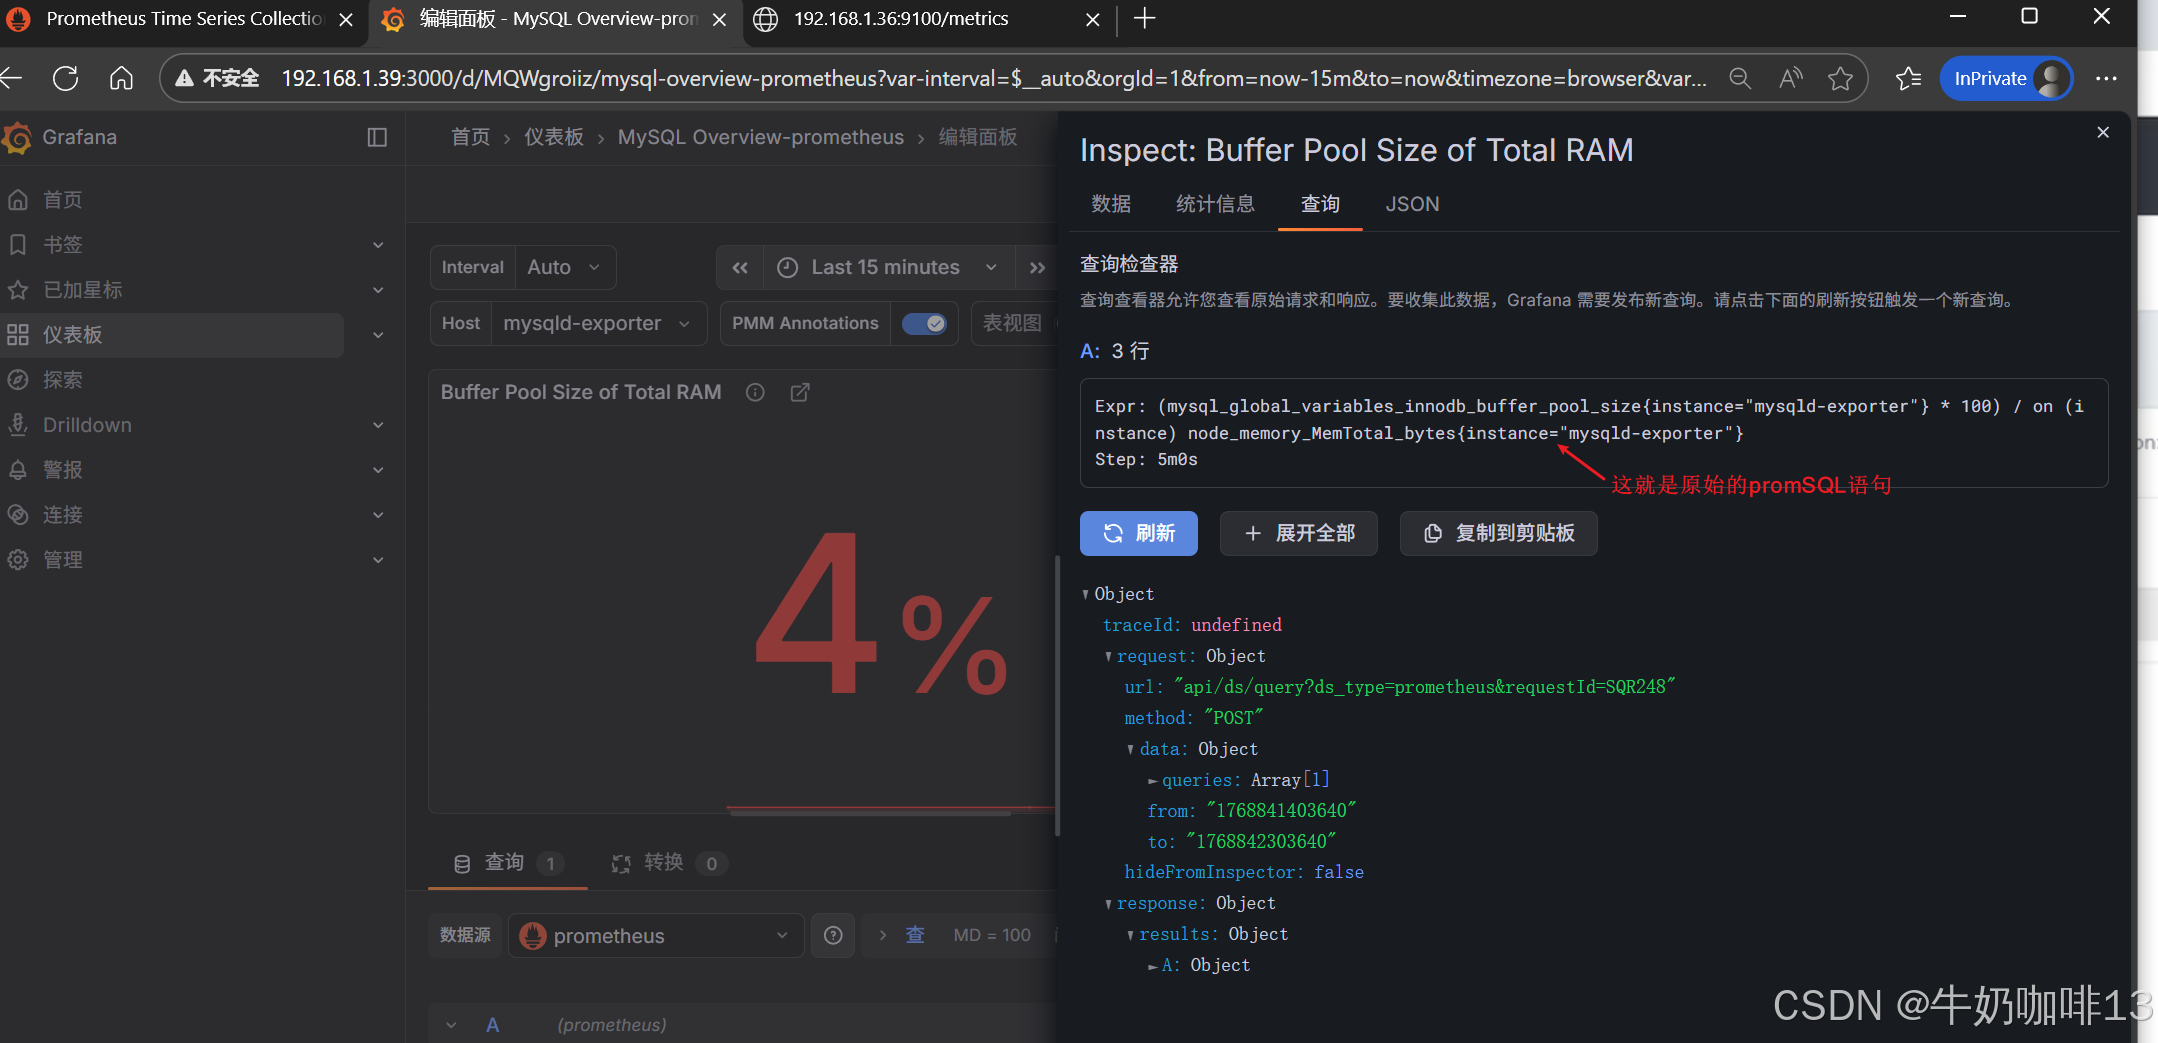
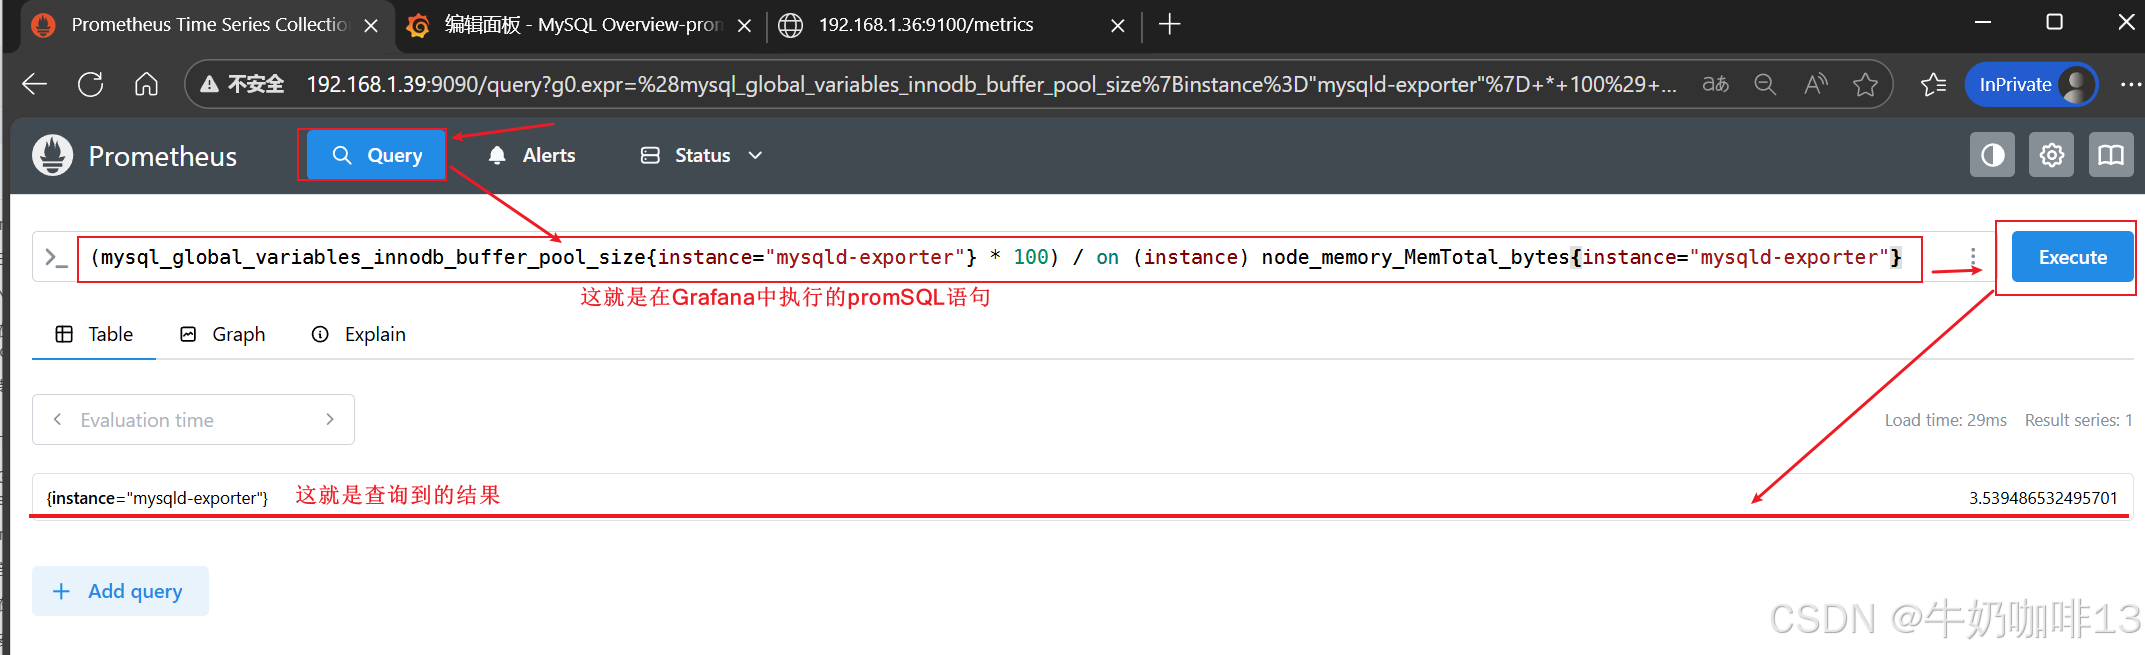
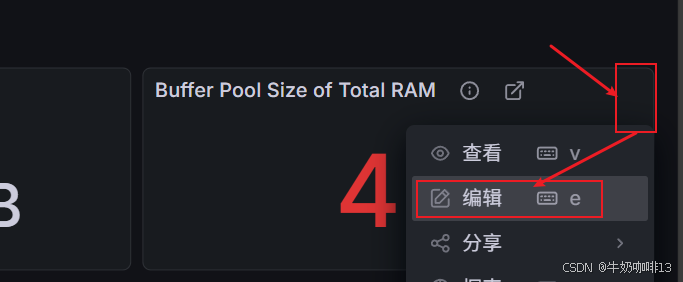
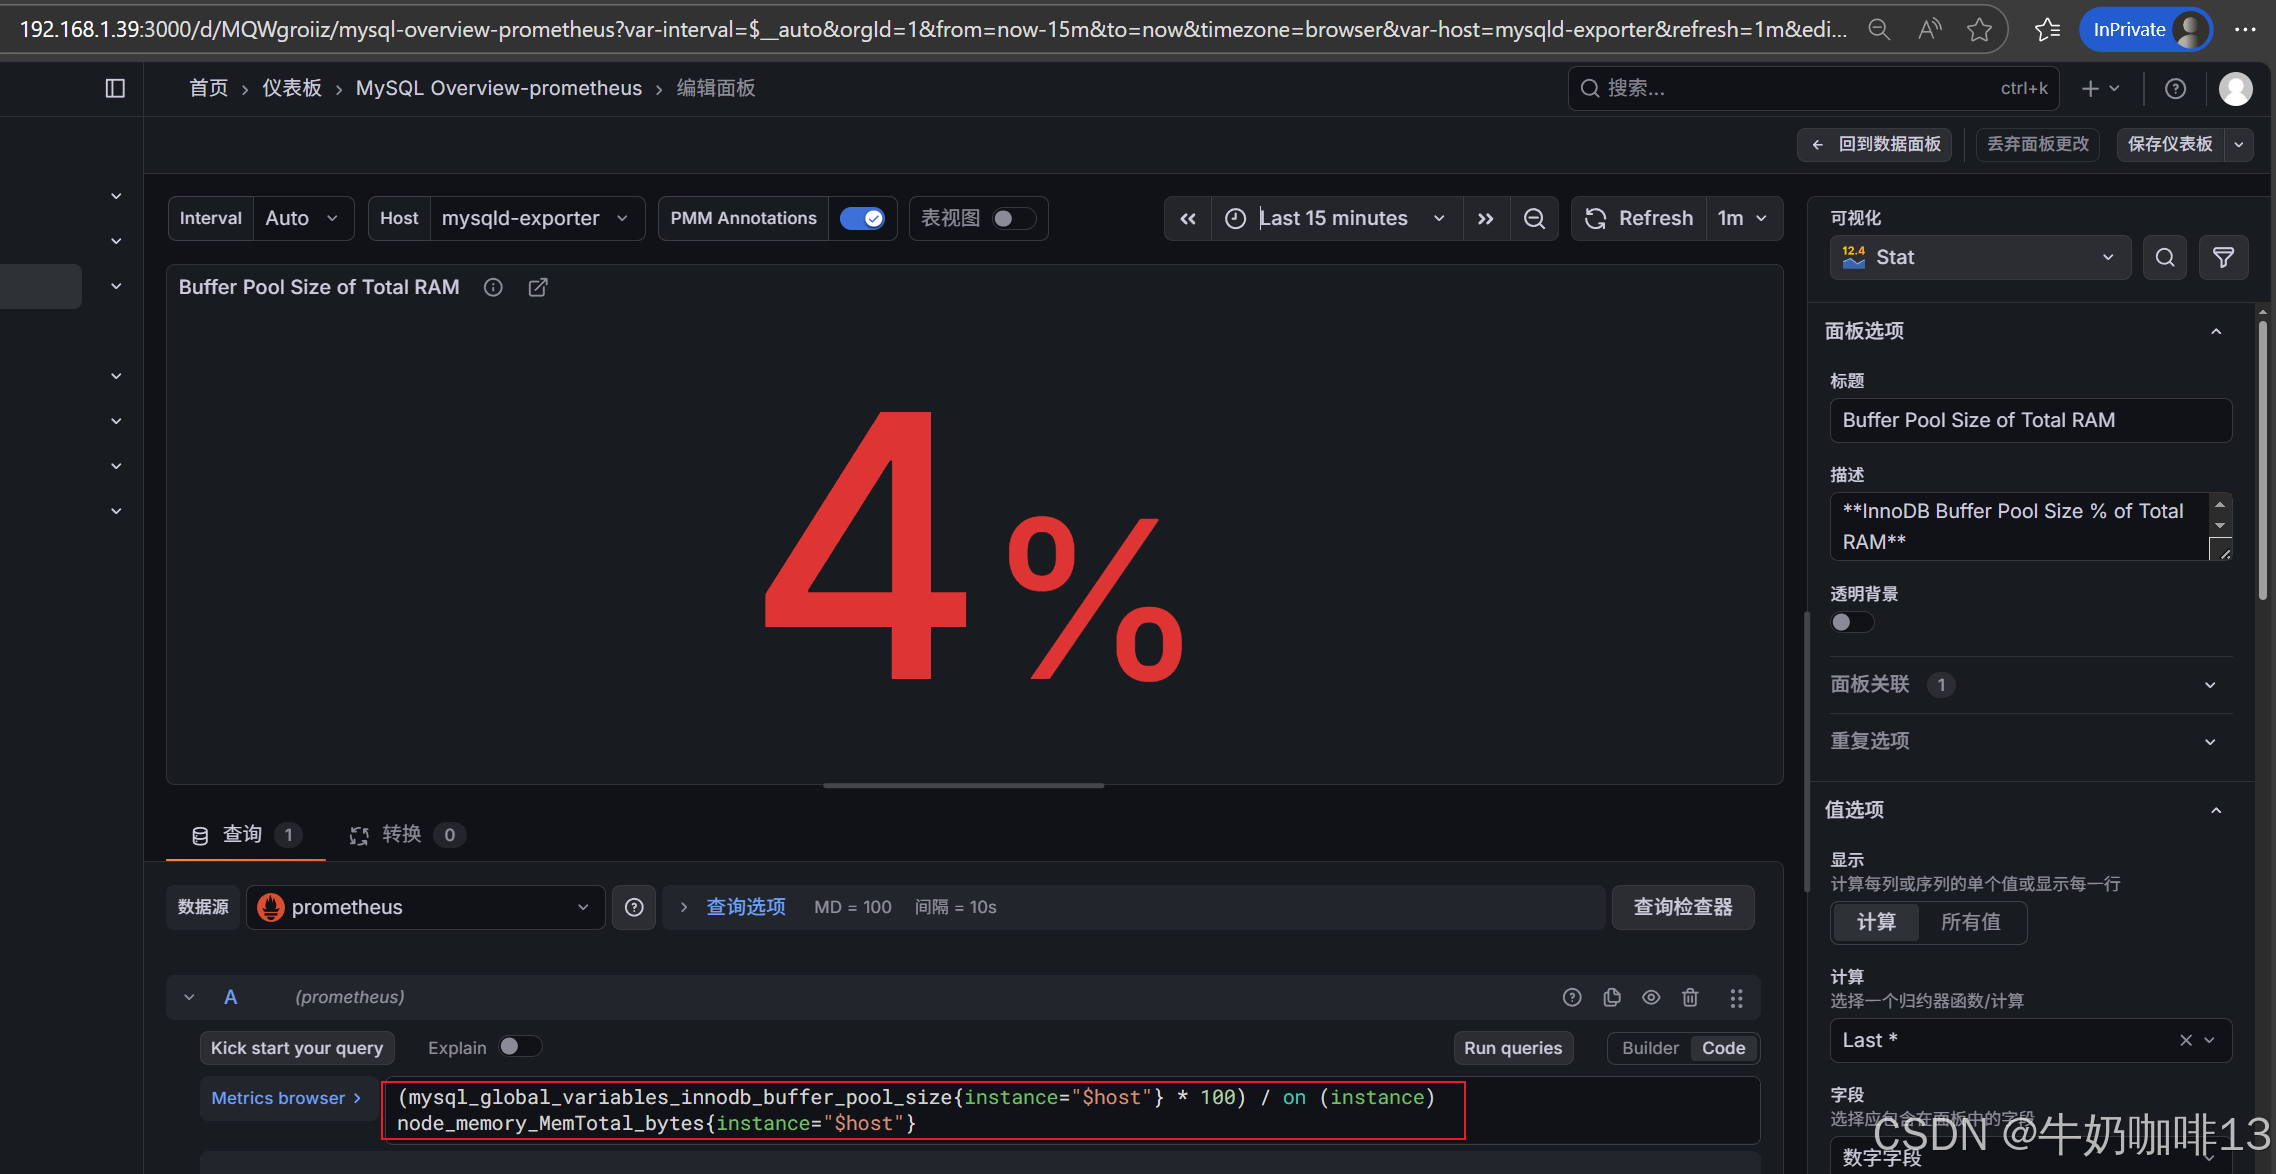
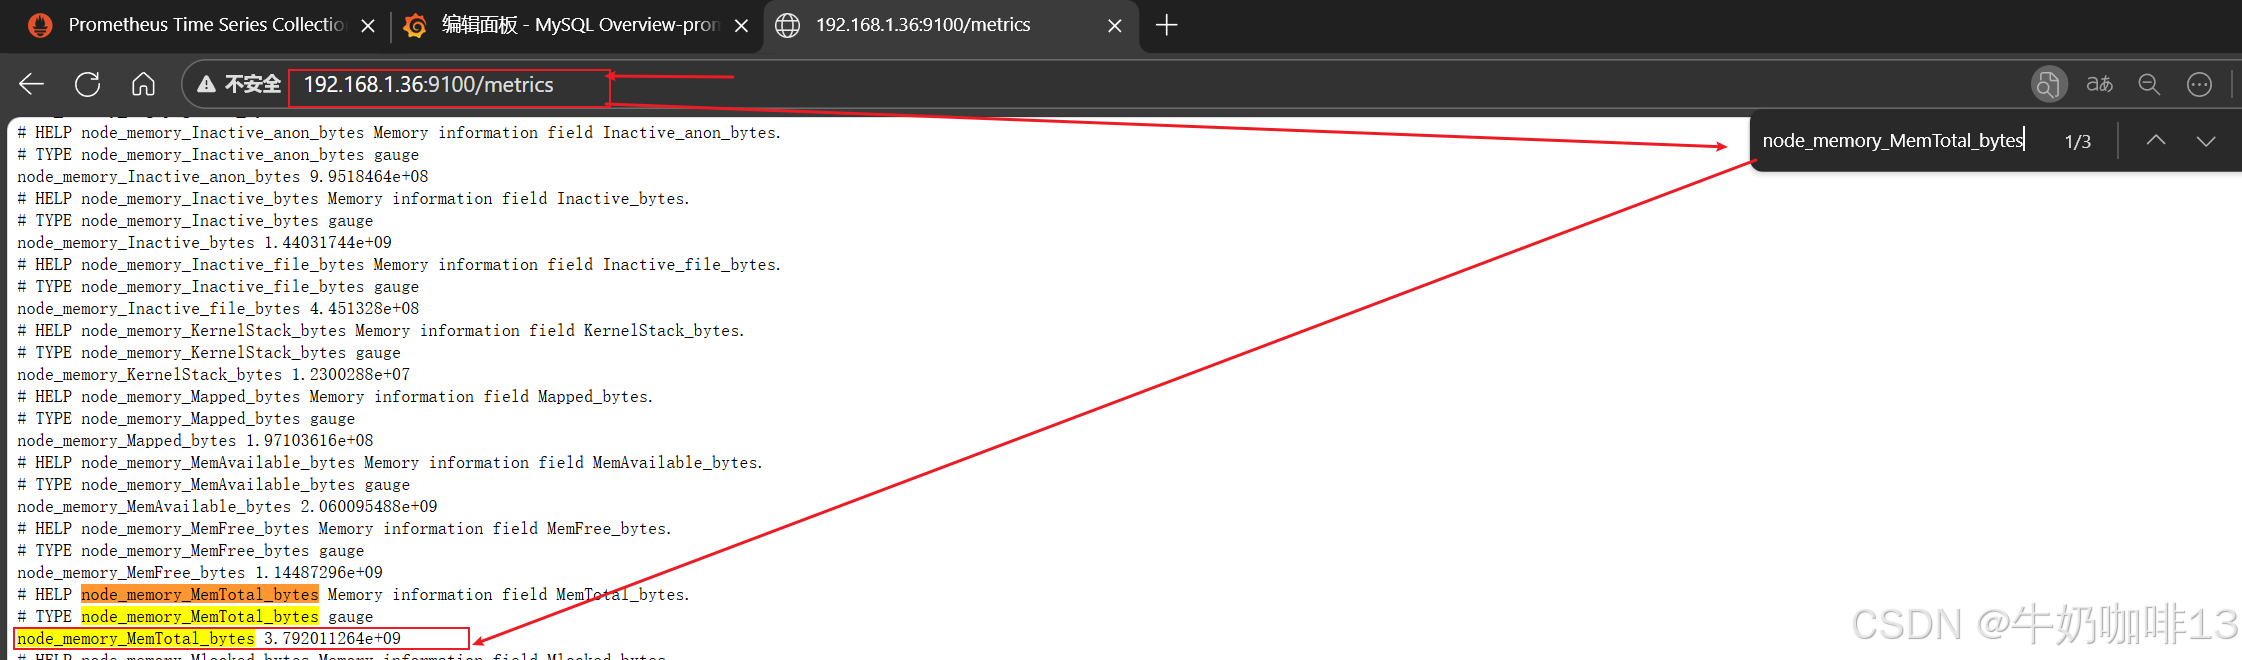
注意:如上图中mysql的监控仪表盘中右上角的内存缓存显示【No data】时,我们需要鼠标移到该内容右上角三个点选择【编辑】可以查看到其对应的promSQL语句可以看到该语句涉及到了【node_memory_MemTotal_bytes{instance="$host"}】时属于【node_exporter】的数据(因此需要确保该主机上还需要安装node_exporter、且prometheus server上还需要配置上该node_exporter的地址【IP:9100】将没有数据显示的这个内容的原始promsql语句拿到prometheus server的查询界面查询即可)如下图所示:

bash
scrape_configs:
  # The job name is added as a label `job=<job_name>` to any timeseries scraped from this config.
  - job_name: "prometheus"

    # metrics_path defaults to '/metrics'
    # scheme defaults to 'http'.

    static_configs:
      - targets: ["localhost:9090",'192.168.1.39:9100','192.168.1.36:9100','192.168.1.37:9100']
       # The label name is added as a label `label_name=<label_value>` to any timeseries scraped from this config.
        labels:
          app: "prometheus"

  - job_name: "mysql"
    static_configs:
      - targets: ['192.168.1.36:9104','192.168.1.36:9100']
        labels:
          instance: "mysqld-exporter"


#验证修改的prometheus.yml文件配置是否正确并让配置生效
./promtool check config prometheus.yml

#直接使用热启动让prometheus server的配置生效
curl -XPOST localhost:9090/-/reload