一、算法原理
DBSCAN(Density-BasedSpatialClusteringofApplicationswithNoise)是一种基于密度的聚类算法,其核心思想是通过发现数据中的高密度区域来识别簇,并将低密度区域的数据点标记为噪声。
1、核心概率
核心点(CorePoint):
在半径为ε\varepsilonε的邻域内,若包含至少MinPts个数据点(包括自身),则该点为核心点。
ε\varepsilonε为邻域半径。
MinPts为最小样本数,为超参数。
边界点(BorderPoint):
在半径ε−\varepsilon-ε−的邻域内,点的数量少于
MinPts,但位于某个核心点的邻域内。
噪声点(NoisePoint):
既不是核心点,也不是边界点的点(即低密度区域的孤立点)。
密度直达(DirectlyDensity-Reachable):
若点p在点q的ε−\varepsilon-ε−邻域内,且q是核心点,则称p从q密度直达。
密度相连(Density-Connected):
若存在点o,使得p和q均从o密度可达,则称p和q密度相连。
2、算法步骤
(1)初始化
输入参数:ε\varepsilonε、MinPts(最小邻域点数)。
标记所有点为未访问(Unvisited)。
(2)遍历数据点:
随机选择一个未访问的点p。计算p的ε−\varepsilon-ε−邻域内的点数:若点数≥MinPts,则p是核心点,开始扩展(步骤3)。否则,标记p为噪声点(后续可能被重新分类为边界点)。
(3)扩展簇:
创建一个新簇,将p加入簇。遍历p的ε−\varepsilon-ε−邻域内的所有点q:若q未被访问:标记q为已访问。若q是核心点(其邻域点数≥MinPts),递归扩展q的邻域。若q不是核心点但位于某个核心点的邻域内,则q是边界点,将其加入当前簇。
(4)终止条件:
当前簇无法继续扩展时,选择下一个未访问的点重复步骤2-3,直到所有点被访问。
3、关键特性
抗噪声能力: 噪声点会被明确标记,不参与任何簇的形成。
形状适应性: 能发现任意形状的簇(如环形、非凸形),而无需预先指定簇的数量(如K-Means)。
参数敏感性: ε\varepsilonε过大:可能将不同簇合并;过小:可能将同一簇拆分。MinPts通常根据数据维度选择(如二维数据中 MinPts≥4)。
时间复杂度:最坏情况下为 O(n2n^2n2)(需计算所有点对的距离)。使用空间索引(如KD树)可优化至 O(nlognnlognnlogn)。
4、应用场景
地理空间数据聚类(如发现城市中的热点区域)。
异常检测(识别噪声点)。
图像分割(基于像素密度)。
二、参考代码
python
from sklearn.neighbors import NearestNeighbors
from collections import deque
import numpy as np
from sklearn.datasets import make_moons, make_blobs,make_circles
import matplotlib.pyplot as plt

class DBSCAN:
    def __init__(self, eps=0.5, min_samples=5):
        """
        初始化DBSCAN参数

        参数:
            eps: 邻域半径
            min_samples: 核心点所需的最小邻域样本数
        """
        self.eps = eps
        self.min_samples = min_samples
        self.labels_ = None

    def fit(self, X):
        """
        对数据进行DBSCAN聚类

        参数:
            X: 输入数据 (n_samples, n_features)
        """
        n_samples = X.shape[0]
        self.labels_ = np.full(n_samples, -1, dtype=int)  # -1表示噪声点
        cluster_id = 0

        # 计算每个点的邻域
        neighbors_model = NearestNeighbors(radius=self.eps)
        neighbors_model.fit(X)
        neighborhoods = neighbors_model.radius_neighbors(X, return_distance=False)

        # 标记已访问的点
        visited = np.zeros(n_samples, dtype=bool)

        for i in range(n_samples):
            if not visited[i]:
                visited[i] = True
                neighbors = neighborhoods[i]

                if len(neighbors) >= self.min_samples:
                    # 发现新簇
                    self._expand_cluster(X, neighborhoods, visited, i, neighbors, cluster_id)
                    cluster_id += 1
                else:
                    # 标记为噪声点(可能在后续扩展中被重新分配)
                    self.labels_[i] = -1

        return self

    def _expand_cluster(self, X, neighborhoods, visited, index, neighbors, cluster_id):
        """
        扩展簇,将密度可达的点加入当前簇
        """
        queue = deque([index])
        self.labels_[index] = cluster_id

        while queue:
            current = queue.popleft()

            # 获取当前点的邻域
            current_neighbors = neighborhoods[current]

            if len(current_neighbors) >= self.min_samples:
                for neighbor in current_neighbors:
                    if not visited[neighbor]:
                        visited[neighbor] = True
                        if self.labels_[neighbor] == -1:
                            # 之前标记为噪声的点现在属于这个簇
                            self.labels_[neighbor] = cluster_id
                        elif self.labels_[neighbor] < 0:
                            # 未分类的点,加入队列
                            self.labels_[neighbor] = cluster_id
                            queue.append(neighbor)


    def generate_data(self,dataset_type='moons', n_samples=300, noise=0.05, random_state=42):
        """
        生成不同类型的测试数据集

        参数:
            dataset_type: 数据集类型 ('moons', 'blobs', 'circles')
            n_samples: 样本数量
            noise: 噪声水平
            random_state: 随机种子

        返回:
            X: 特征数据 (n_samples, 2)
            y: 真实标签 (用于参考)
        """
        if dataset_type == 'moons':
            X, y = make_moons(n_samples=n_samples, noise=noise, random_state=random_state)
        elif dataset_type == 'blobs':
            X, y = make_blobs(n_samples=n_samples, centers=3,
                            cluster_std=[0.8, 0.5, 0.3],
                            random_state=random_state)
        elif dataset_type == 'circles':
            X, y = make_circles(n_samples=n_samples, factor=0.5,
                            noise=noise, random_state=random_state)
        else:
            raise ValueError("Error database type:choose 'moons', 'blobs' 或 'circles'")

        return X, y
    def plot_clusters(self,X, labels, title="DBSCAN  clustering result", centers=None):
        """
        可视化聚类结果

        参数:
            X: 输入数据
            labels: 聚类标签
            title: 图表标题
            centers: 簇中心(可选)
        """
        plt.figure(figsize=(10, 6))

        # 获取唯一标签(排除噪声点-1)
        unique_labels = set(labels)
        colors = [plt.cm.Spectral(each) for each in np.linspace(0, 1, len(unique_labels))]

        # 绘制每个簇
        for k, col in zip(unique_labels, colors):
            if k == -1:
                # 噪声点显示为黑色
                col = [0, 0, 0, 1]

            class_member_mask = (labels == k)
            xy = X[class_member_mask]
            plt.scatter(xy[:, 0], xy[:, 1], c=[col], s=16,
                    edgecolor='k', marker='o', label=f'clustering {k}' if k != -1 else 'noise')

        # 如果有中心点,绘制它们
        if centers is not None:
            plt.scatter(centers[:, 0], centers[:, 1], c='red', s=100,
                    alpha=0.8, marker='X', label='center')

        plt.title(title)
        plt.xlabel('f 1')
        plt.ylabel('f 2')
        plt.legend()
        plt.grid(True)
        plt.show()
三、实验结果
1、实验参数
生成数据:n_samples=500, noise=0.08
模型参数:eps=0.2, min_samples=5
2、实验结果
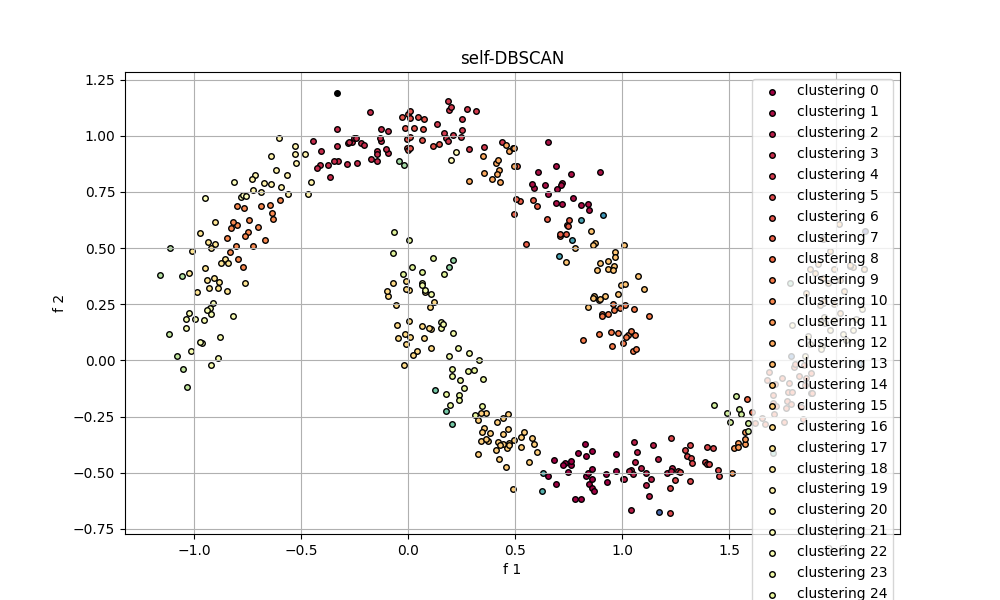
自设计模型
标准模型:skDBSCAN(eps=0.2, min_samples=5)
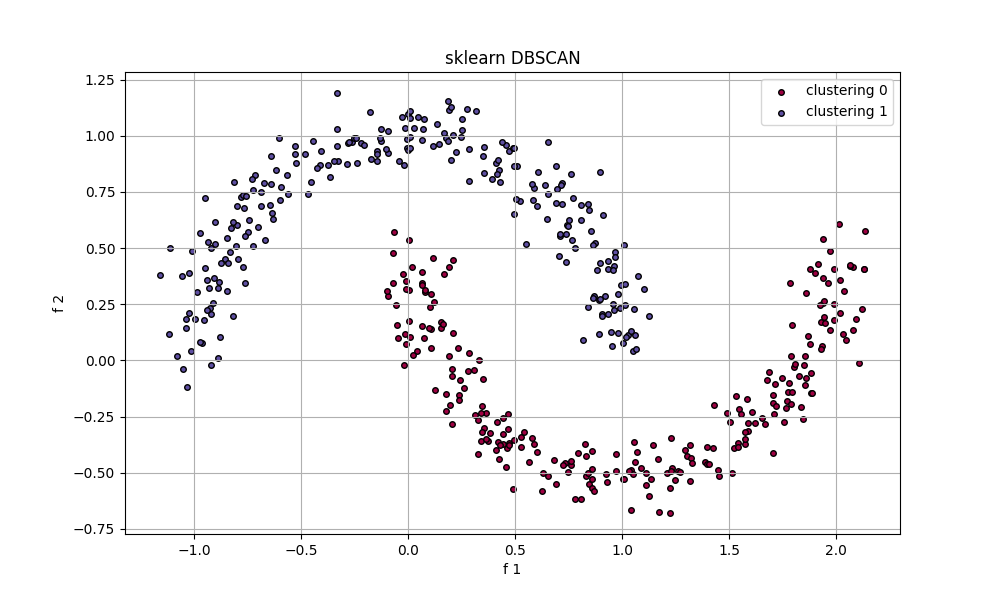
由此可以看出,自设计模型和标准模型存在一定的差距。
3、模型改进
将扩展簇函数修改为,并去除调用时的多余参数。
python
def _expand_cluster(self, neighborhoods, visited, index, cluster_id):
    """
    优化后的扩展簇实现
    """
    queue = deque([index])
    visited[index] = True
    self.labels_[index] = cluster_id

    while queue:
        current = queue.popleft()
        for neighbor in neighborhoods[current]:
            if not visited[neighbor]:
                visited[neighbor] = True
                # 如果是核心点,加入队列继续扩展
                if len(neighborhoods[neighbor]) >= self.min_samples:
                    queue.append(neighbor)
                # 无论是否核心点,均加入当前簇(覆盖噪声和未访问点)
                self.labels_[neighbor] = cluster_id
原本的扩展簇函数并没有涉及簇合并,所以结果簇有很多。修改后,
生成数据:n_samples=500, noise=0.08
模型参数:eps=0.2, min_samples=5
模型结果:
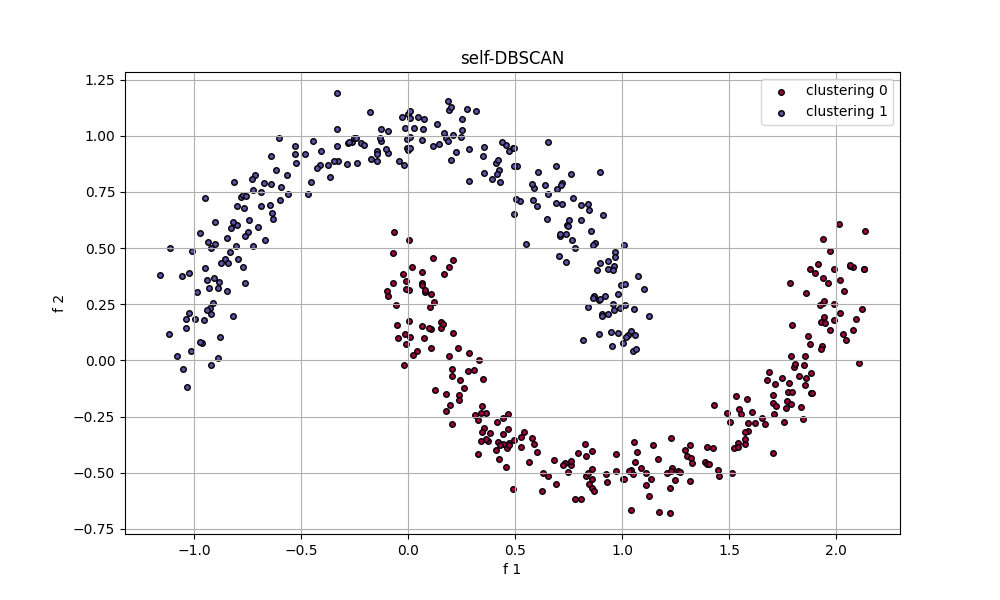
由此可见,自设计模型在聚类上和标准模型在"moons"类型的数据集上的聚类效果无明显差别,能正确地用来了解算法原理。