Mean Shift算法是一种基于密度梯度的非参数化目标跟踪方法,特别适合实时视频跟踪。
matlab
function mean_shift_tracking_demo()
    % 主函数:Mean Shift目标跟踪演示
    clear; clc; close all;

    % 参数设置
    video_source = 'camera';  % 可选 'video' 或 'camera'
    roi_size = [64, 64];      % 初始目标区域大小
    num_bins = 16;            % 颜色直方图bin数量
    stop_threshold = 0.1;     % 停止迭代阈值
    max_iterations = 20;      % 最大迭代次数

    % 加载视频源
    if strcmp(video_source, 'video')
        vid_reader = VideoReader('walking.mp4'); % 替换为你的视频文件
    else
        vid_reader = webcam(); % 使用摄像头
    end

    % 读取第一帧并选择目标区域
    frame = readFrame(vid_reader);
    if size(frame, 3) == 1
        frame = repmat(frame, [1, 1, 3]); % 转为RGB
    end

    figure('Name', '目标选择', 'NumberTitle', 'off');
    imshow(frame);
    title('请用鼠标选择目标区域');
    roi = round(getPosition(imrect));
    close;

    % 提取目标区域
    target_region = imcrop(frame, roi);
    [center_y, center_x] = deal(roi(2)+roi(4)/2, roi(1)+roi(3)/2);
    position = [center_x, center_y, roi(3), roi(4)];

    % 计算目标模型(颜色直方图)
    target_model = compute_histogram(target_region, num_bins);

    % 创建结果显示窗口
    fig_handle = figure('Name', 'Mean Shift目标跟踪', 'NumberTitle', 'off', ...
                        'Position', [100, 100, 1200, 500]);

    % 主循环
    while hasFrame(vid_reader)
        % 读取新帧
        frame = readFrame(vid_reader);
        if isempty(frame), break; end
        if size(frame, 3) == 1
            frame = repmat(frame, [1, 1, 3]); % 转为RGB
        end

        % 执行Mean Shift跟踪
        [position, weights] = mean_shift_track(frame, target_model, position, ...
                                               num_bins, stop_threshold, max_iterations);

        % 可视化结果
        visualize_results(fig_handle, frame, position, target_region, weights);

        % 更新目标模型(可选,使跟踪更适应目标变化)
        if mod(floor(vid_reader.CurrentTime*10), 5) == 0
            new_target = imcrop(frame, [position(1)-position(3)/2, position(2)-position(4)/2, position(3), position(4)]);
            target_model = 0.9*target_model + 0.1*compute_histogram(new_target, num_bins);
        end

        % 控制播放速度
        pause(0.05);
    end

    % 释放资源
    if strcmp(video_source, 'camera')
        clear vid_reader;
    else
        release(vid_reader);
    end
end

function model = compute_histogram(region, num_bins)
    % 计算图像区域的颜色直方图
    region = im2double(region);

    % 转换到HSV空间(对光照变化更鲁棒)
    hsv_region = rgb2hsv(region);
    hue = hsv_region(:,:,1);  % 色调分量

    % 将色调值映射到0-1范围
    hue = hue * 360; % 转换为角度
    hue(hue > 360) = hue(hue > 360) - 360;
    hue = hue / 360;  % 归一化到[0,1)

    % 计算直方图(使用Epanechnikov核加权)
    [rows, cols] = size(hue);
    center_row = ceil(rows/2);
    center_col = ceil(cols/2);

    hist_vals = zeros(1, num_bins);
    bin_width = 1/num_bins;

    for i = 1:rows
        for j = 1:cols
            % 计算到中心的距离(Epanechnikov核)
            dist = sqrt((i-center_row)^2 + (j-center_col)^2);
            kernel_val = max(0, 1 - (dist/(min(rows,cols)/2))^2);

            % 确定bin索引
            bin_idx = floor(hue(i,j) / bin_width) + 1;
            if bin_idx > num_bins, bin_idx = 1; end % 处理边界

            hist_vals(bin_idx) = hist_vals(bin_idx) + kernel_val;
        end
    end

    % 归一化直方图
    model = hist_vals / sum(hist_vals);
end

function [new_pos, weights] = mean_shift_track(frame, target_model, init_pos, num_bins, threshold, max_iter)
    % Mean Shift跟踪核心算法
    pos = init_pos;
    [height, width, ~] = size(frame);

    for iter = 1:max_iter
        % 提取当前搜索窗口
        x = round(pos(1));
        y = round(pos(2));
        w = round(pos(3));
        h = round(pos(4));

        % 确保窗口在图像范围内
        x1 = max(1, x - w/2);
        y1 = max(1, y - h/2);
        x2 = min(width, x + w/2);
        y2 = min(height, y + h/2);

        if x2 <= x1 || y2 <= y1
            break;
        end

        candidate = imcrop(frame, [x1, y1, x2-x1, y2-y1]);
        [cand_h, cand_w, ~] = size(candidate);

        % 计算候选区域直方图
        cand_model = compute_histogram(candidate, num_bins);

        % 计算相似度(Bhattacharyya系数)
        rho = sum(sqrt(target_model .* cand_model));

        % 计算权重图
        weights_map = zeros(cand_h, cand_w);
        hsv_cand = rgb2hsv(im2double(candidate));
        hue = hsv_cand(:,:,1) * 360 / 360; % 归一化色调

        for i = 1:cand_h
            for j = 1:cand_w
                bin_idx = floor(hue(i,j) * num_bins) + 1;
                if bin_idx > num_bins, bin_idx = 1; end

                % 计算权重 (Epanechnikov核)
                dist_x = (j - cand_w/2) / (cand_w/2);
                dist_y = (i - cand_h/2) / (cand_h/2);
                dist = sqrt(dist_x^2 + dist_y^2);
                kernel_val = max(0, 1 - dist^2);

                weights_map(i,j) = kernel_val * sqrt(target_model(bin_idx) / (cand_model(bin_idx) + eps));
            end
        end

        % 计算加权均值(Mean Shift向量)
        total_weight = sum(weights_map(:));
        if total_weight < eps
            break;
        end

        dx = sum(sum(weights_map .* (1:cand_w))) / total_weight - (cand_w+1)/2;
        dy = sum(sum(weights_map .* (1:cand_h)')) / total_weight - (cand_h+1)/2;

        % 更新位置
        new_x = x + dx;
        new_y = y + dy;

        % 检查收敛条件
        shift = sqrt(dx^2 + dy^2);
        if shift < threshold
            break;
        end

        pos(1) = new_x;
        pos(2) = new_y;
    end

    new_pos = pos;
    weights = weights_map;
end

function visualize_results(fig, frame, pos, target, weights)
    % 可视化跟踪结果
    figure(fig);
    clf;

    % 显示当前帧
    subplot(1,3,1);
    imshow(frame);
    hold on;
    rectangle('Position', [pos(1)-pos(3)/2, pos(2)-pos(4)/2, pos(3), pos(4)], ...
              'EdgeColor', 'r', 'LineWidth', 2);
    title('当前帧跟踪结果');
    hold off;

    % 显示目标模板
    subplot(1,3,2);
    imshow(target);
    title('目标模板');

    % 显示权重图
    subplot(1,3,3);
    imagesc(weights);
    axis image; colorbar;
    title('Mean Shift权重分布');

    drawnow;
end
算法原理详解
Mean Shift跟踪算法的核心思想是通过迭代寻找目标区域在特征空间中的概率密度峰值:
-
特征表示:使用颜色直方图(通常是HSV空间的色调分量)表示目标外观
-
相似性度量:使用Bhattacharyya系数衡量目标模型和候选区域的相似度
-
Mean Shift向量:计算加权质心偏移,作为新的搜索中心
-
迭代优化:重复计算直到收敛到局部最大值
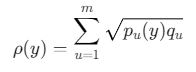
数学表达
给定目标模型 qqq和候选模型 p(y)p(y)p(y),Bhattacharyya系数:
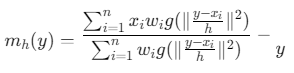
Mean Shift向量:
其中 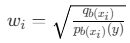
,g(x)是核函数的轮廓函数
算法特点
-
优势:
-
不需要预训练模型
-
对部分遮挡鲁棒
-
计算效率高,适合实时应用
-
自动确定目标尺度(本实现中固定了尺度)
-
-
局限性:
-
对快速运动目标可能丢失
-
对相似颜色干扰敏感
-
需要手动初始化第一帧
参数调优指南
-
颜色空间:
-
HSV/HSL比RGB对光照变化更鲁棒
-
可尝试Lab空间处理阴影
-
-
核函数选择:
-
Epanechnikov核:计算高效
-
高斯核:更平滑但计算量大
-
-
直方图bin数量:
-
太少:区分度不足
-
太多:统计不可靠
-
推荐:8-32个bin
-
-
停止条件:
-
位移阈值:0.1-1.0像素
-
最大迭代:10-20次
参考代码 matlab语言实现的经典Mean shift 目标跟踪算法 www.youwenfan.com/contentcss/122380.html
扩展改进方向
-
多特征融合:
matlab% 结合颜色和纹理特征 function combined_model = combine_features(color_hist, texture_hist, alpha) combined_model = alpha * color_hist + (1-alpha) * texture_hist; end -
尺度自适应:
matlab% 在每次迭代中调整窗口大小 scale_factor = 1 + 0.1 * (current_similarity - previous_similarity); new_size = old_size * scale_factor; -
运动预测:
matlab% 使用Kalman滤波预测目标位置 predicted_pos = kalman_filter(last_pos, velocity); -
背景抑制:
matlab% 使用空间掩码减少背景影响 mask = fspecial('gaussian', [size(region,1), size(region,2)], sigma); weighted_hist = hist_vals .* mask;