粤港澳大湾区气候数据分析及可视化系统
基于 Django + Vue3 + ECharts 的粤港澳大湾区(广东沿海)气候数据可视化分析系统。
项目概述
本系统聚焦粤港澳大湾区内地9市的实时气候数据,支持多维度的气候数据分析、对比与导出。数据来源以 Meteostat 气象数据库为主,以天气后报(tianqihoubao.com)历史数据为补充。
项目结构
climate/
├── backend/                     # Django 后端
│   ├── config/                  # 项目配置
│   │   ├── settings.py         # 主配置文件
│   │   ├── urls.py             # 路由配置
│   │   └── pagination.py       # 分页配置(统一响应格式)
│   ├── apps/
│   │   ├── users/             # 用户模块(注册、登录、个人中心)
│   │   ├── airdata/           # 气候数据模块(核心业务)
│   │   │   ├── models.py      # City, ClimateData, Monthly/YearlySummary, SpiderLog
│   │   │   ├── views.py       # REST API 视图
│   │   │   ├── serializers.py  # 数据序列化器
│   │   │   ├── constants.py    # 常量定义(9市、天气类型)
│   │   │   ├── gba_refresh.py # 数据刷新服务(核心)
│   │   │   ├── meteostat_spider.py    # Meteostat API 数据获取
│   │   │   └── tianqihoubao_spider.py # 天气后报爬虫
│   │   └── analysis/           # 数据分析模块(聚合查询)
│   ├── manage.py
│   └── requirements.txt
├── frontend/                    # Vue 3 前端
│   ├── src/
│   │   ├── api/               # API 客户端
│   │   ├── assets/            # 静态资源(SCSS 主题样式)
│   │   ├── components/
│   │   │   ├── ui/           # 通用 UI 组件
│   │   │   └── Climate3DMap.vue  # 3D GIS 气候地图组件
│   │   ├── router/            # 路由配置
│   │   ├── stores/            # Pinia 状态管理
│   │   ├── utils/             # 工具函数
│   │   └── views/             # 页面组件
│   │       ├── Dashboard.vue         # 数据大屏(含3D地图)
│   │       ├── PredictionAnalysis.vue # 气候预测分析
│   │       └── ...
│   ├── index.html
│   ├── package.json
│   └── vite.config.js
└── README.md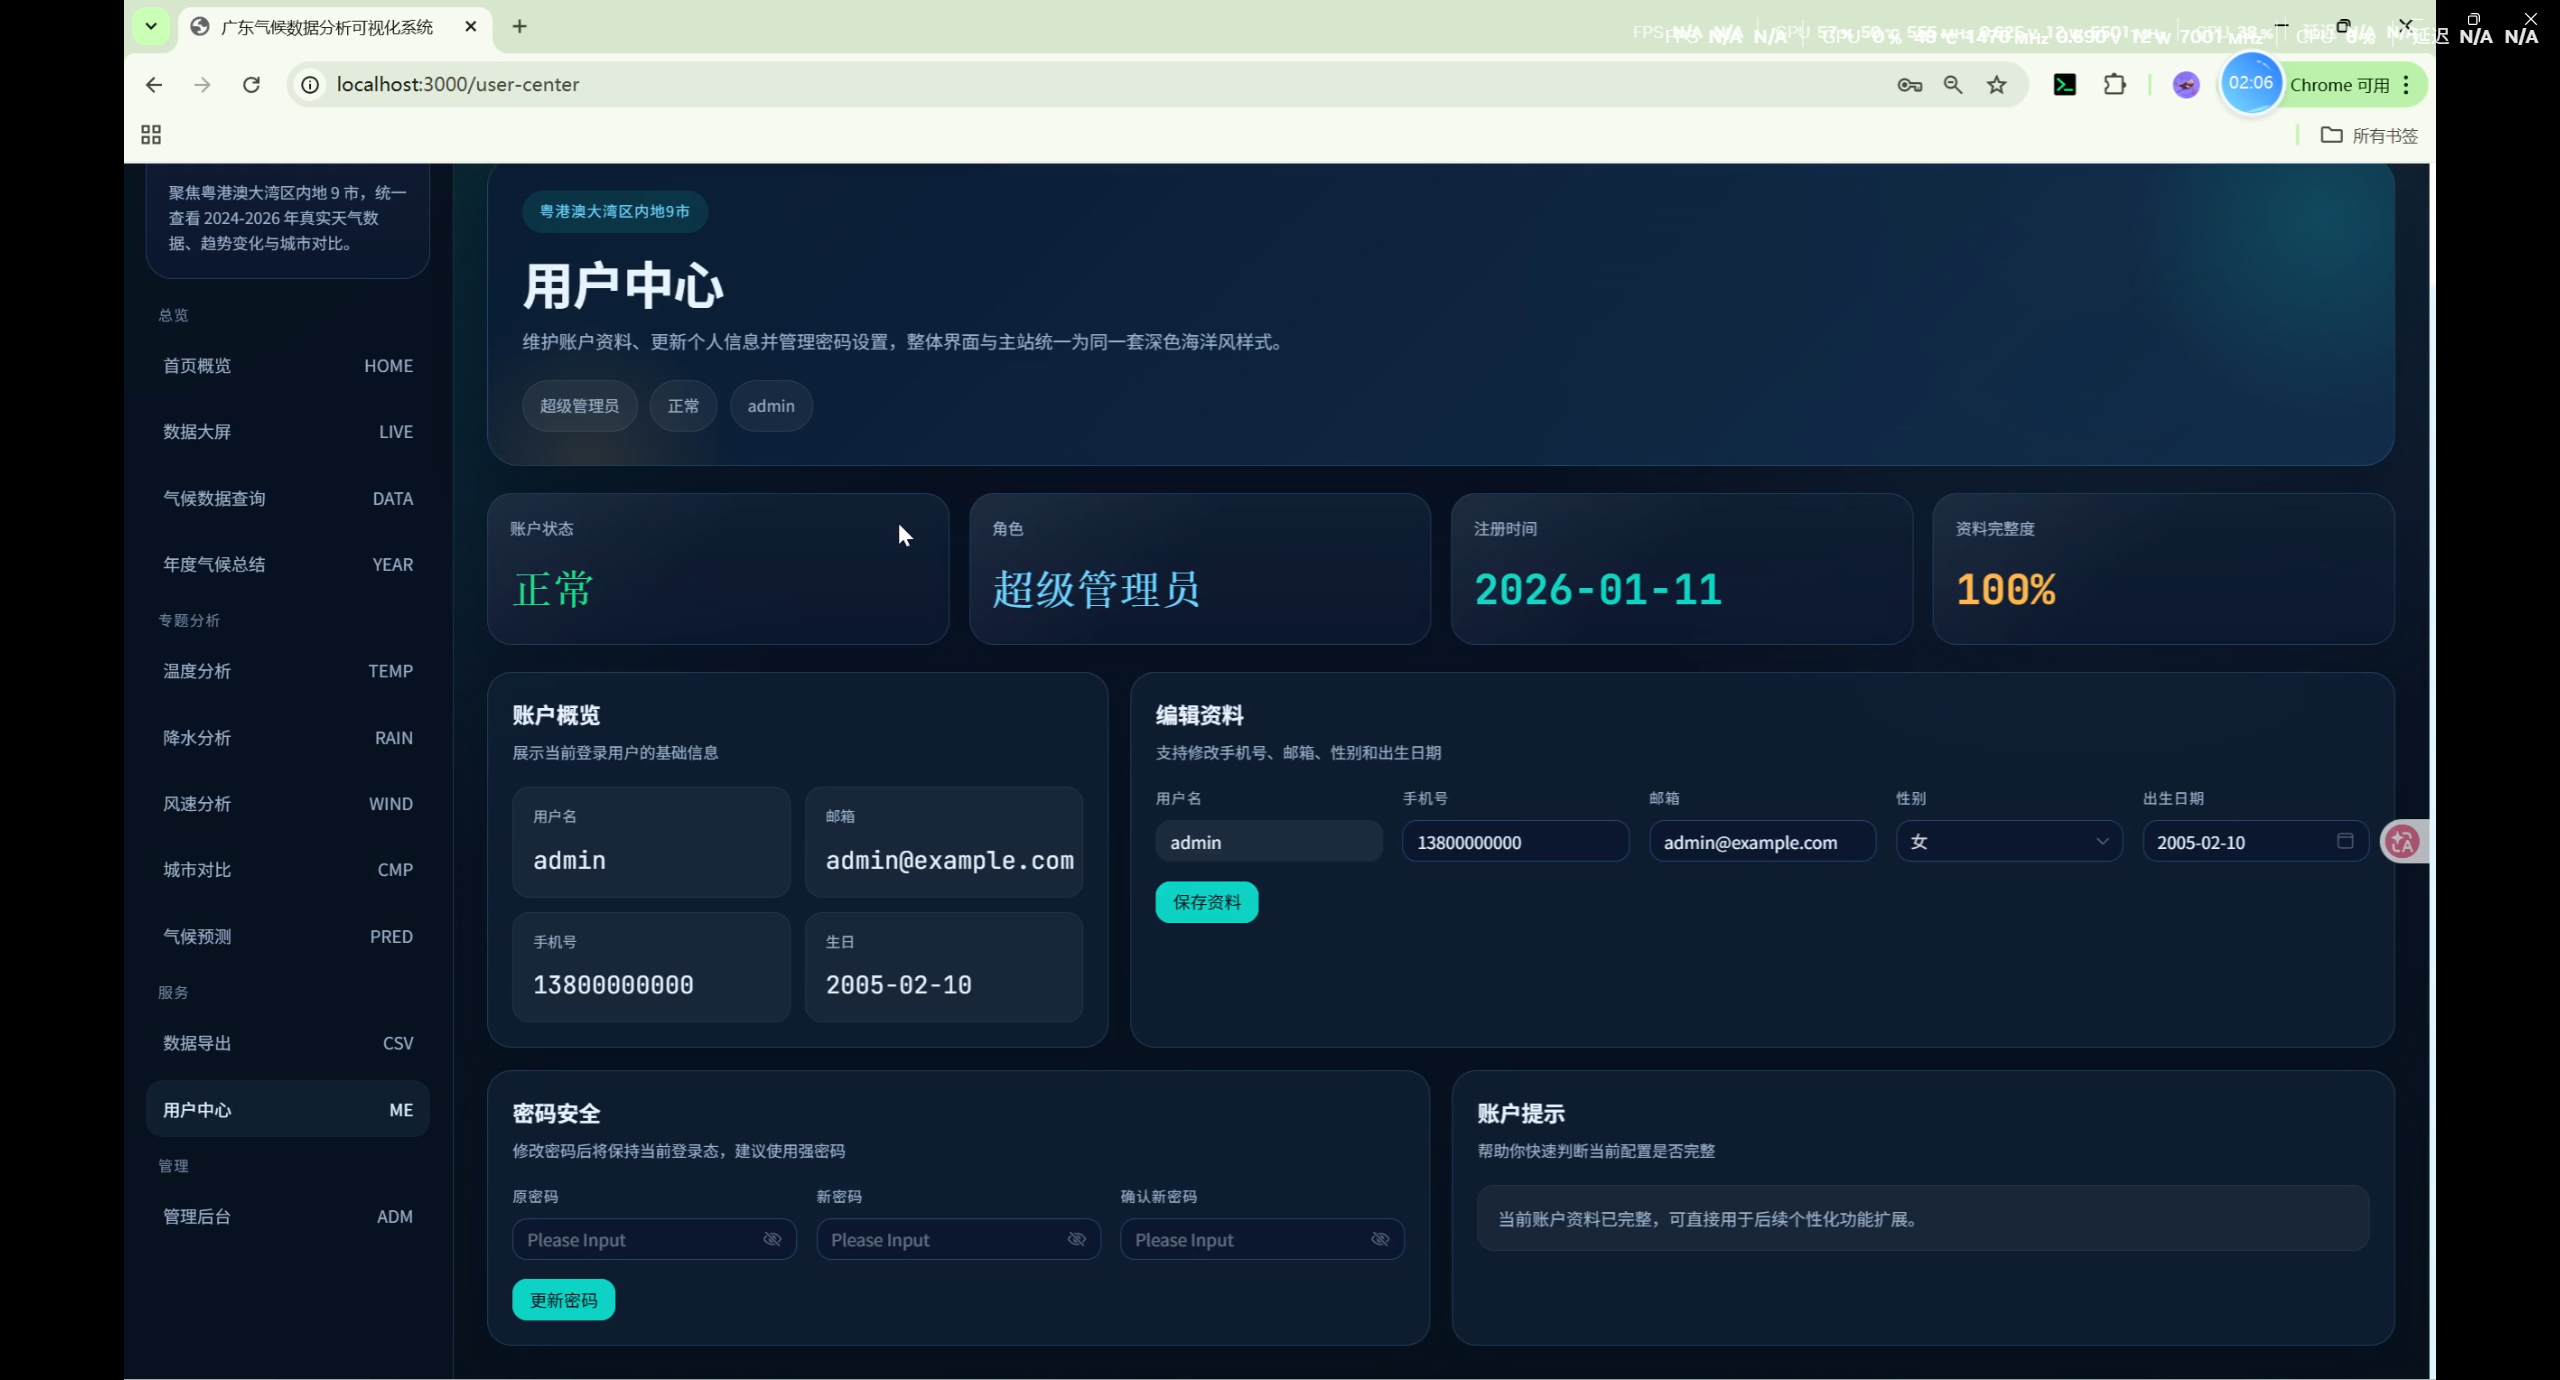
技术栈
后端
| 技术 | 说明 |
|---|---|
| Python 3.8+ | 运行时 |
| Django 3.2+ | Web 框架 |
| Django REST Framework | REST API |
| djangorestframework-simplejwt | JWT 认证 |
| django-cors-headers | 跨域支持 |
| PyMySQL / mysqlclient | MySQL 数据库驱动 |
| requests | HTTP 请求 |
| BeautifulSoup4 | HTML 解析 |
| lxml | XML/HTML 解析器 |
| meteostat | 国际气象数据 API |
| pandas | 数据处理 |
| numpy | 数值计算 |
| Pillow | 图片处理(头像上传) |
| python-dateutil | 日期处理 |
前端
| 技术 | 说明 |
|---|---|
| Vue 3 | 渐进式 JavaScript 框架(<script setup> Composition API) |
| Vite 5 | 构建工具 |
| Naive UI | UI 组件库 |
| ECharts 5 | 数据可视化图表 |
| echarts-gl | ECharts 3D/地理扩展 |
| Pinia | 状态管理 |
| Vue Router 4 | 路由管理 |
| Axios | HTTP 客户端 |
| dayjs | 日期格式化 |
| SCSS | 样式预处理 |
功能模块
用户模块
- 用户注册 / 登录(含日期选择器、状态徽章等 UI 细节优化)
- 个人中心(修改昵称、头像、密码)
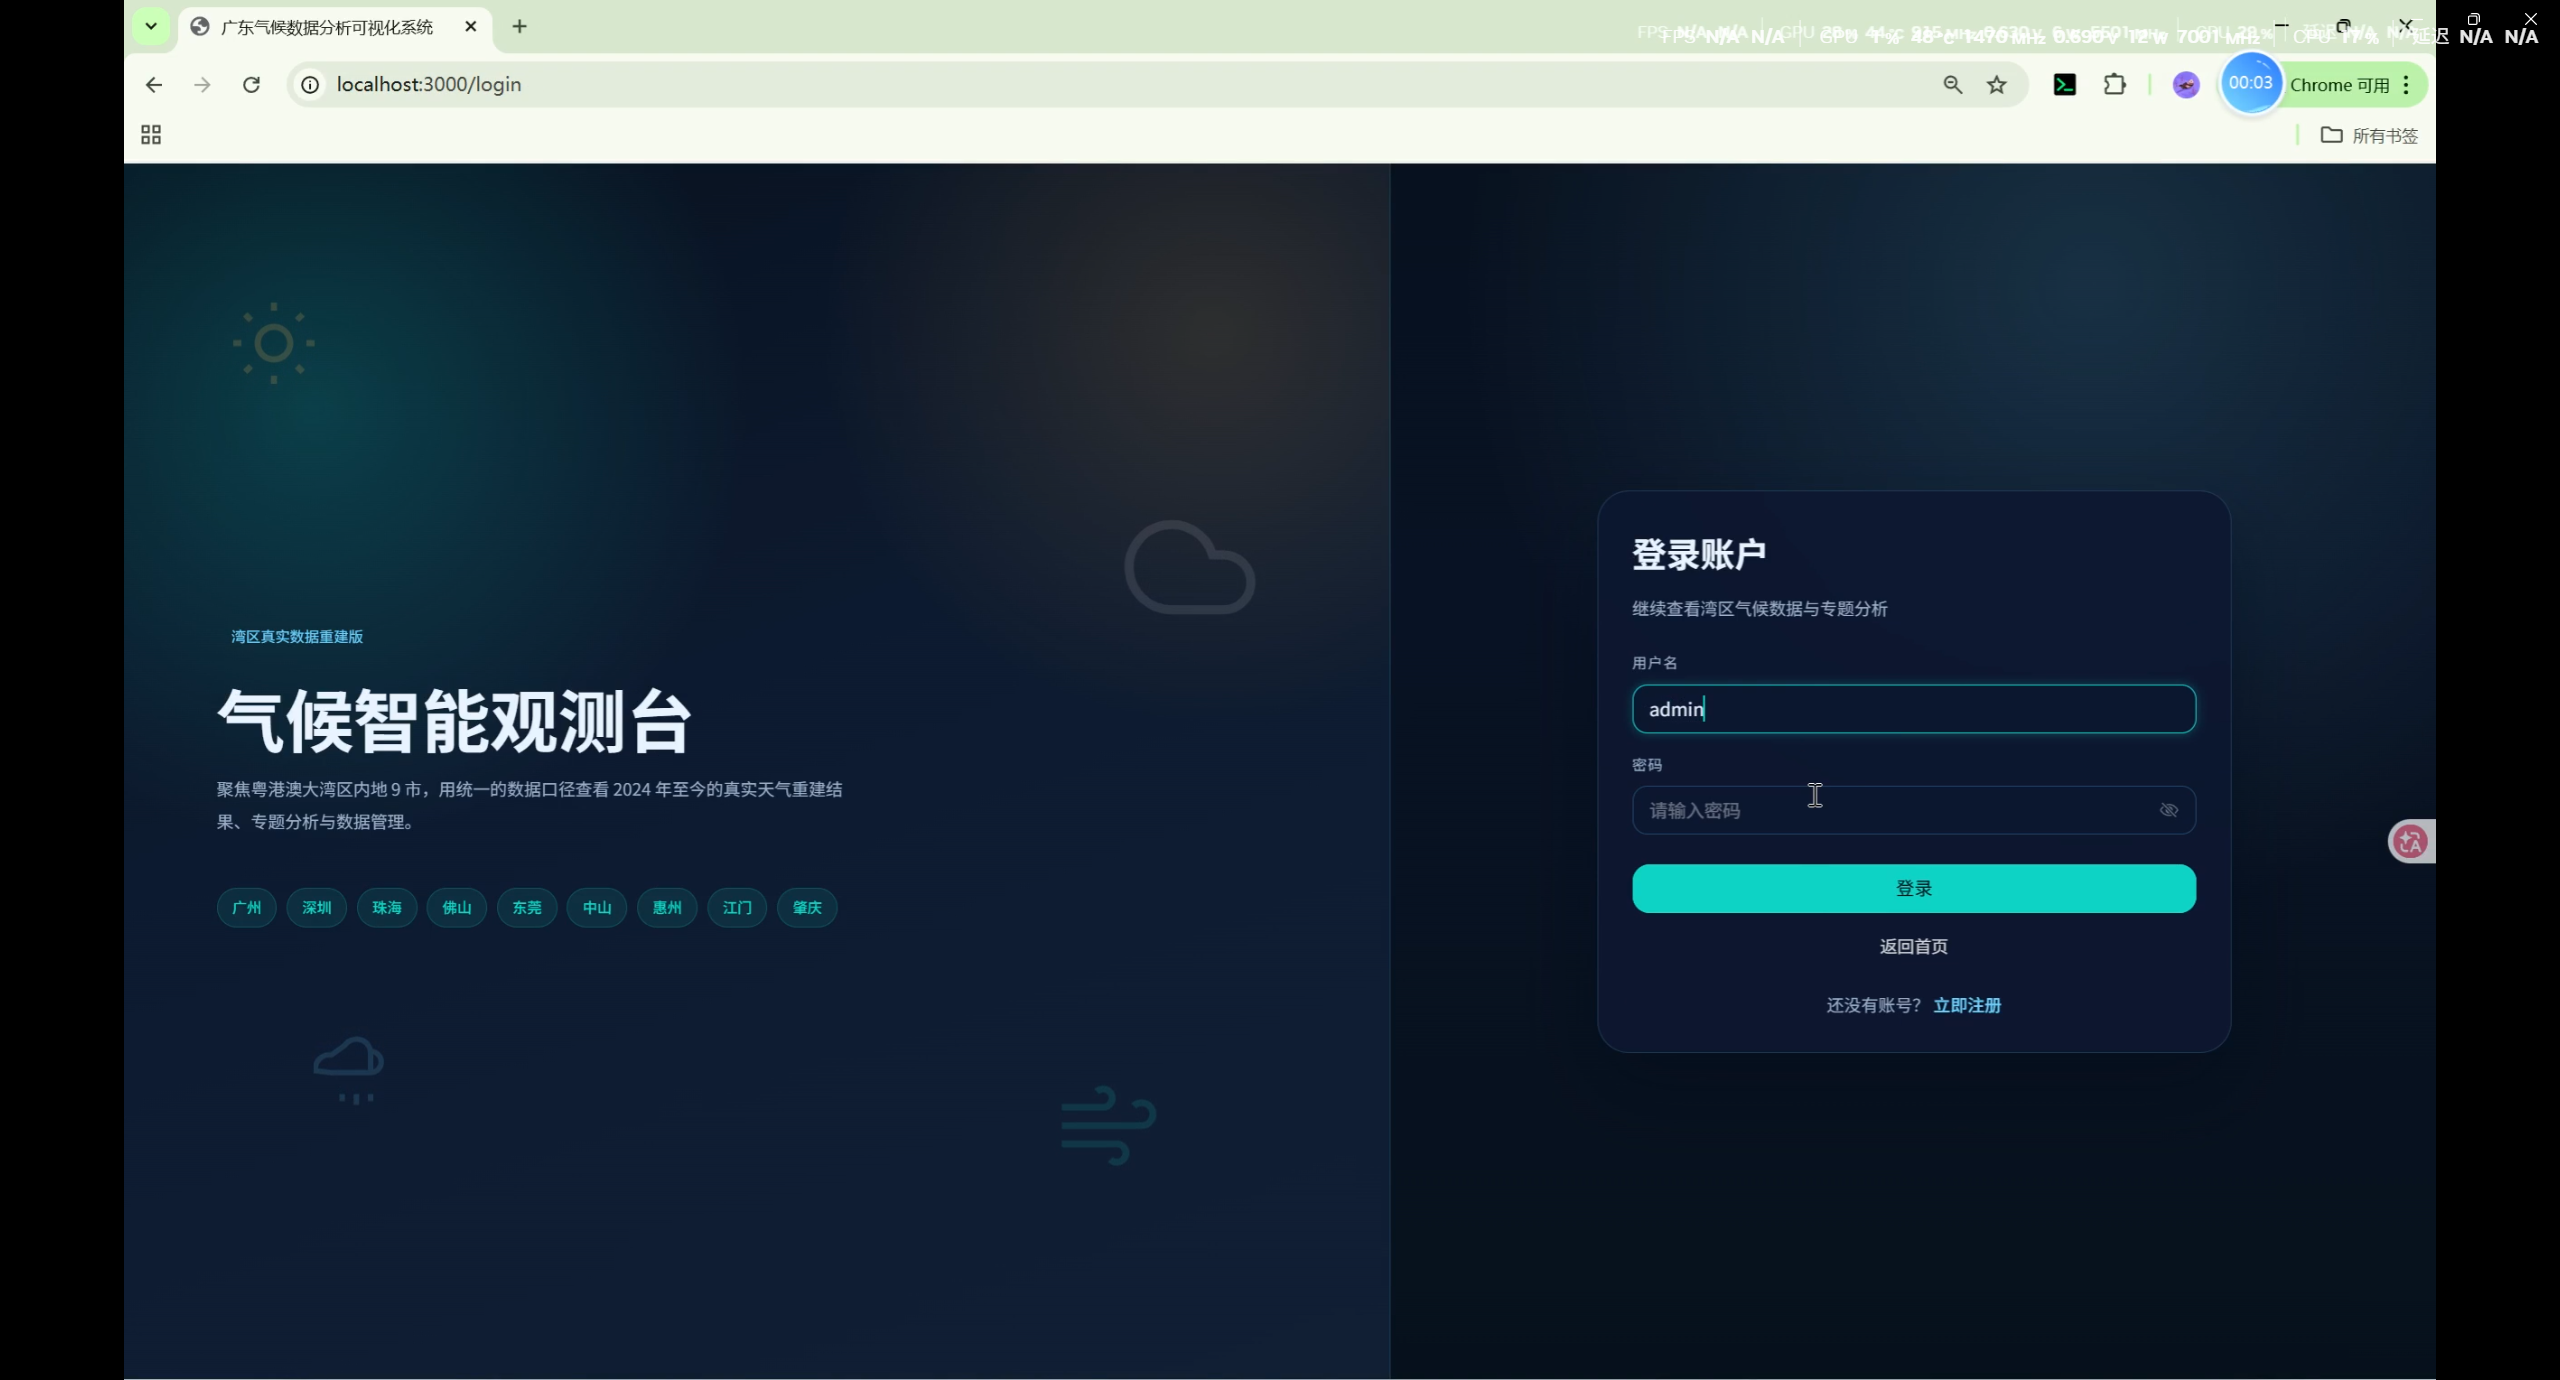
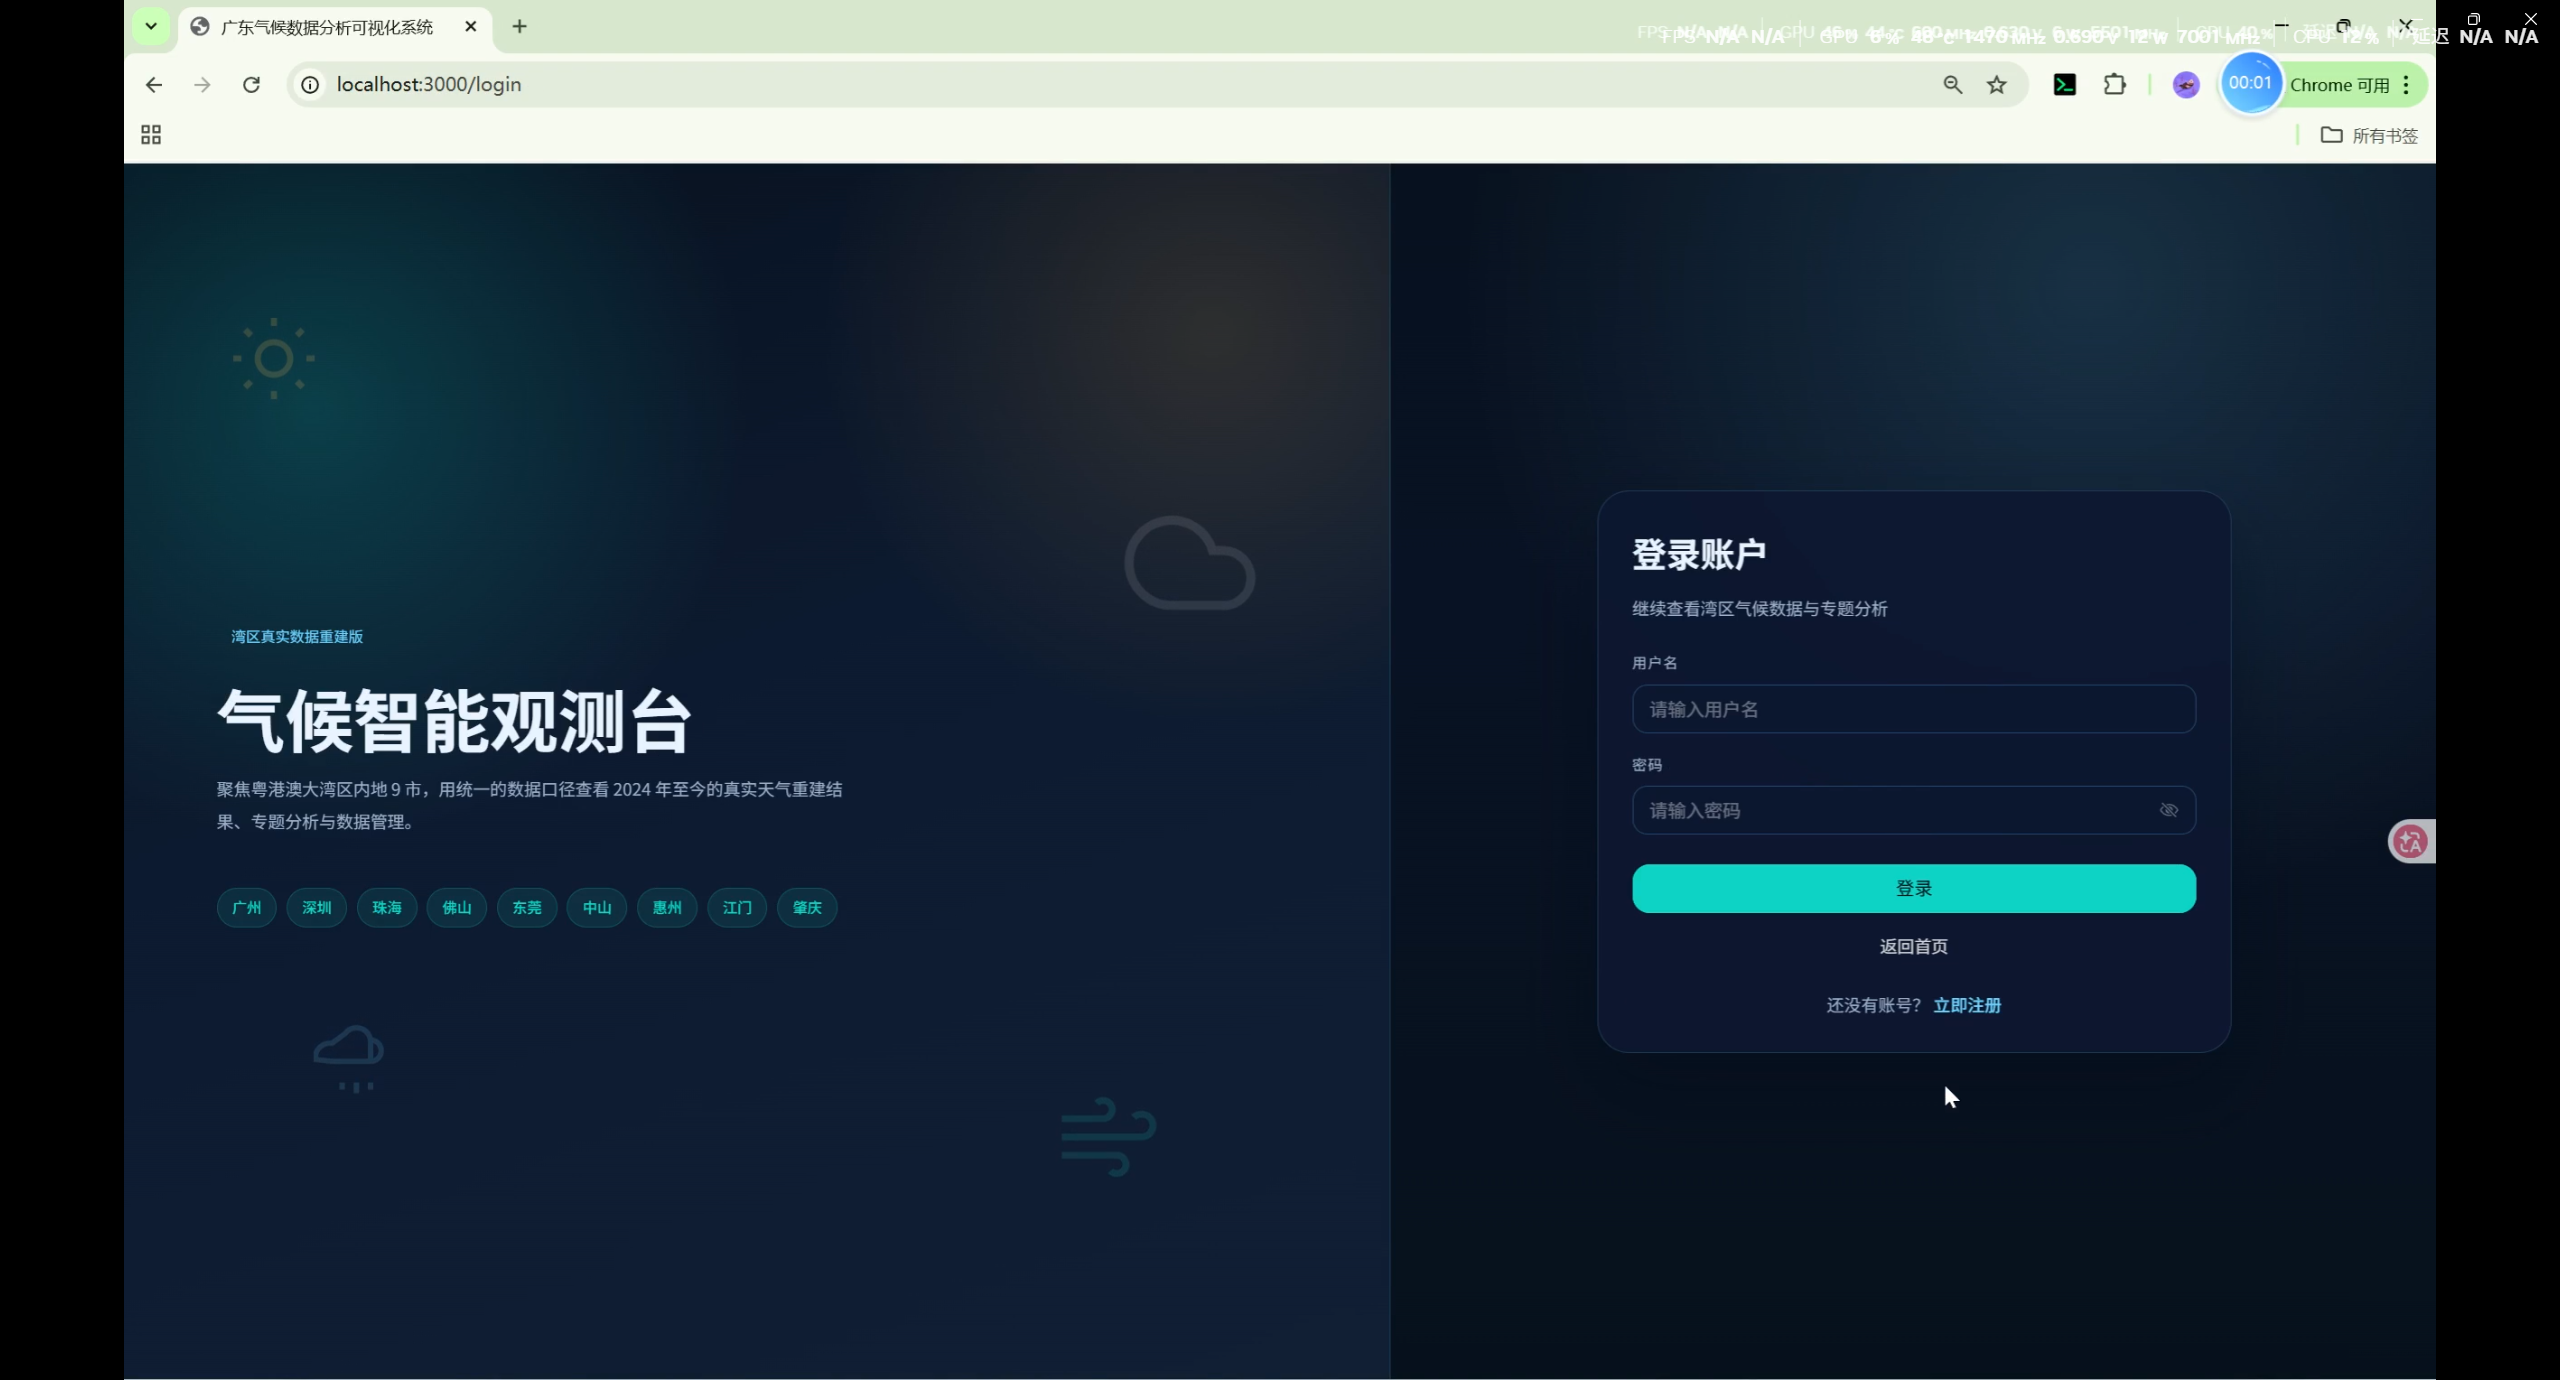
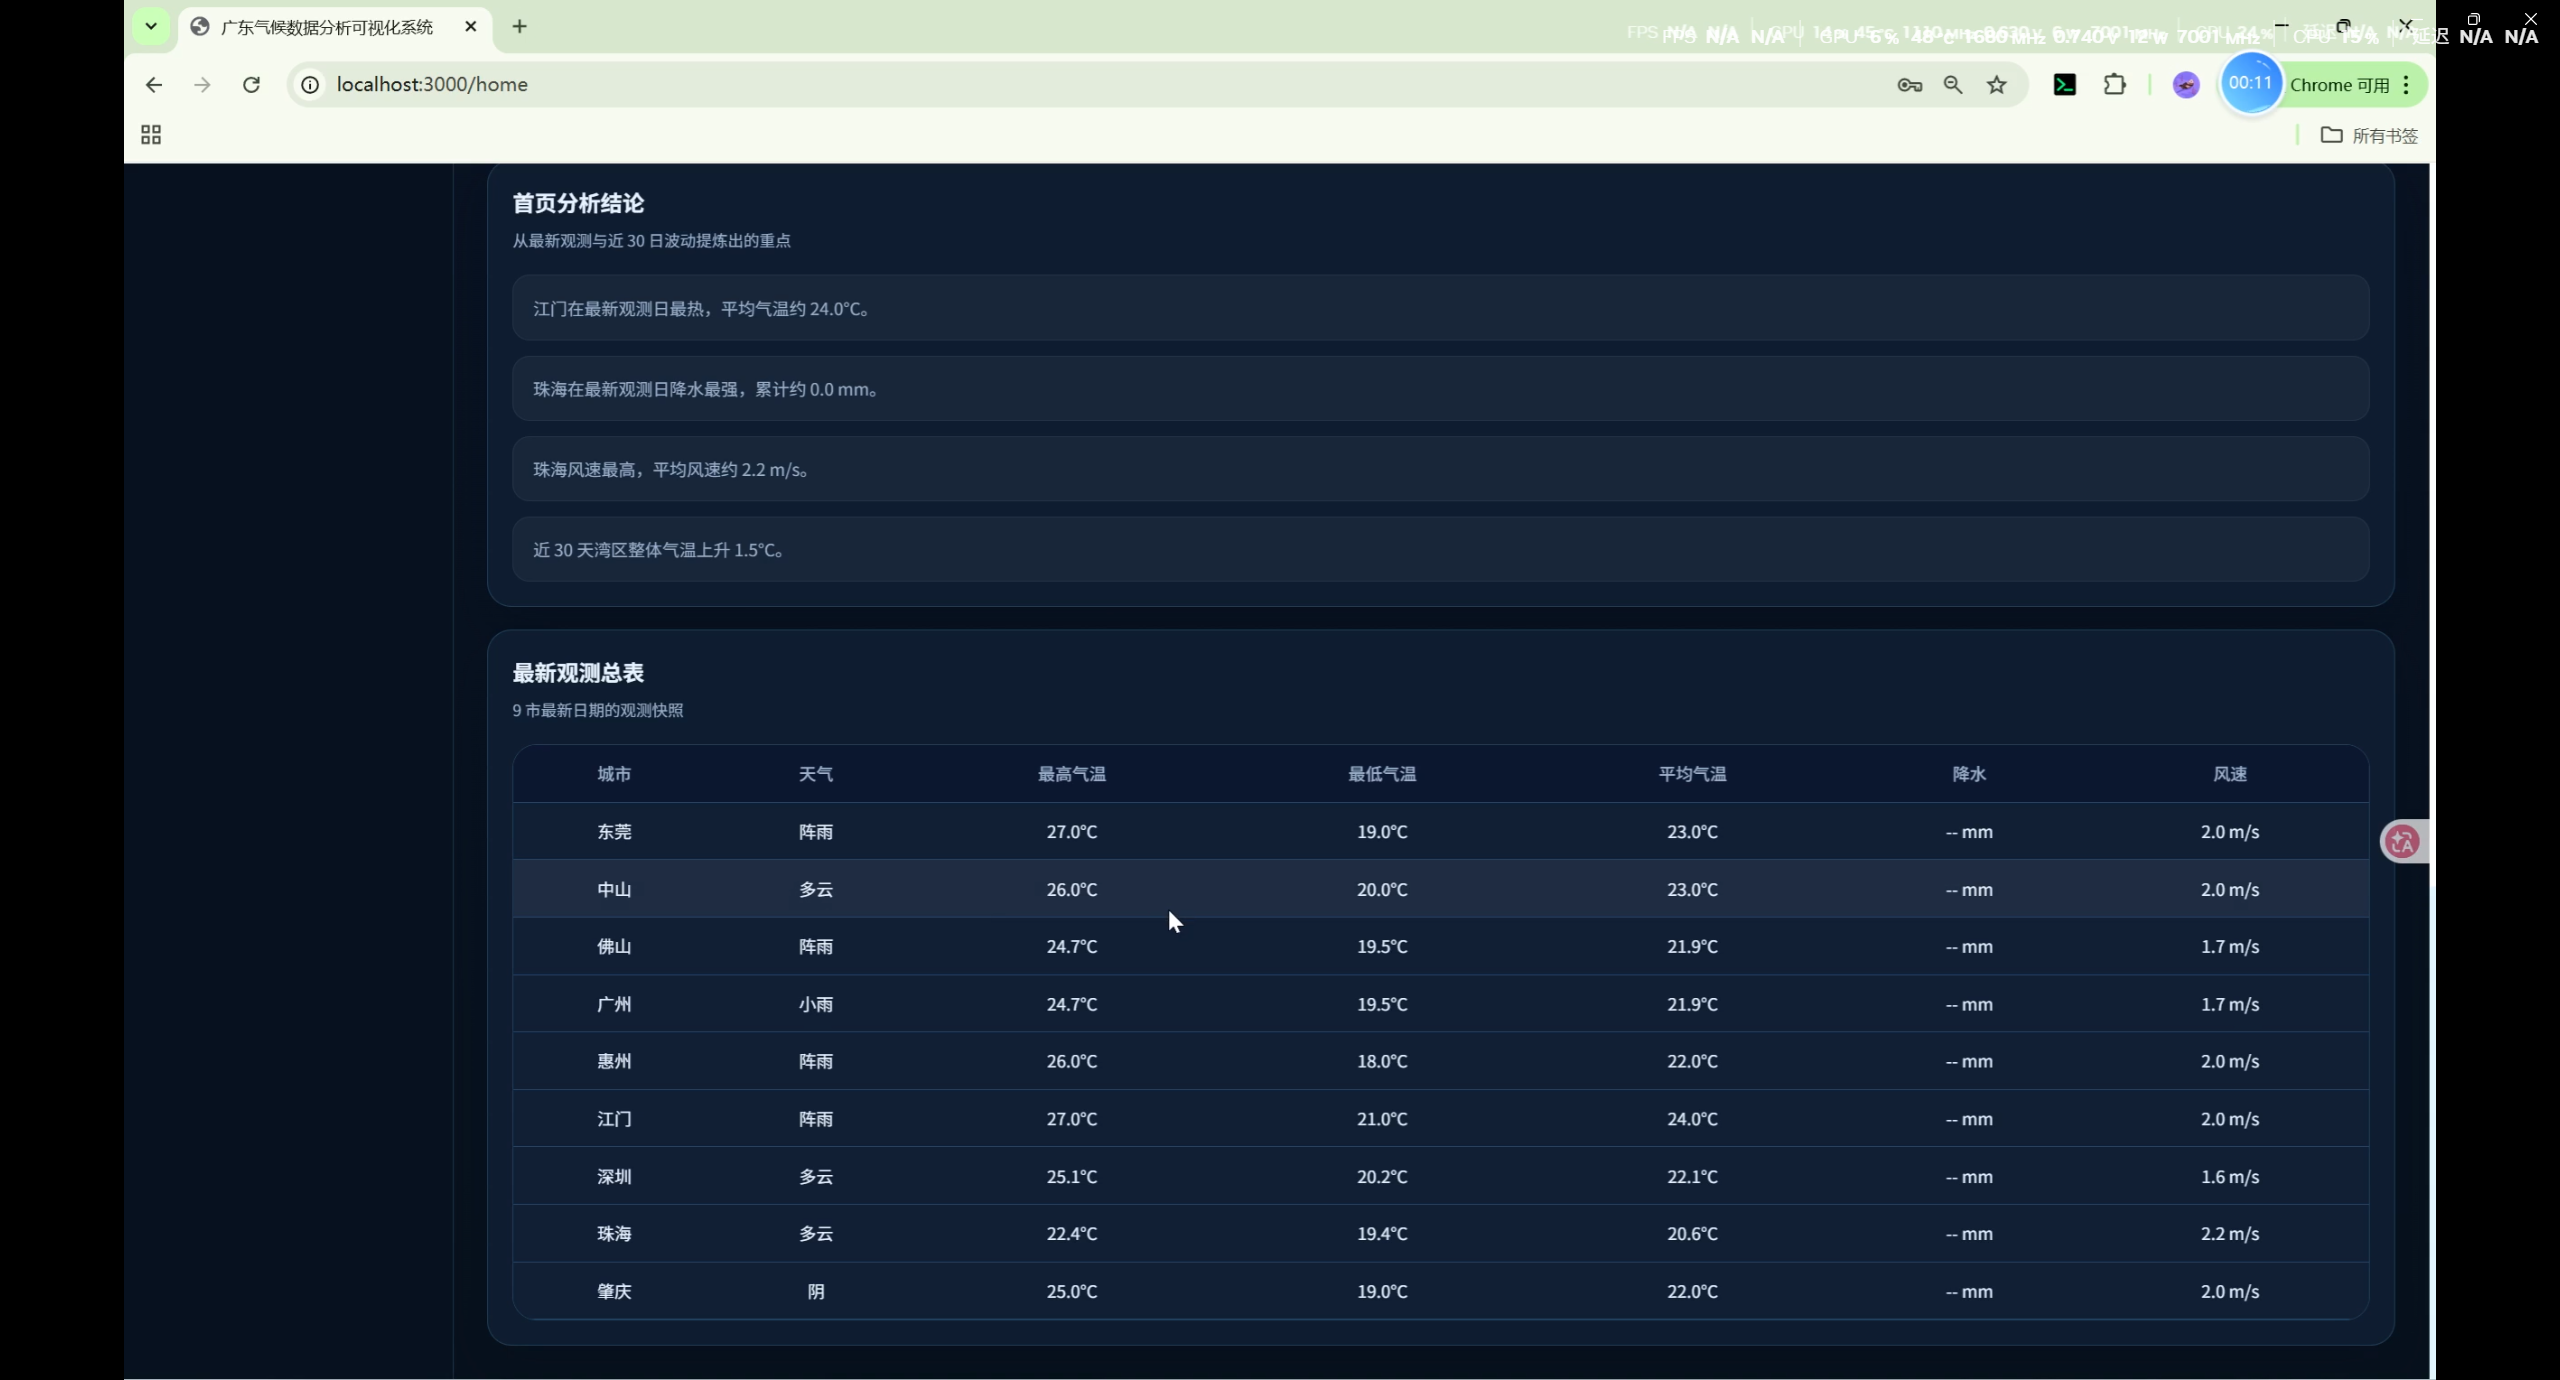
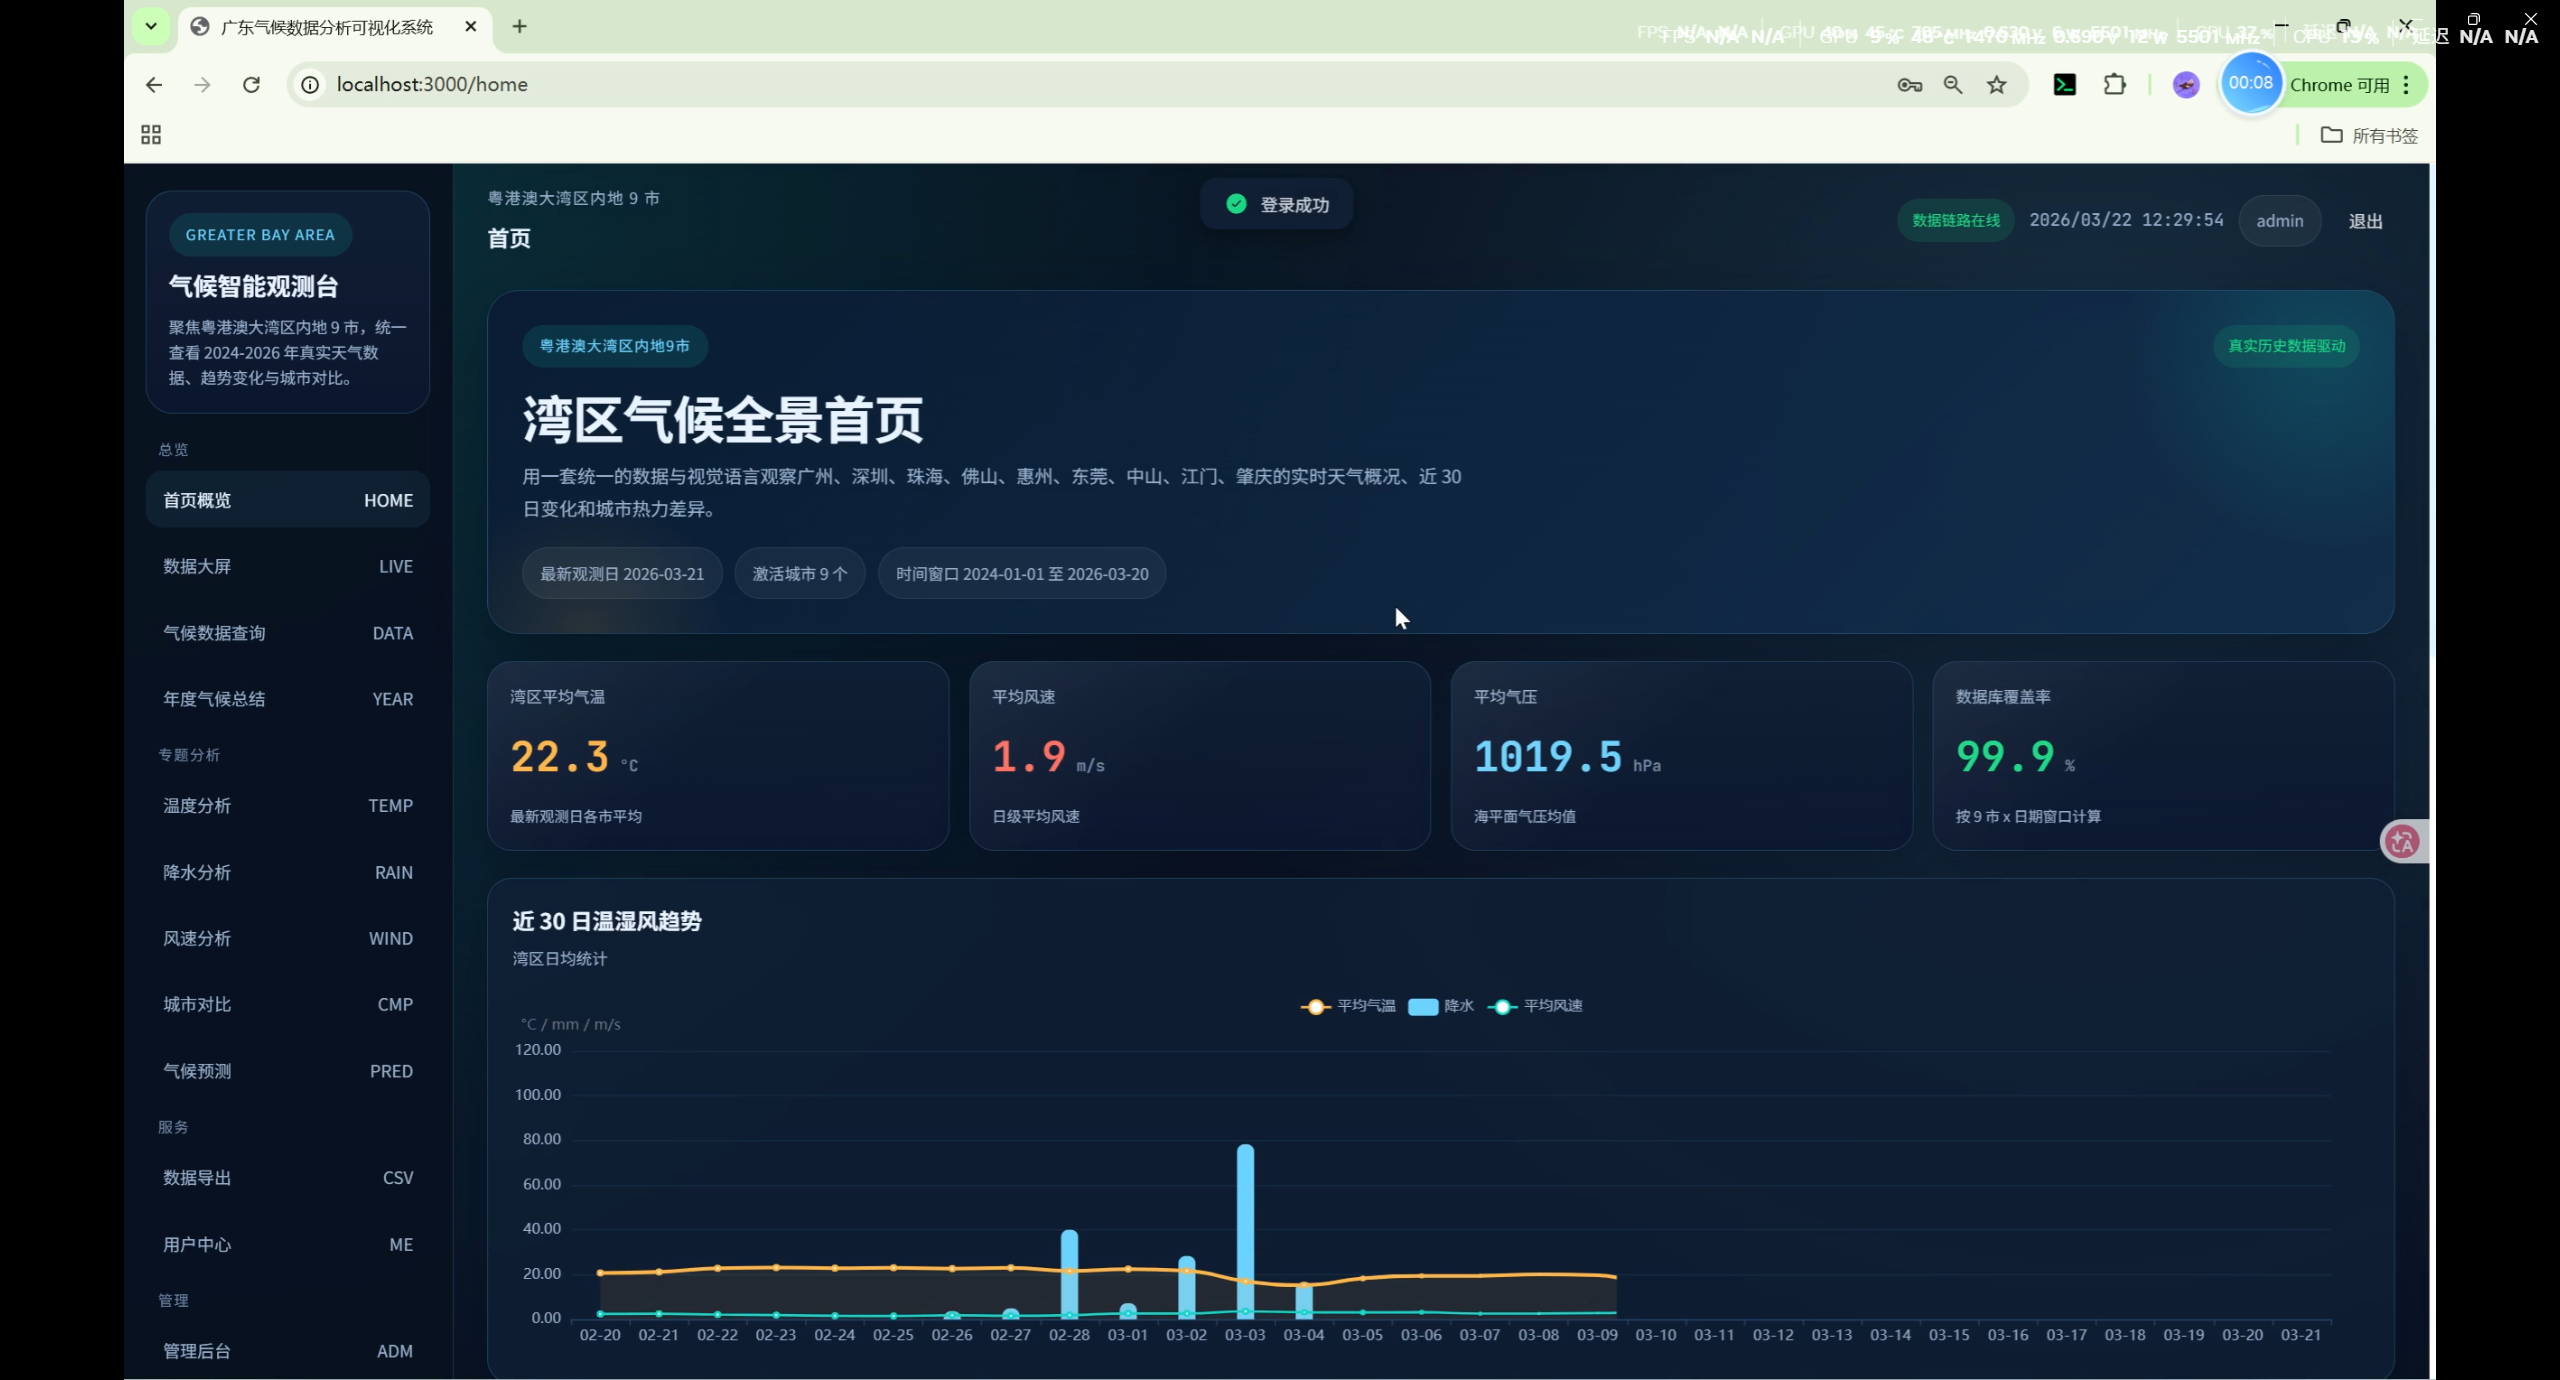
首页(Home)
- 登录入口与系统说明
- 气候数据最新概览卡片
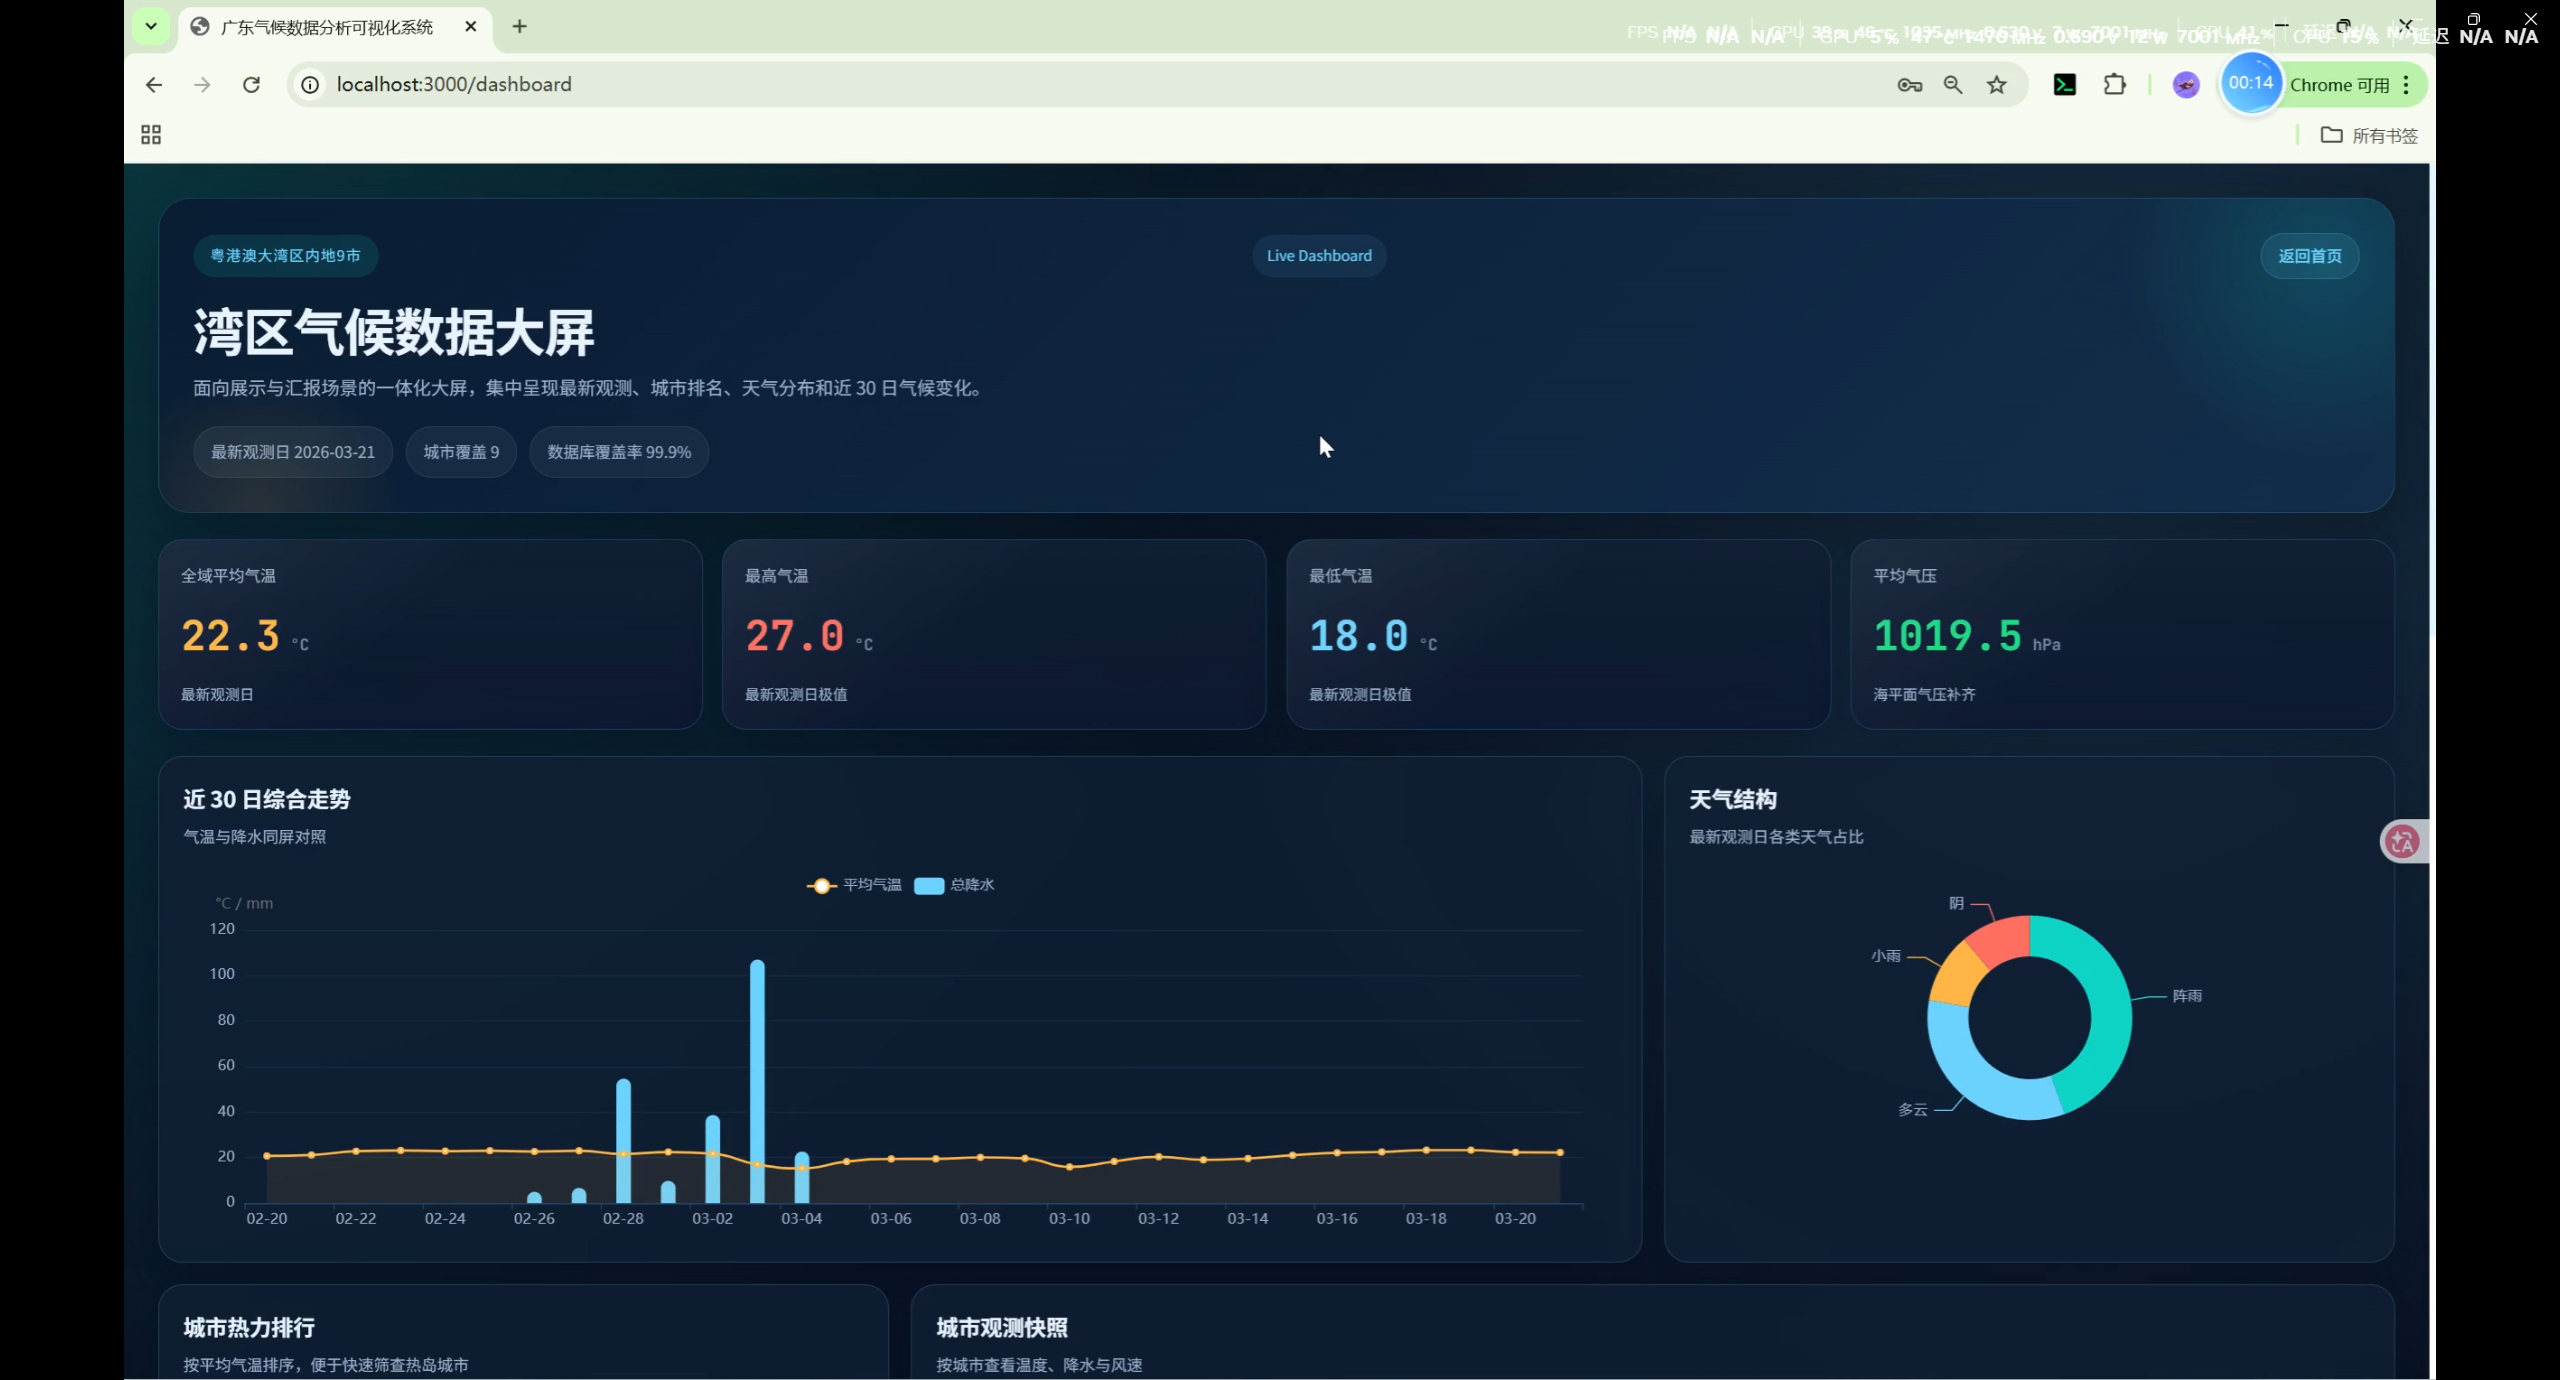
数据大屏(Dashboard)
- 全域平均气温、最高气温、最低气温、气压统计
- 近 30 日气温与降水趋势图(ECharts 双轴图)
- 天气类型分布饼图
- 城市气温热力排行
- 城市观测快照表
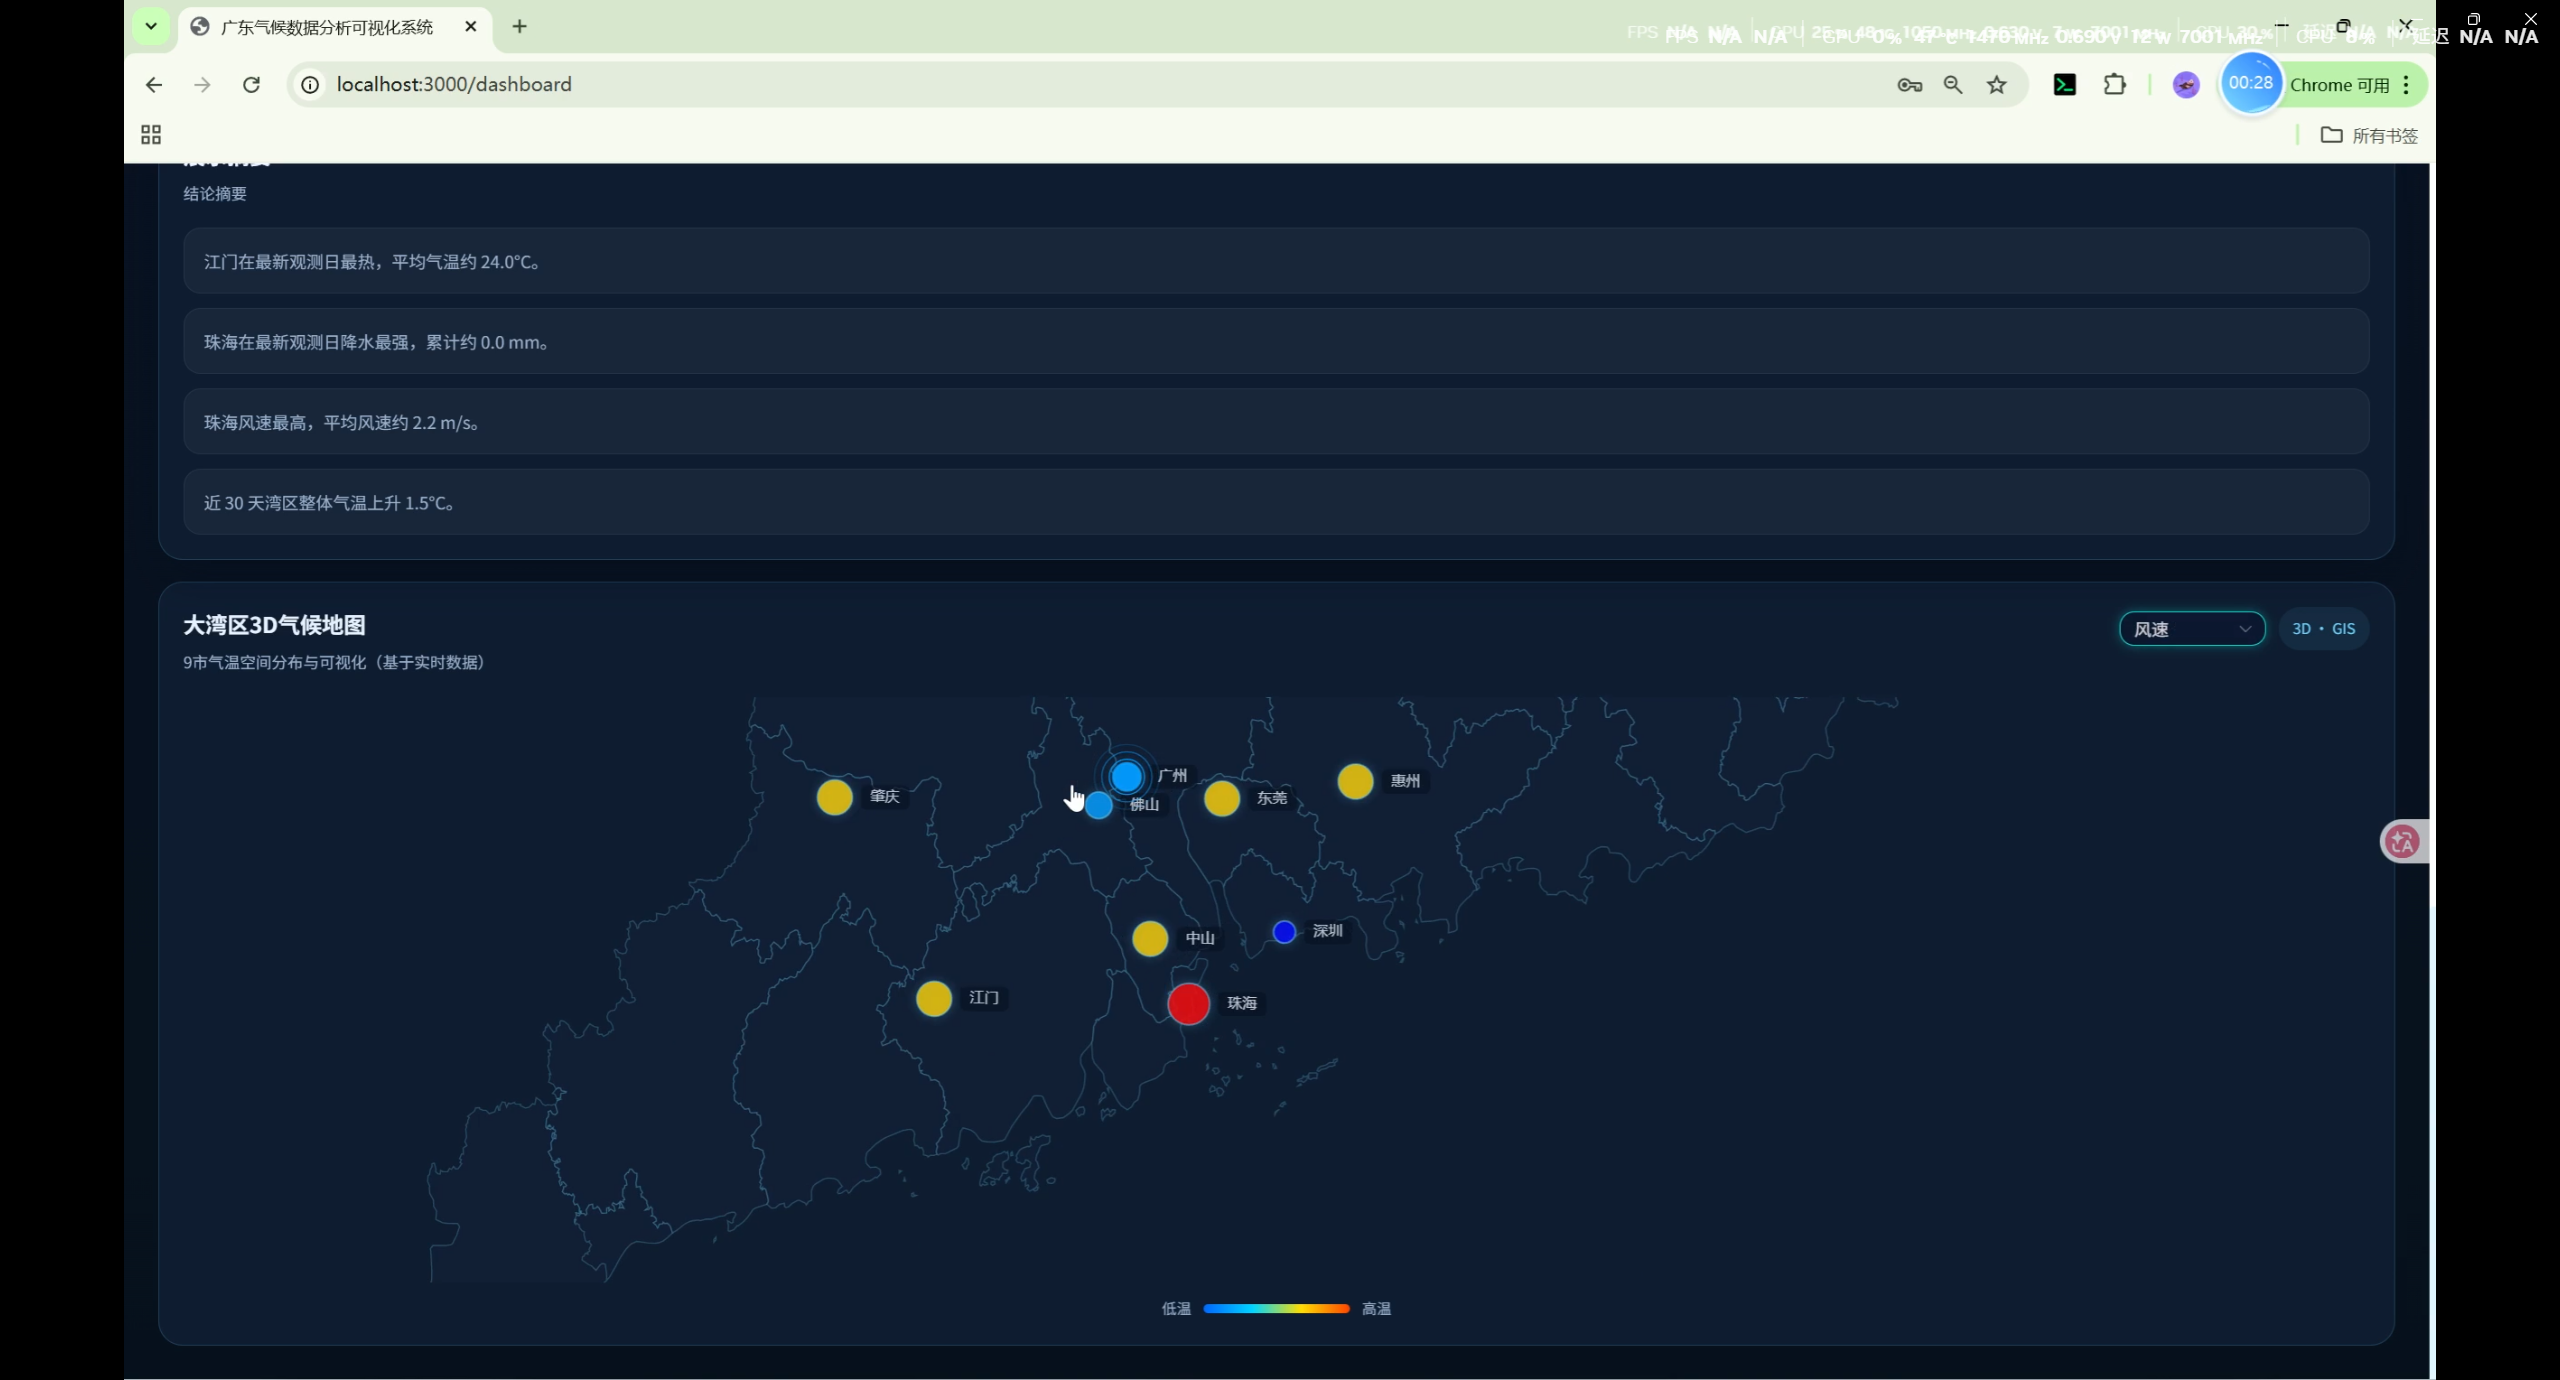
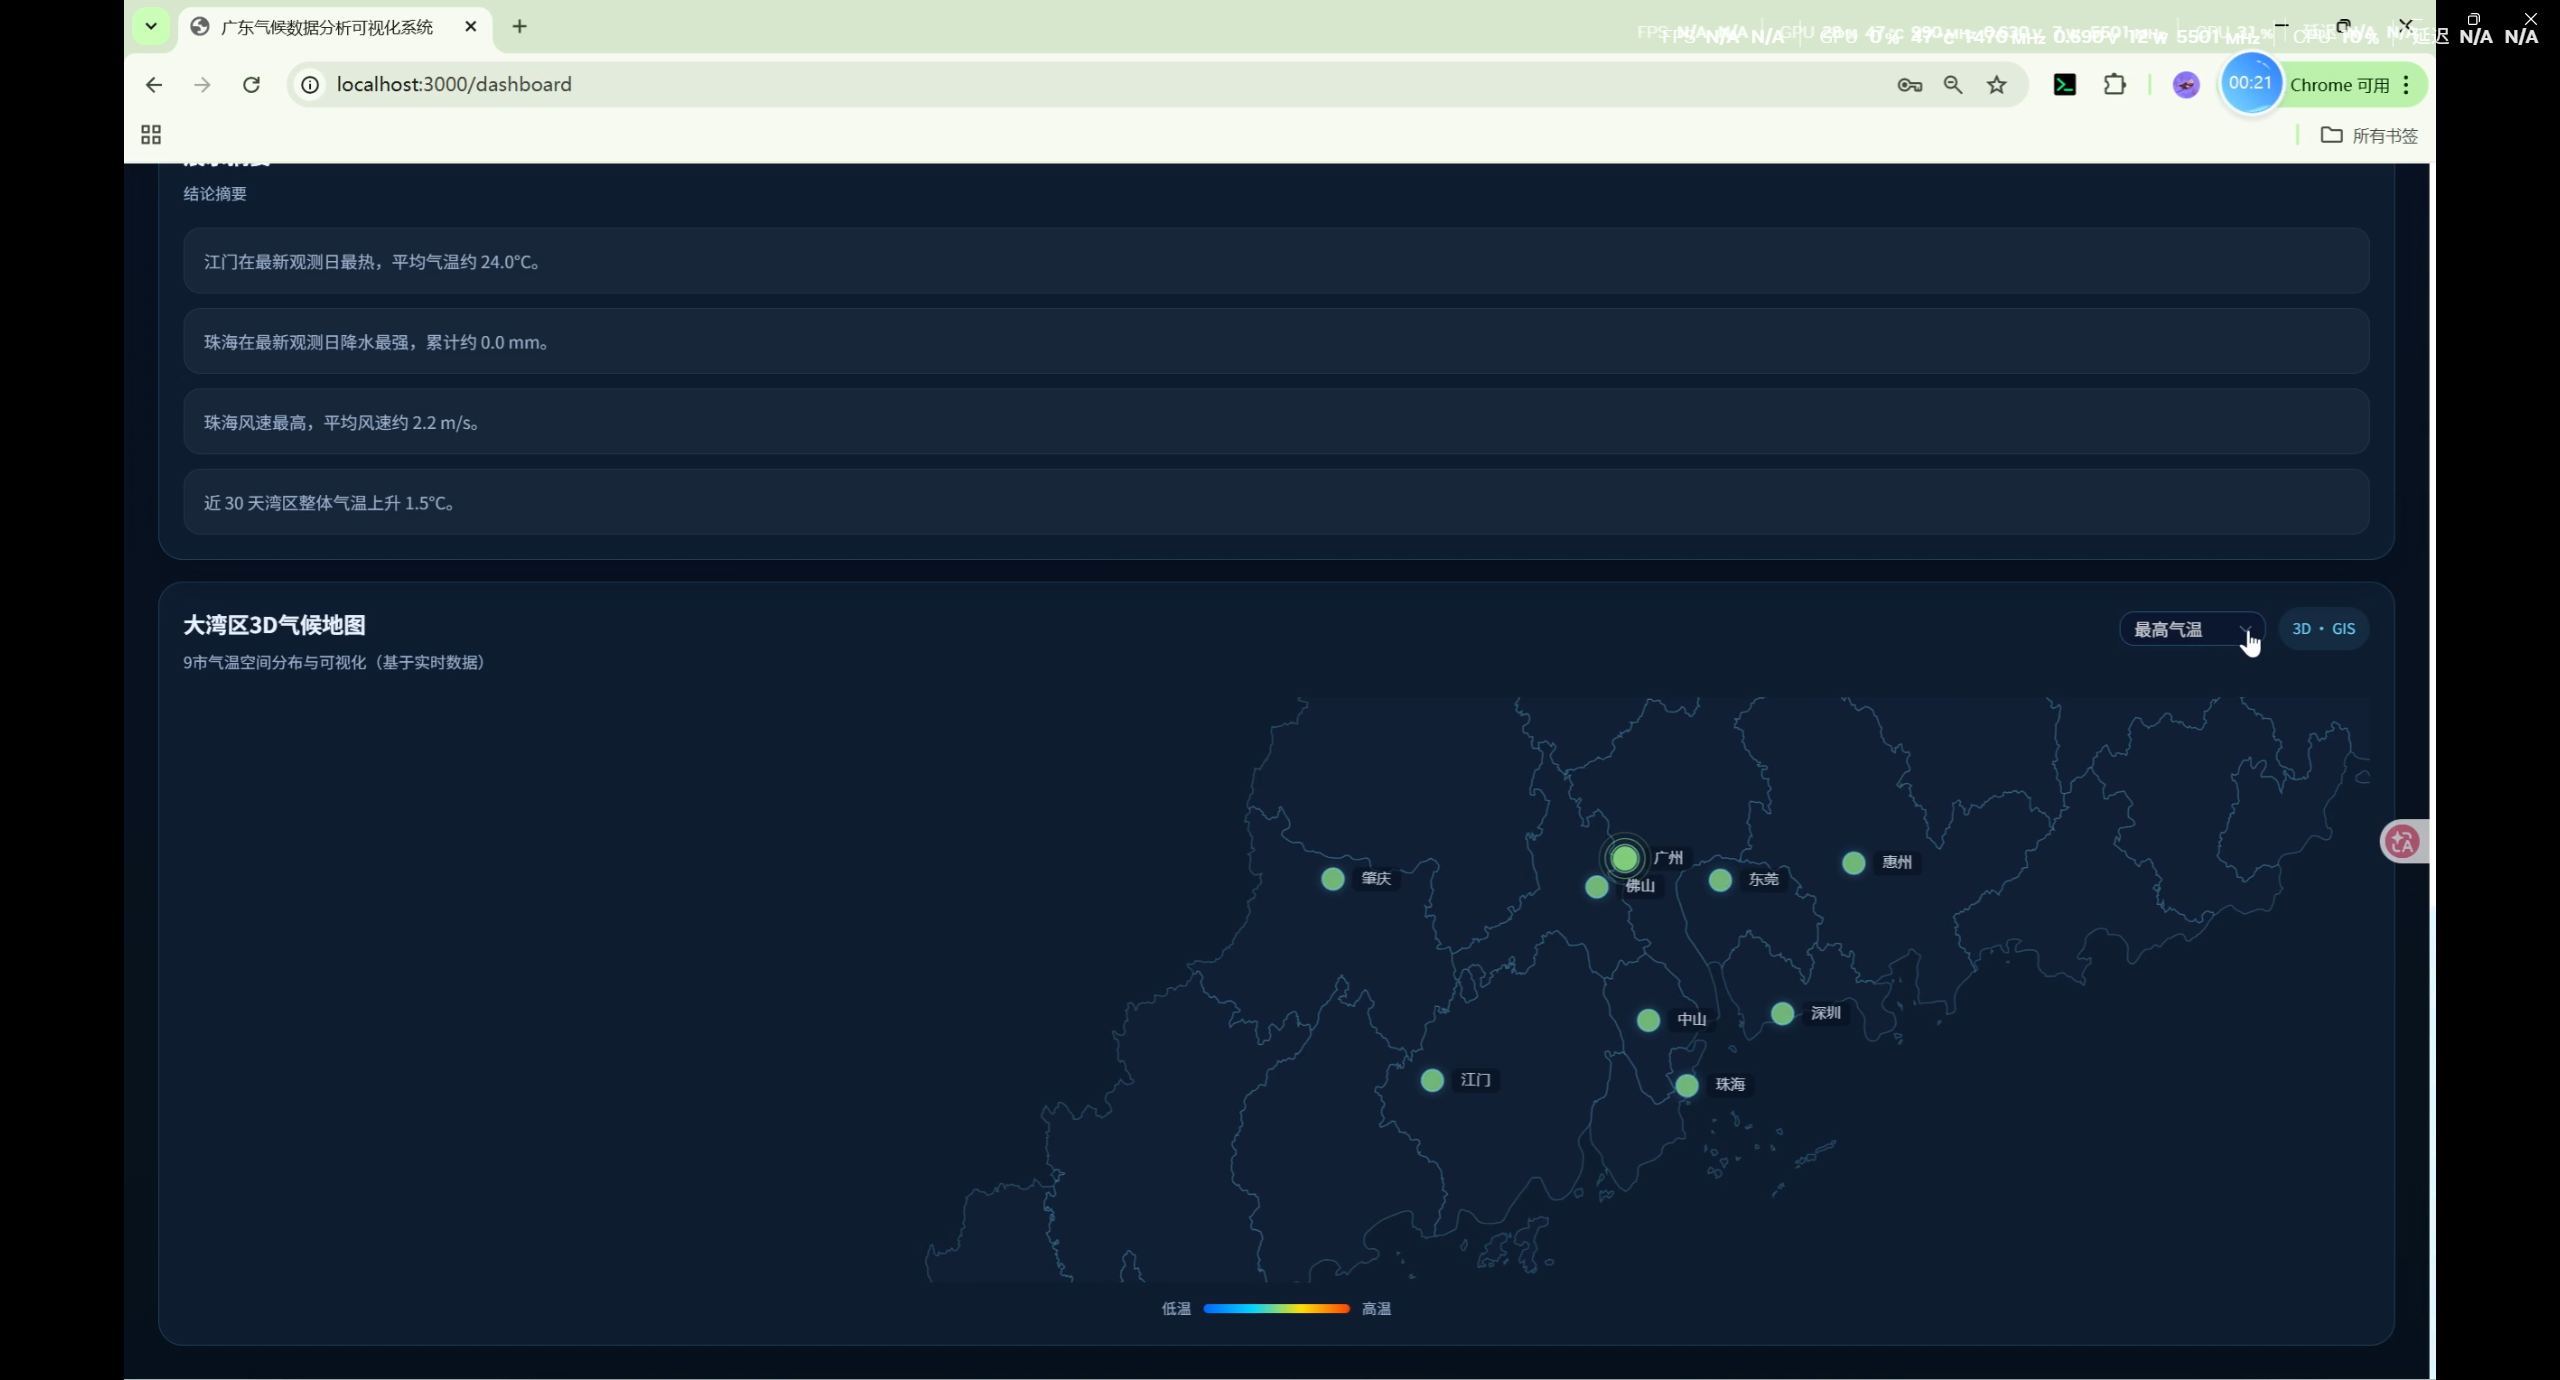
- 3D GIS 气候地图(Climate3DMap):广东省ECharts地图上展示9市气温/降水/风速,支持动态切换指标
- 展示摘要结论
- 优先使用完整数据日期(确保9市均有数据)
3D GIS 气候地图(Climate3DMap)
- 基于 ECharts 2D geo 组件 + 广东 GeoJSON(阿里云DataV)实现
- 自动选择最近有完整9市数据的日期
- 支持切换展示指标:平均气温 / 最高气温 / 最低气温 / 降水 / 风速
- 城市标记点 + 数值标注,支持散点/热力风格切换
- 动态从
/api/airdata/cities/获取城市ID映射解决前后端城市标识不一致问题
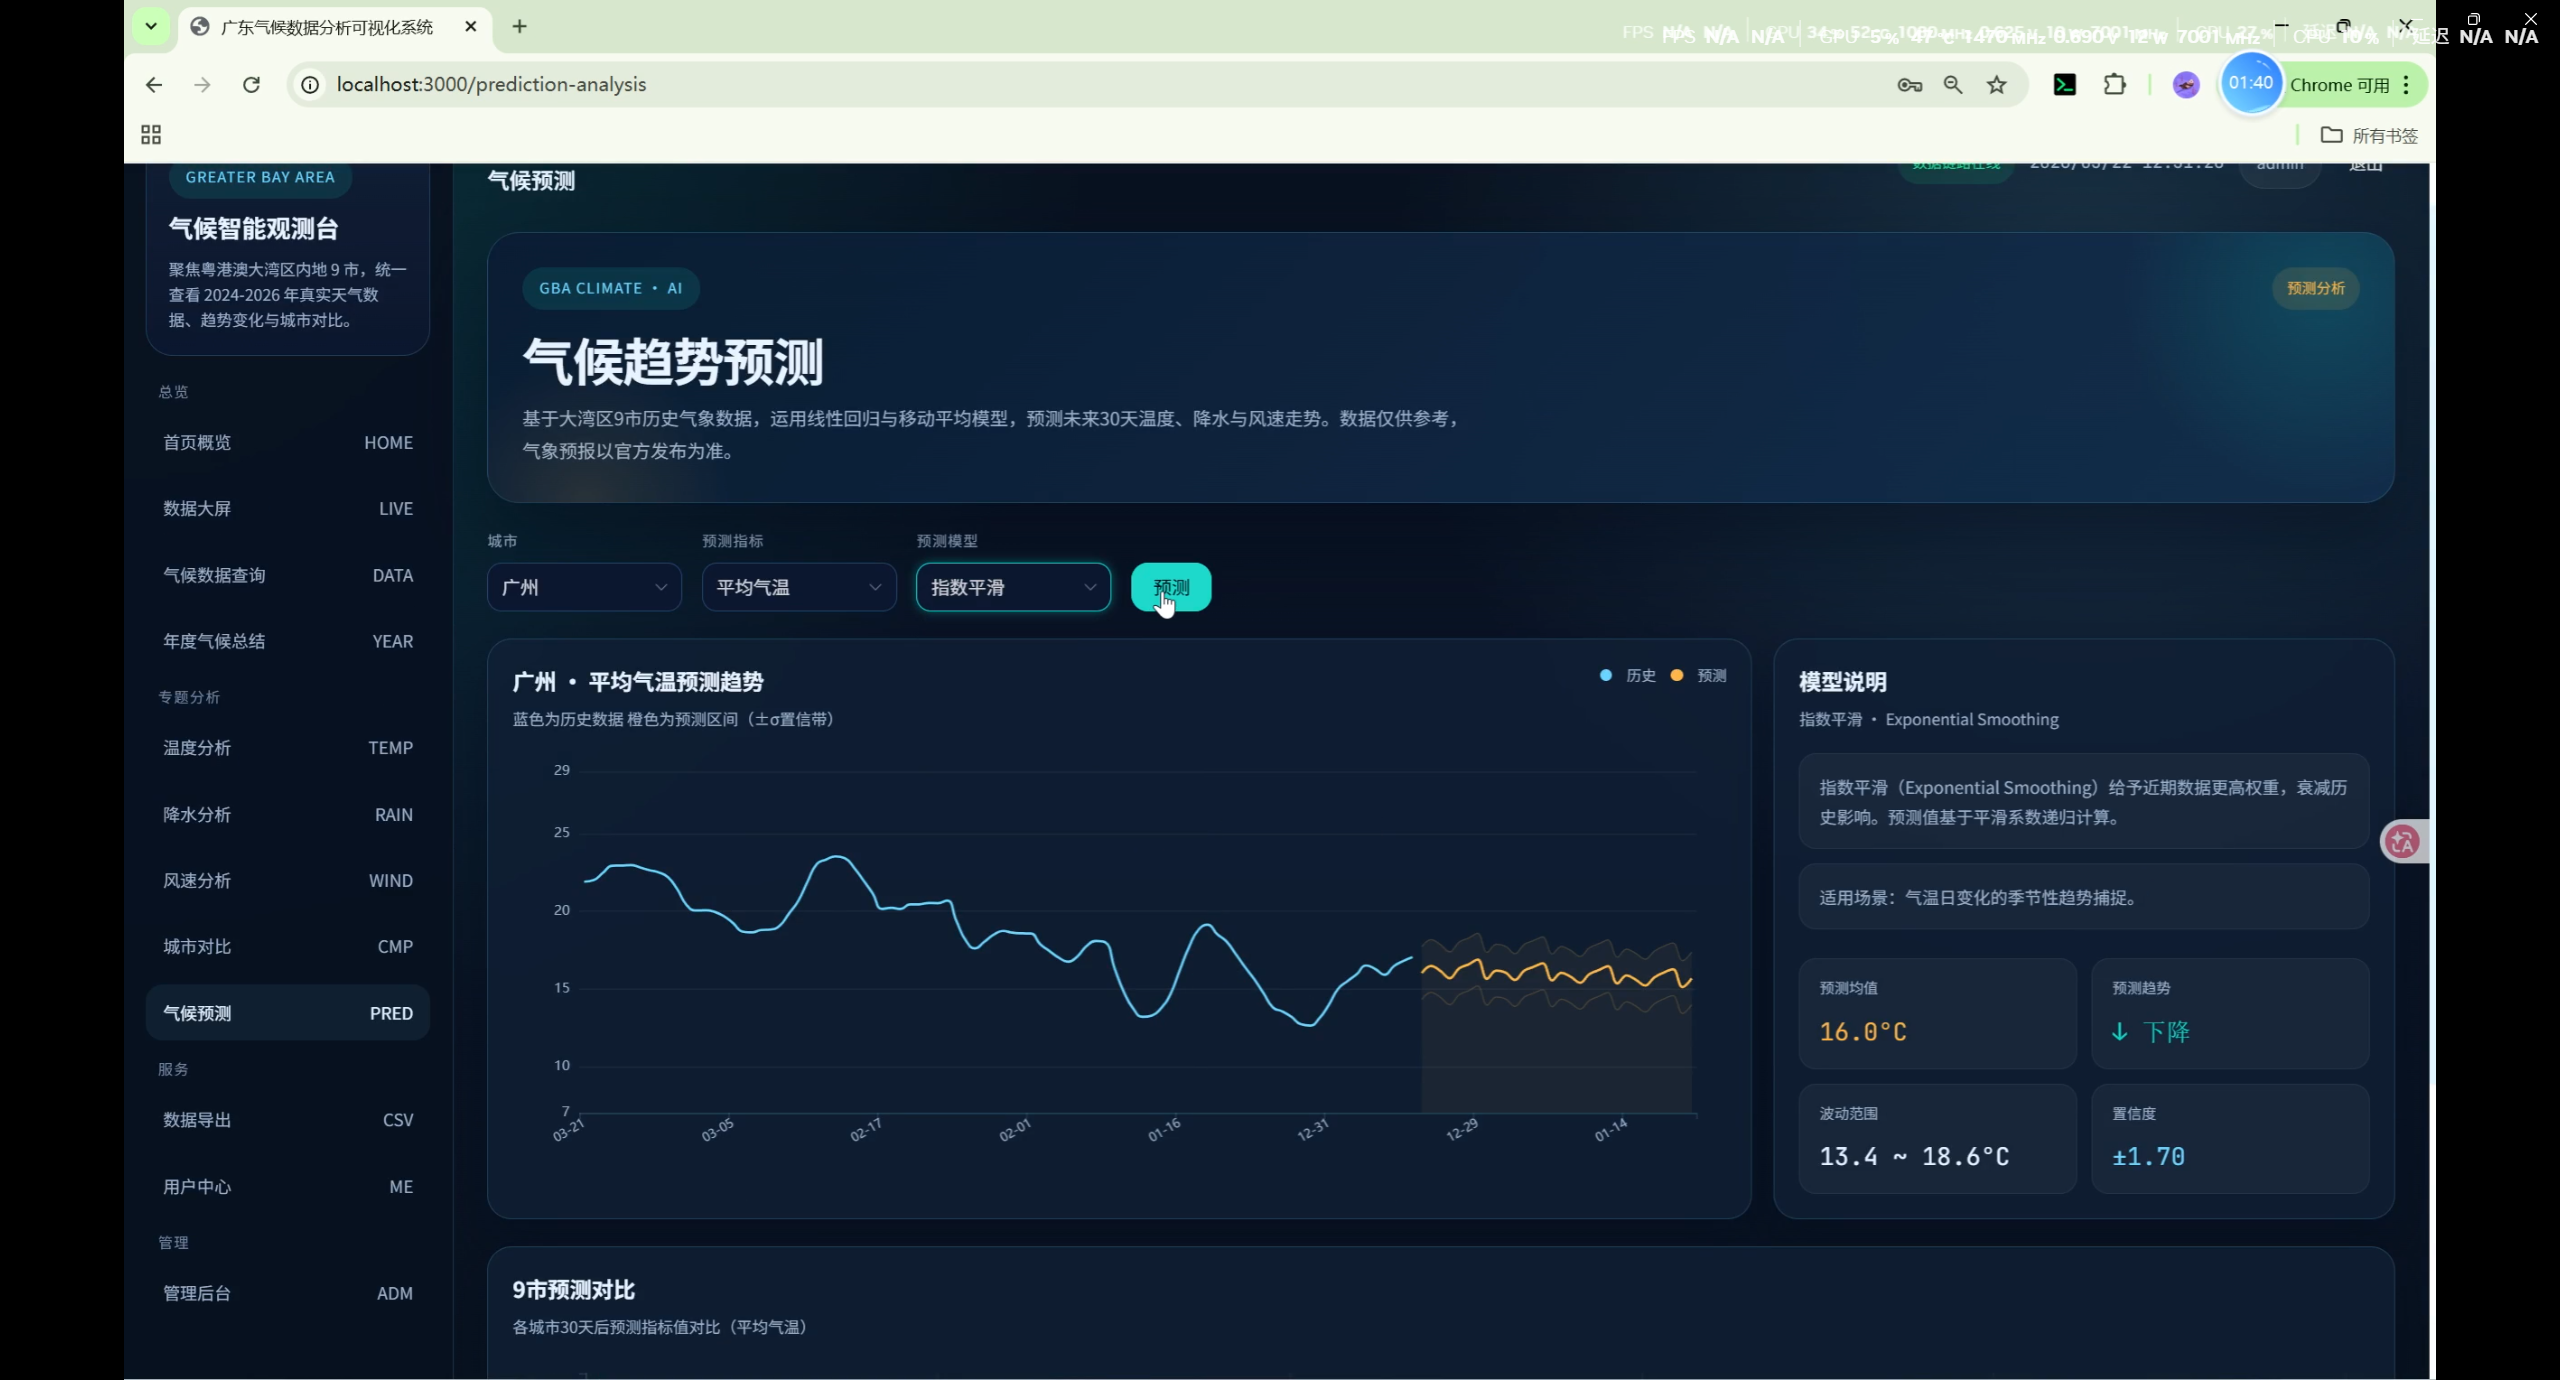
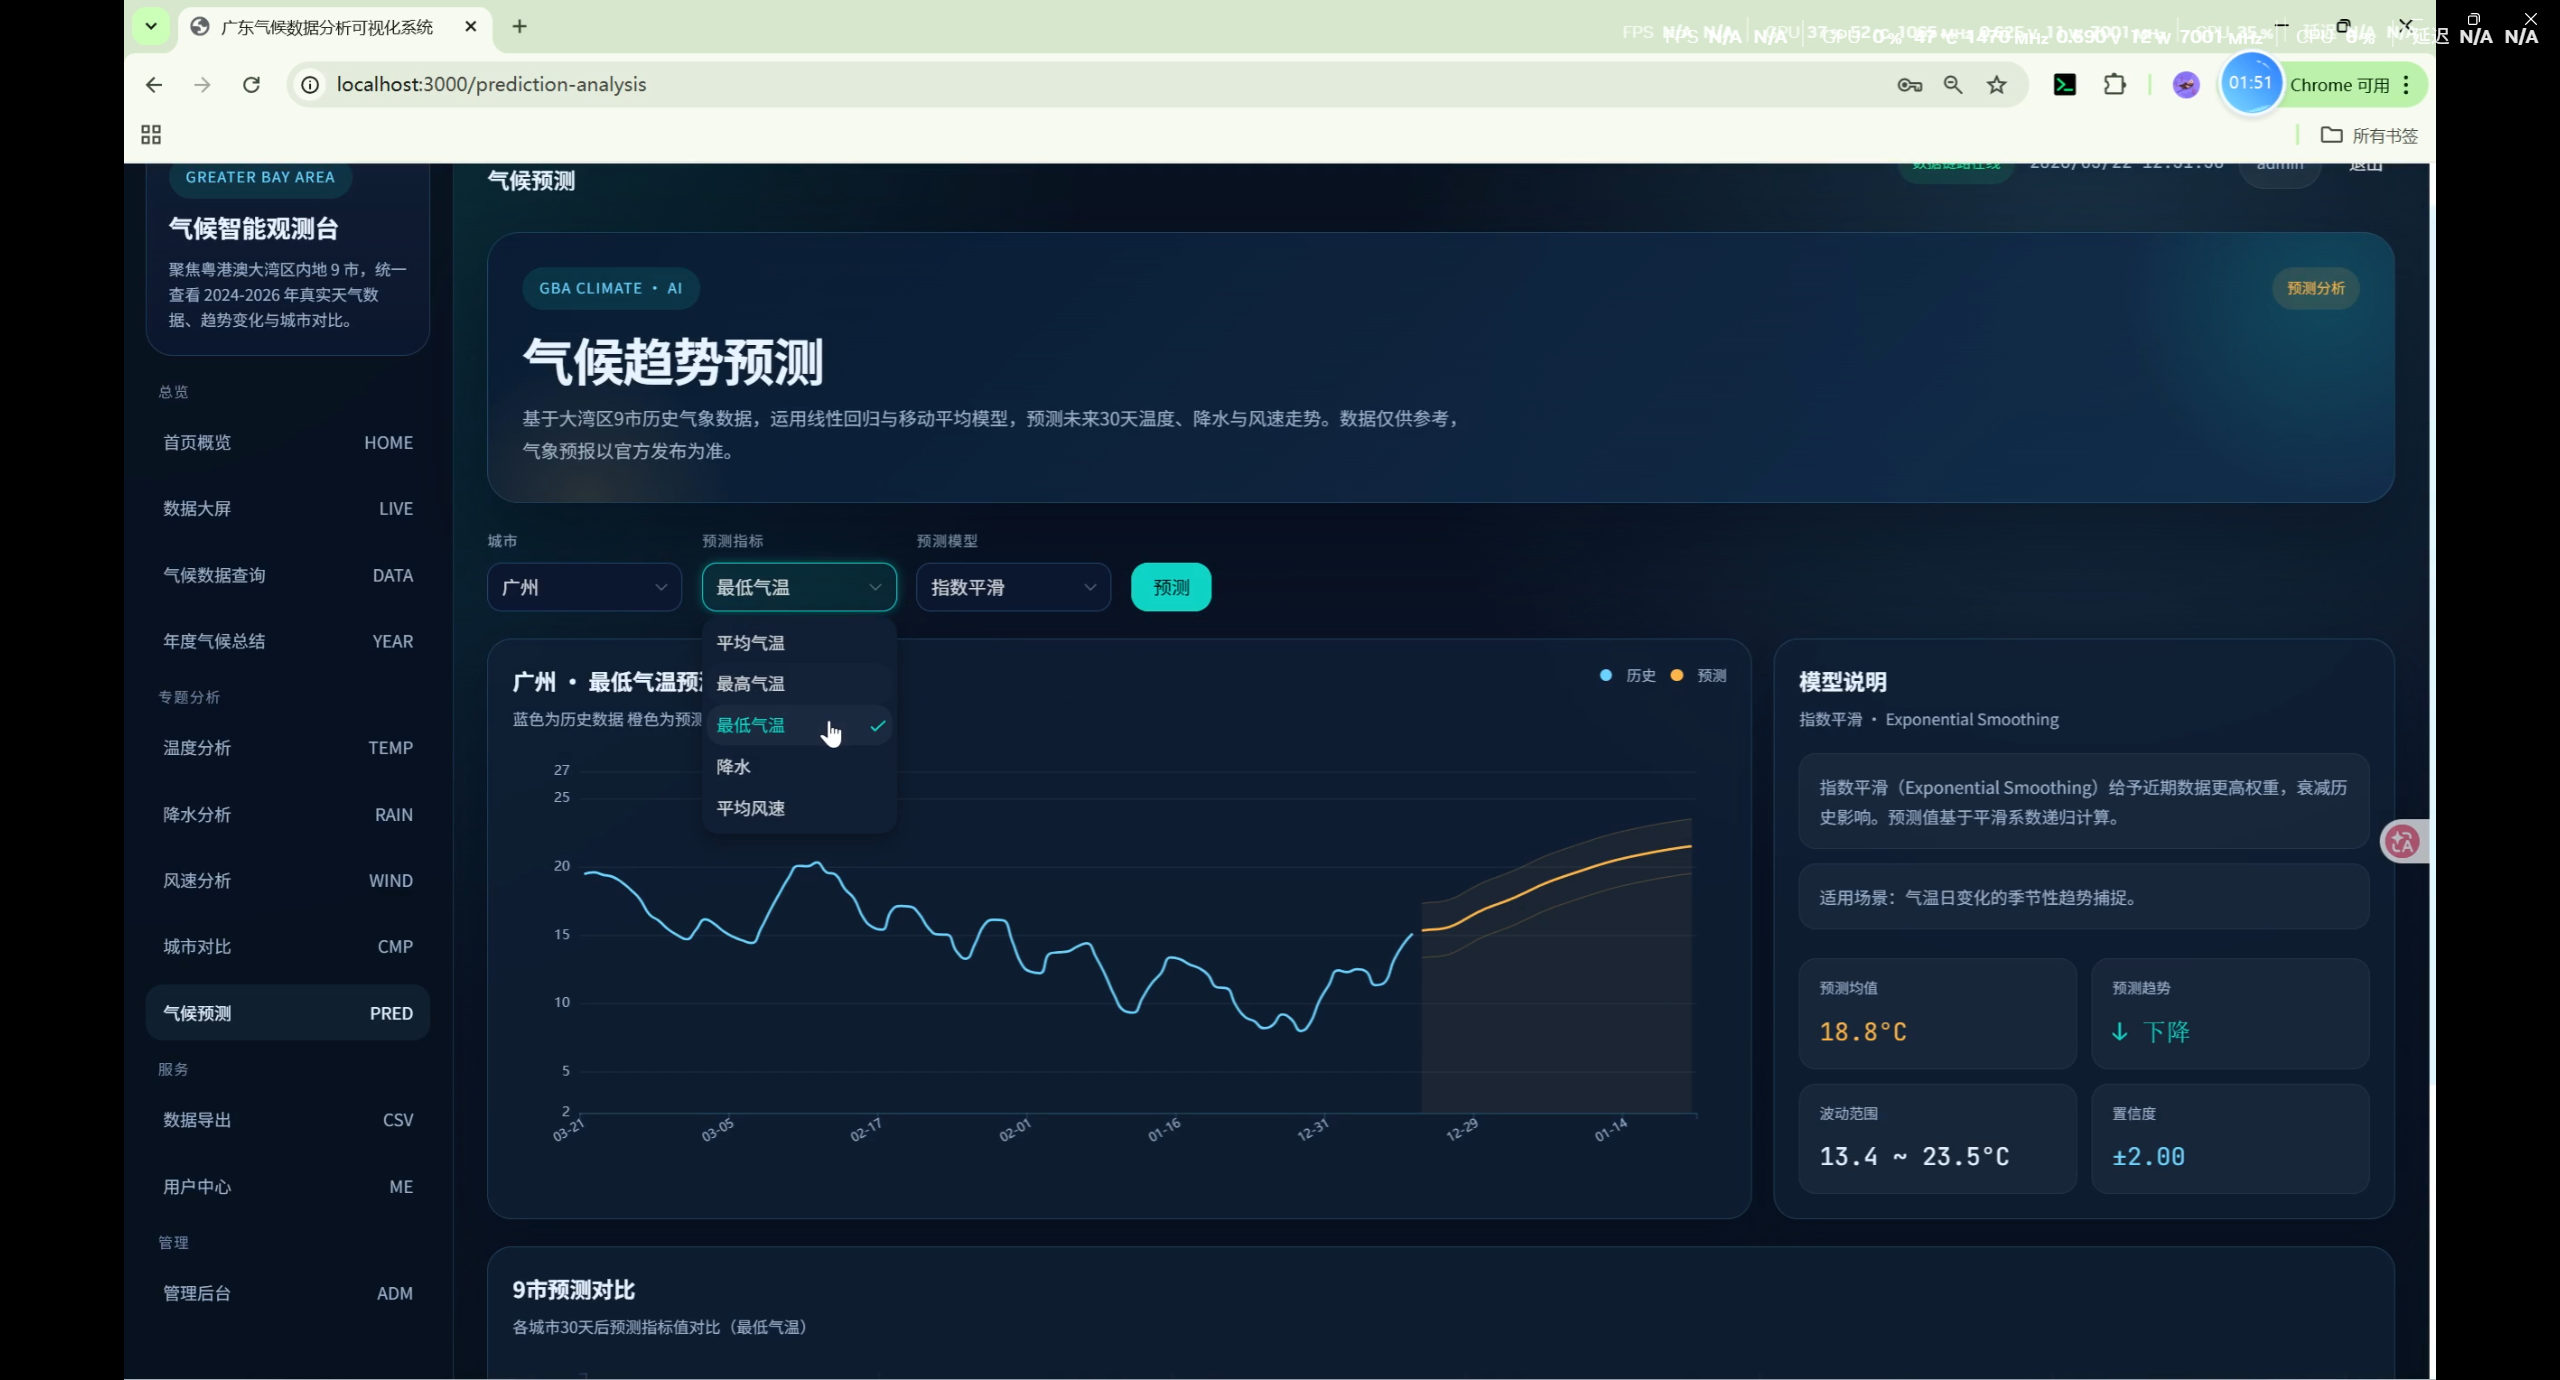
气候预测分析(PredictionAnalysis)
- 三种预测模型 :
- 线性回归(LR):线性外推,数学意义上的直线
- 移动平均(MA):基于最近7天周期模式 + 衰减波动 + 趋势延续,产生自然起伏曲线
- 指数平滑(Exp):阻尼振荡(Damped Oscillation)捕捉7天周期性变化,产生平滑过渡曲线
- 支持指标:平均气温、最高气温、最低气温、降水、平均风速
- 展示内容:历史数据平滑曲线、未来30天预测、置信区间(基于残差标准差)
- 9市预测对比柱状图:各城市30天后预测值升序排列
- 摘要统计:预测均值、极值范围、30天趋势
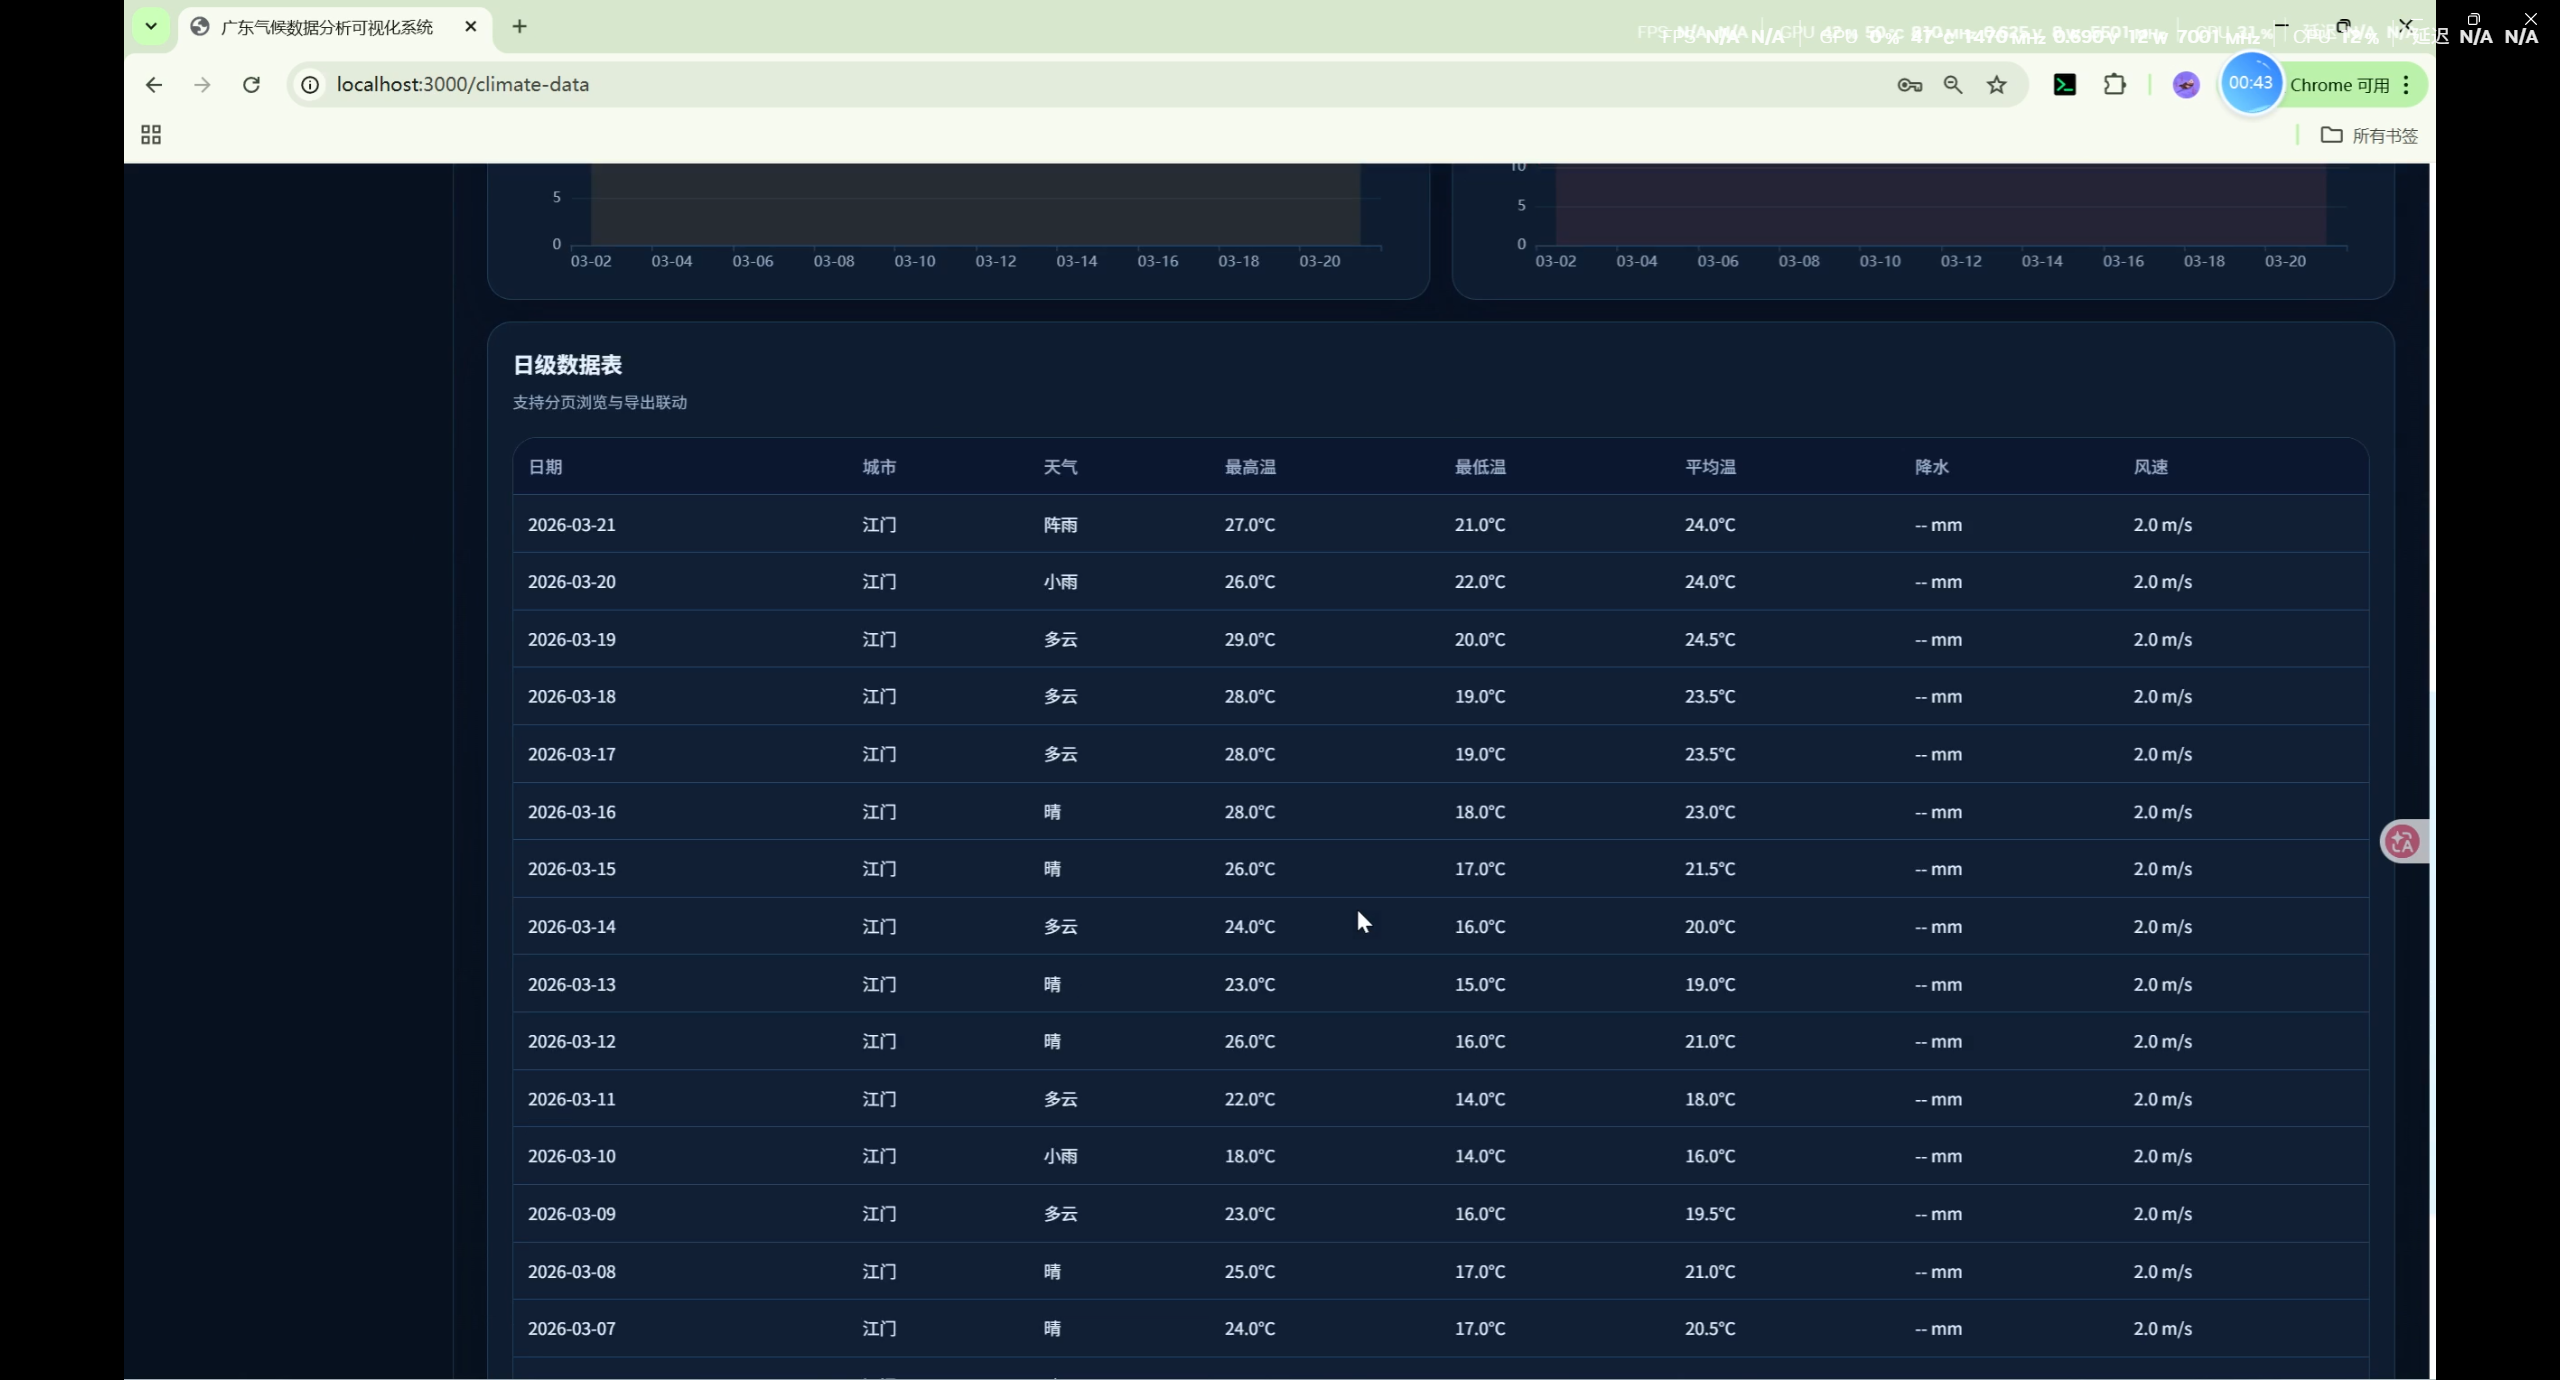
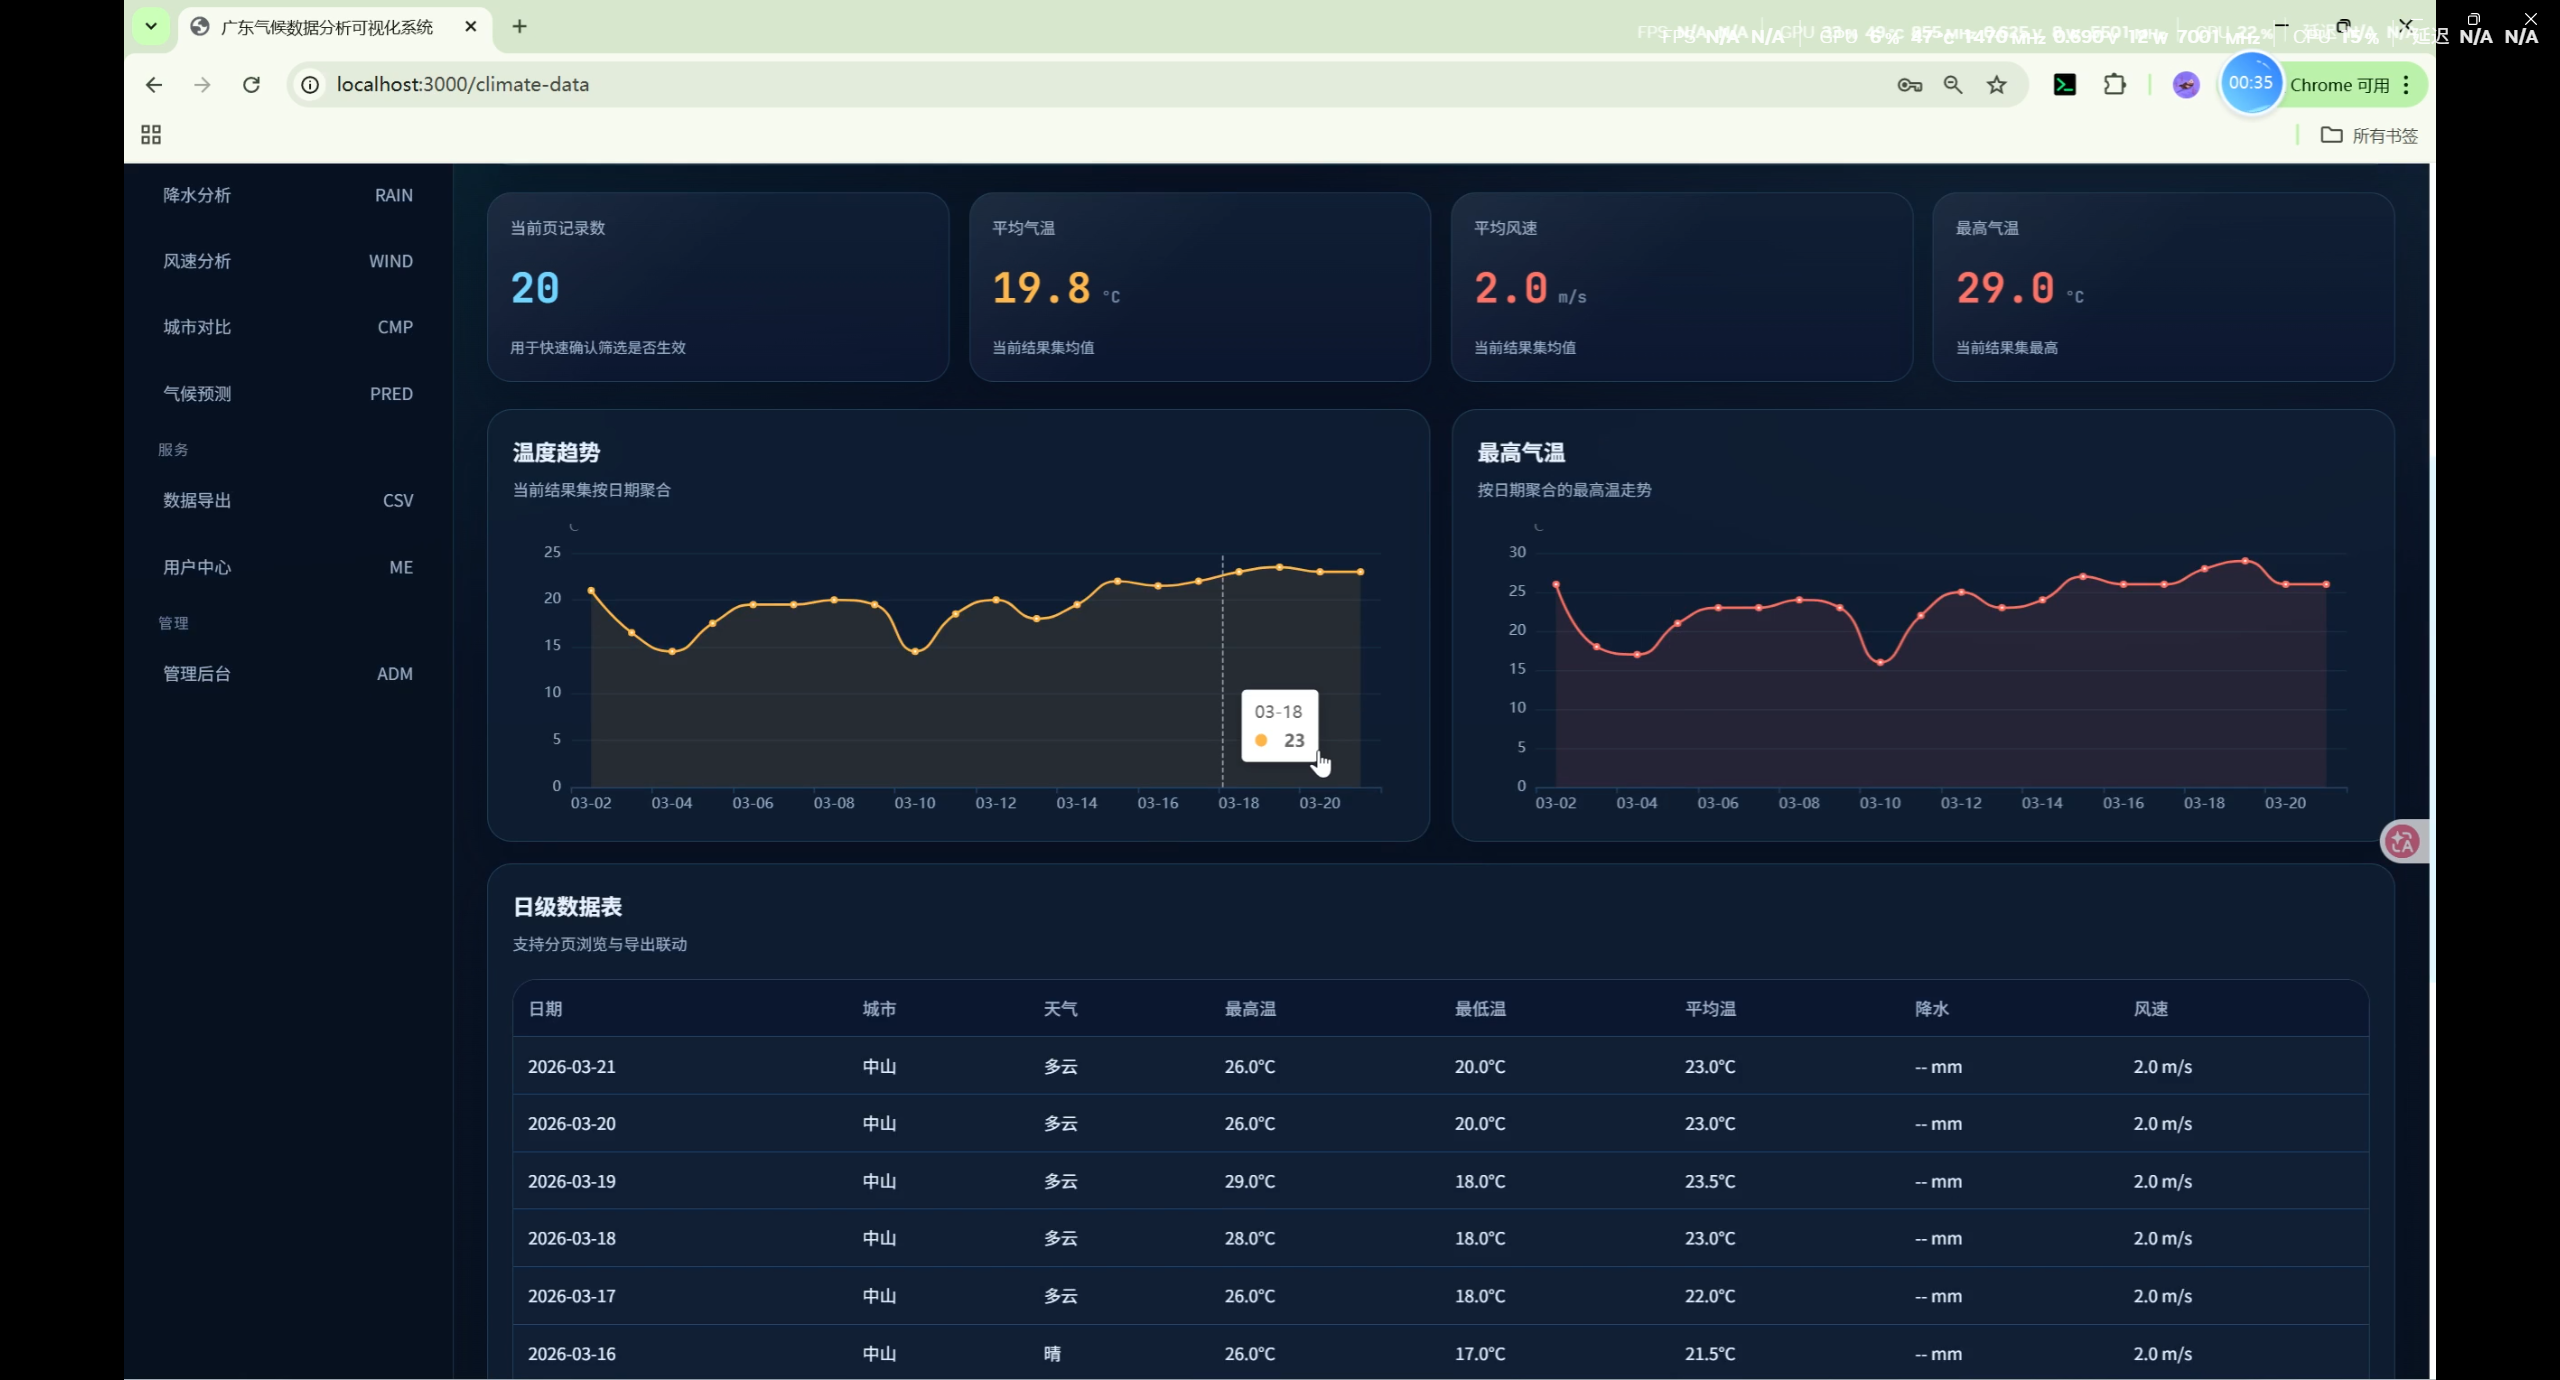
气候数据查询(ClimateData)
- 按城市、日期范围筛选每日气候记录
- 气温与风速趋势图
- 表格分页展示(支持
page_size参数,最大200)
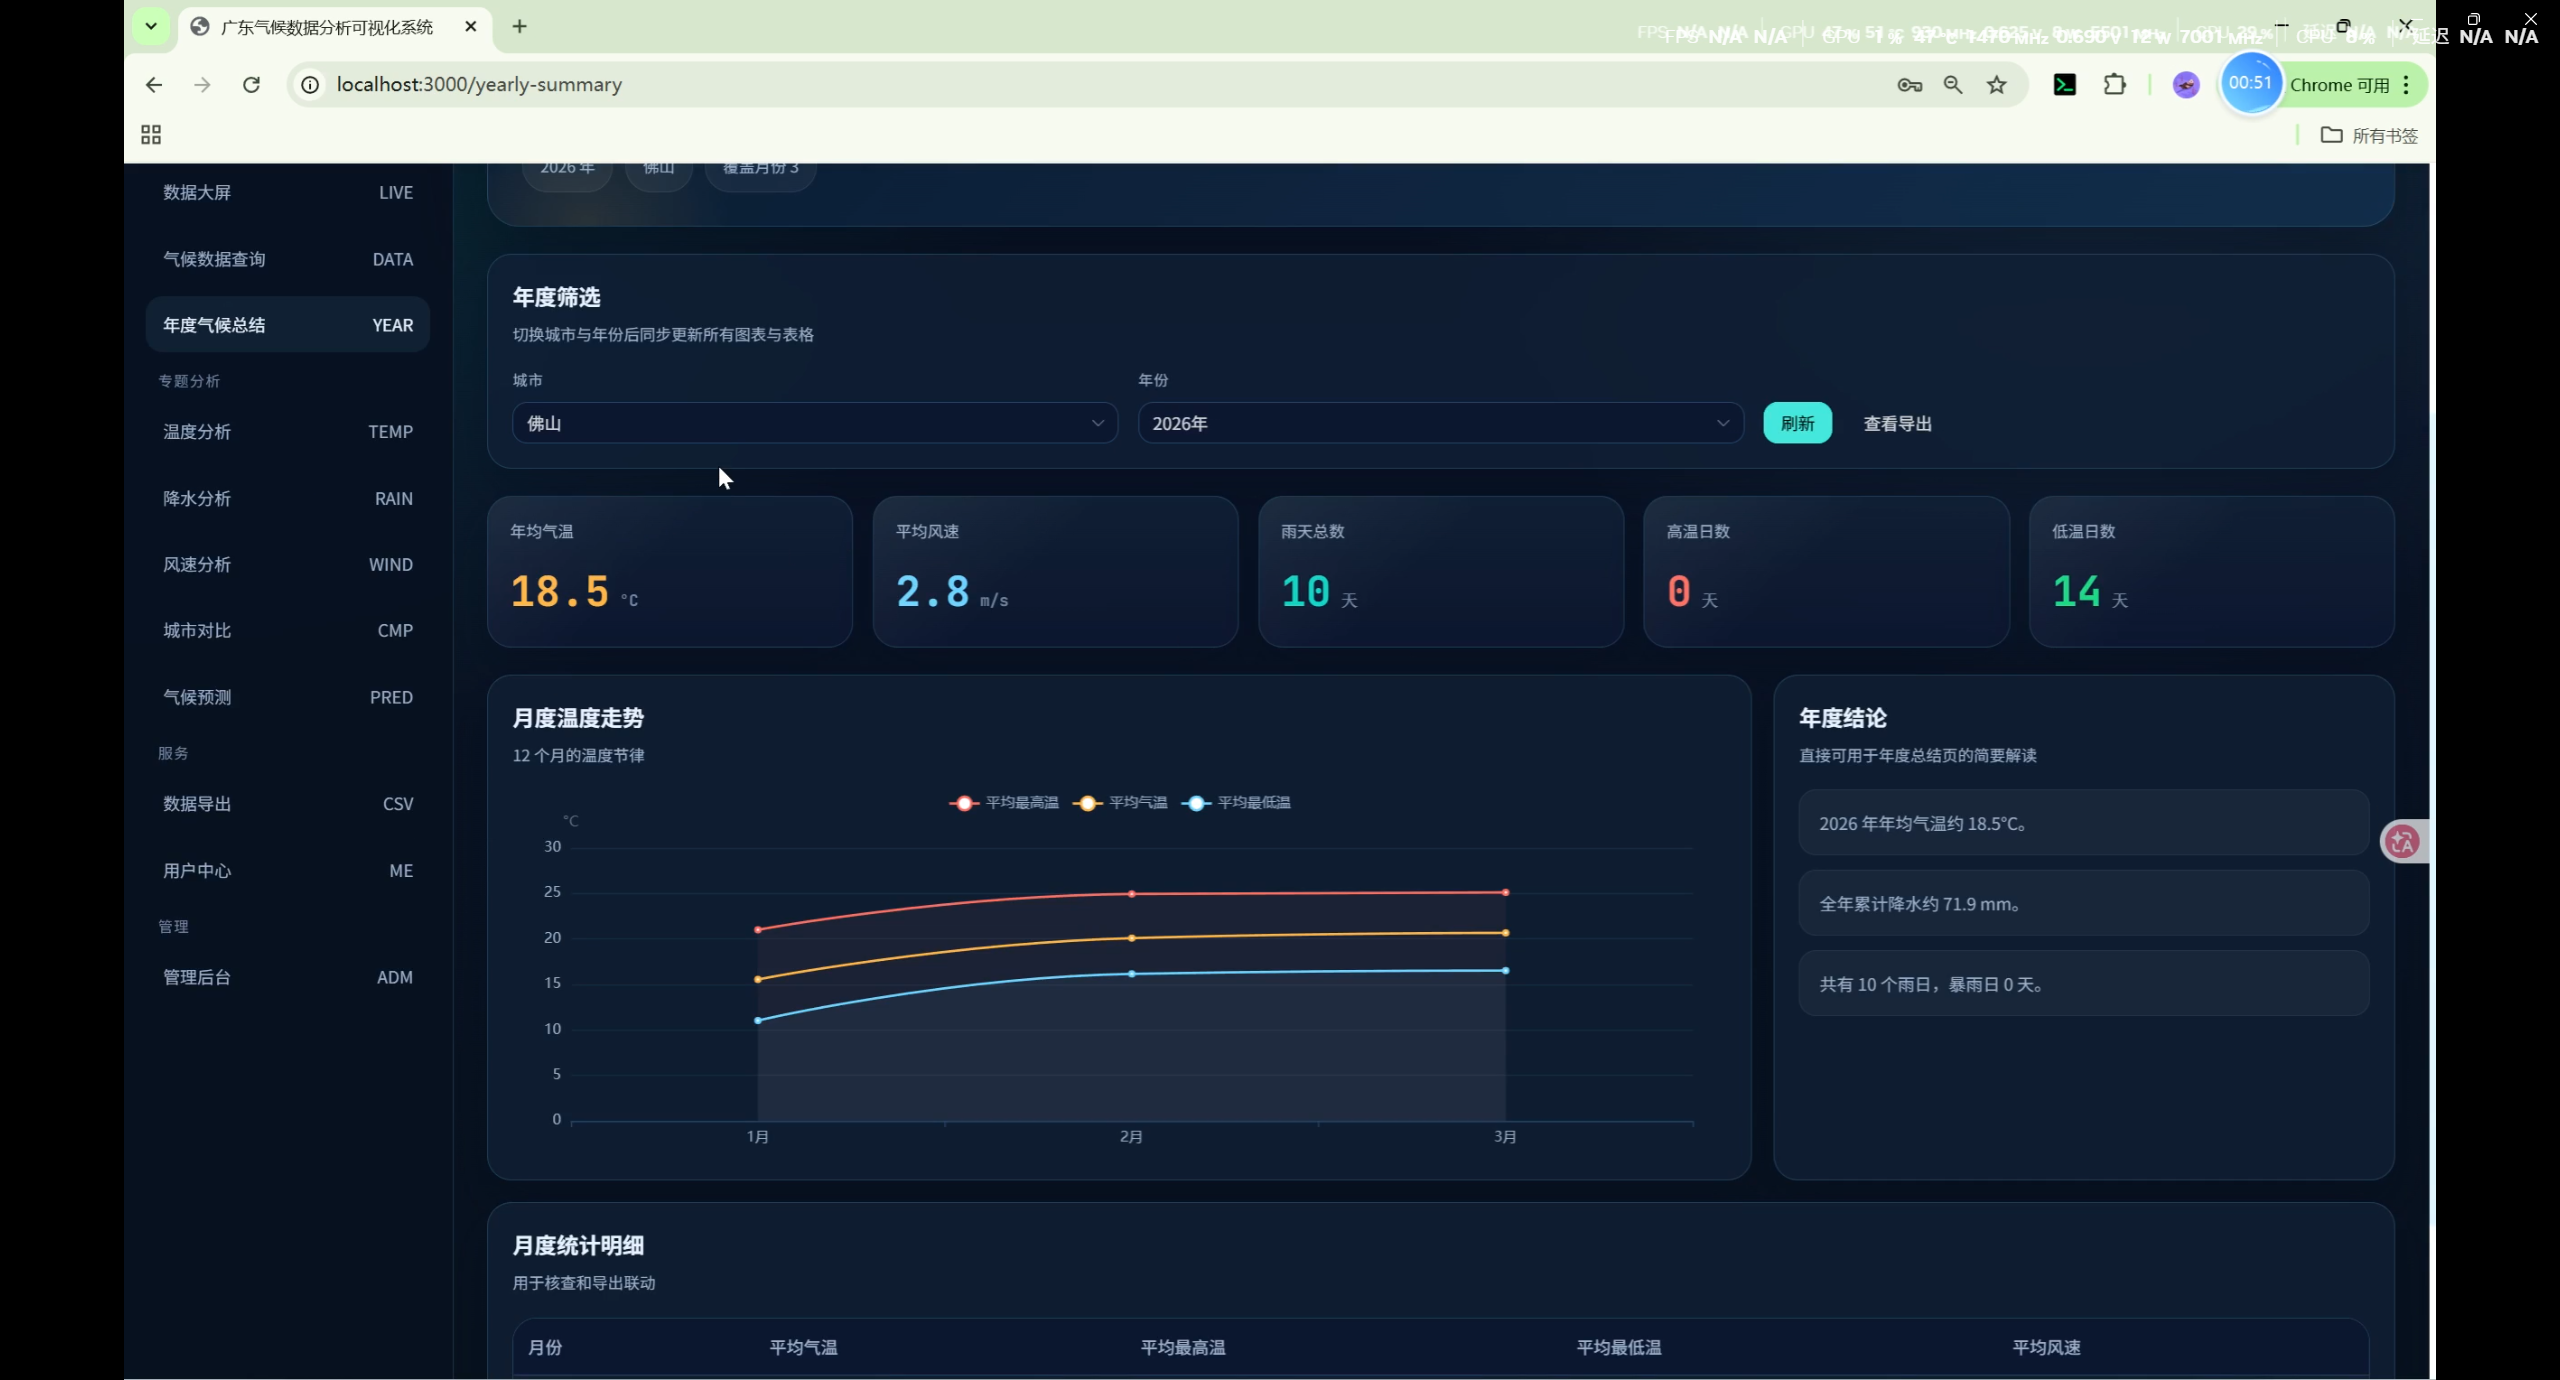
年度汇总(YearlySummary)
- 各城市年度气候指标汇总
- 年均温趋势与极端温度
- 平均风速与降水
城市详情(CityDetail)
- 单城市近 30 日温度变化图
- 降水变化图
- 最新 10 条观测记录
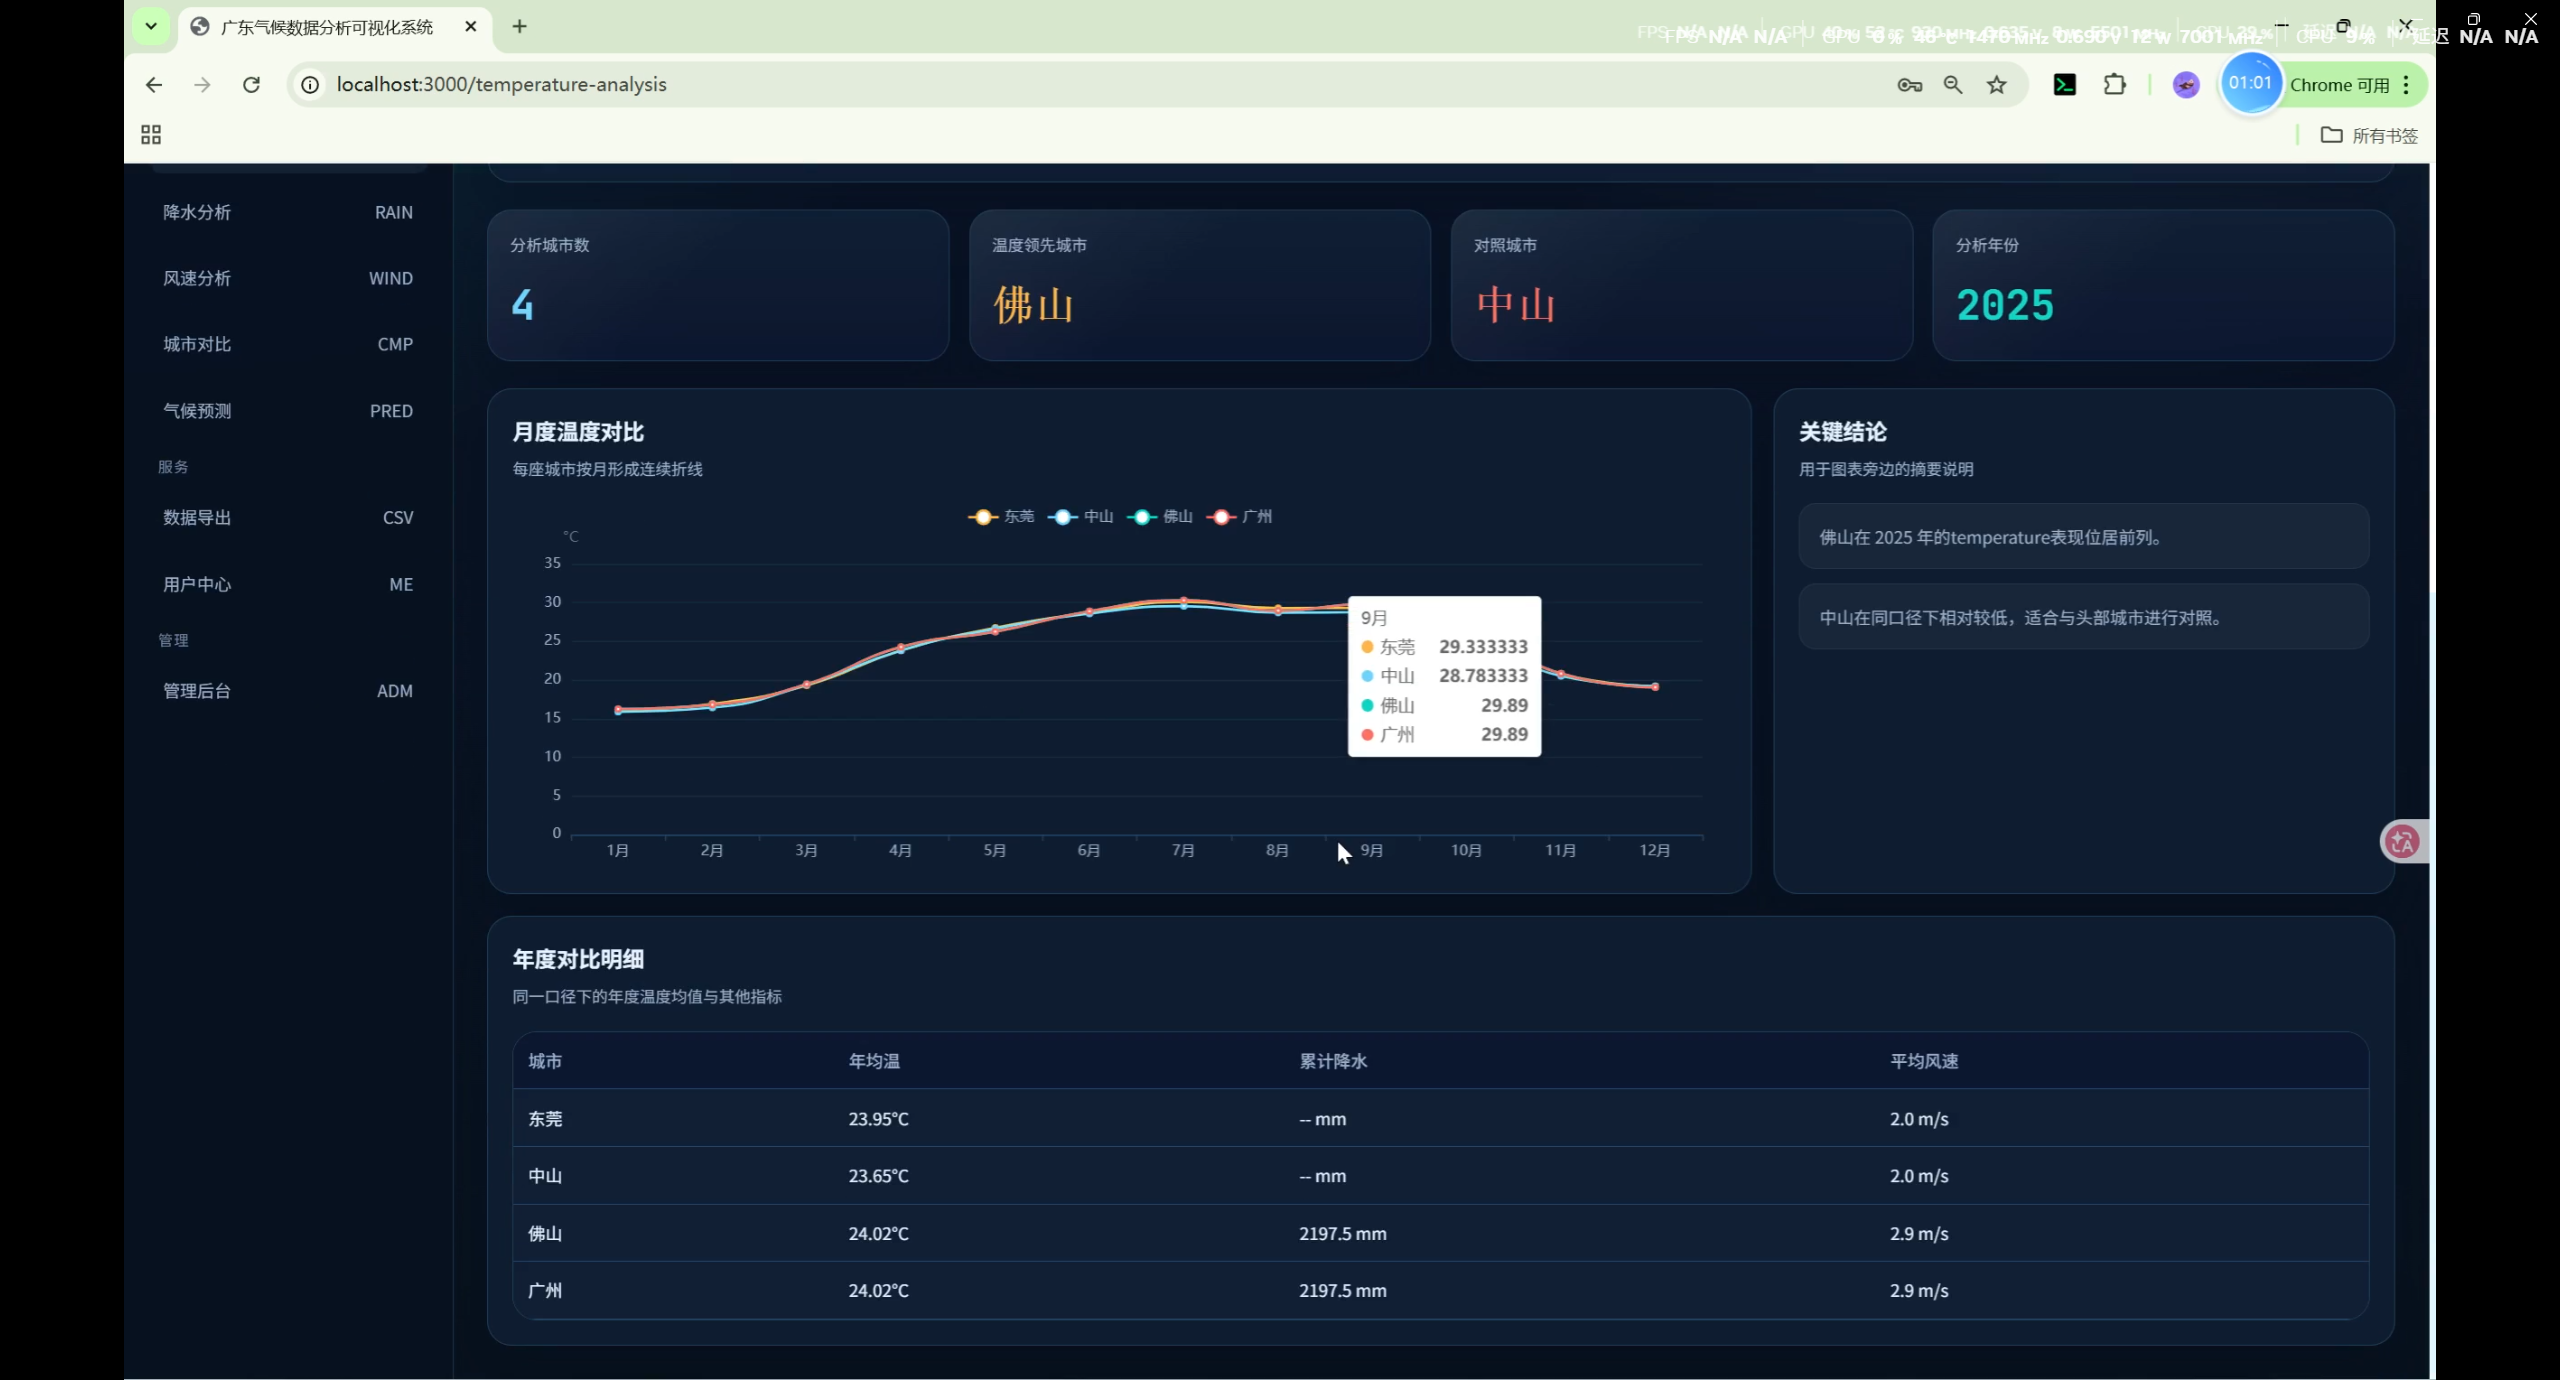
温度分析(TemperatureAnalysis)
- 多城市月度温度对比折线图
- 年度对比明细表
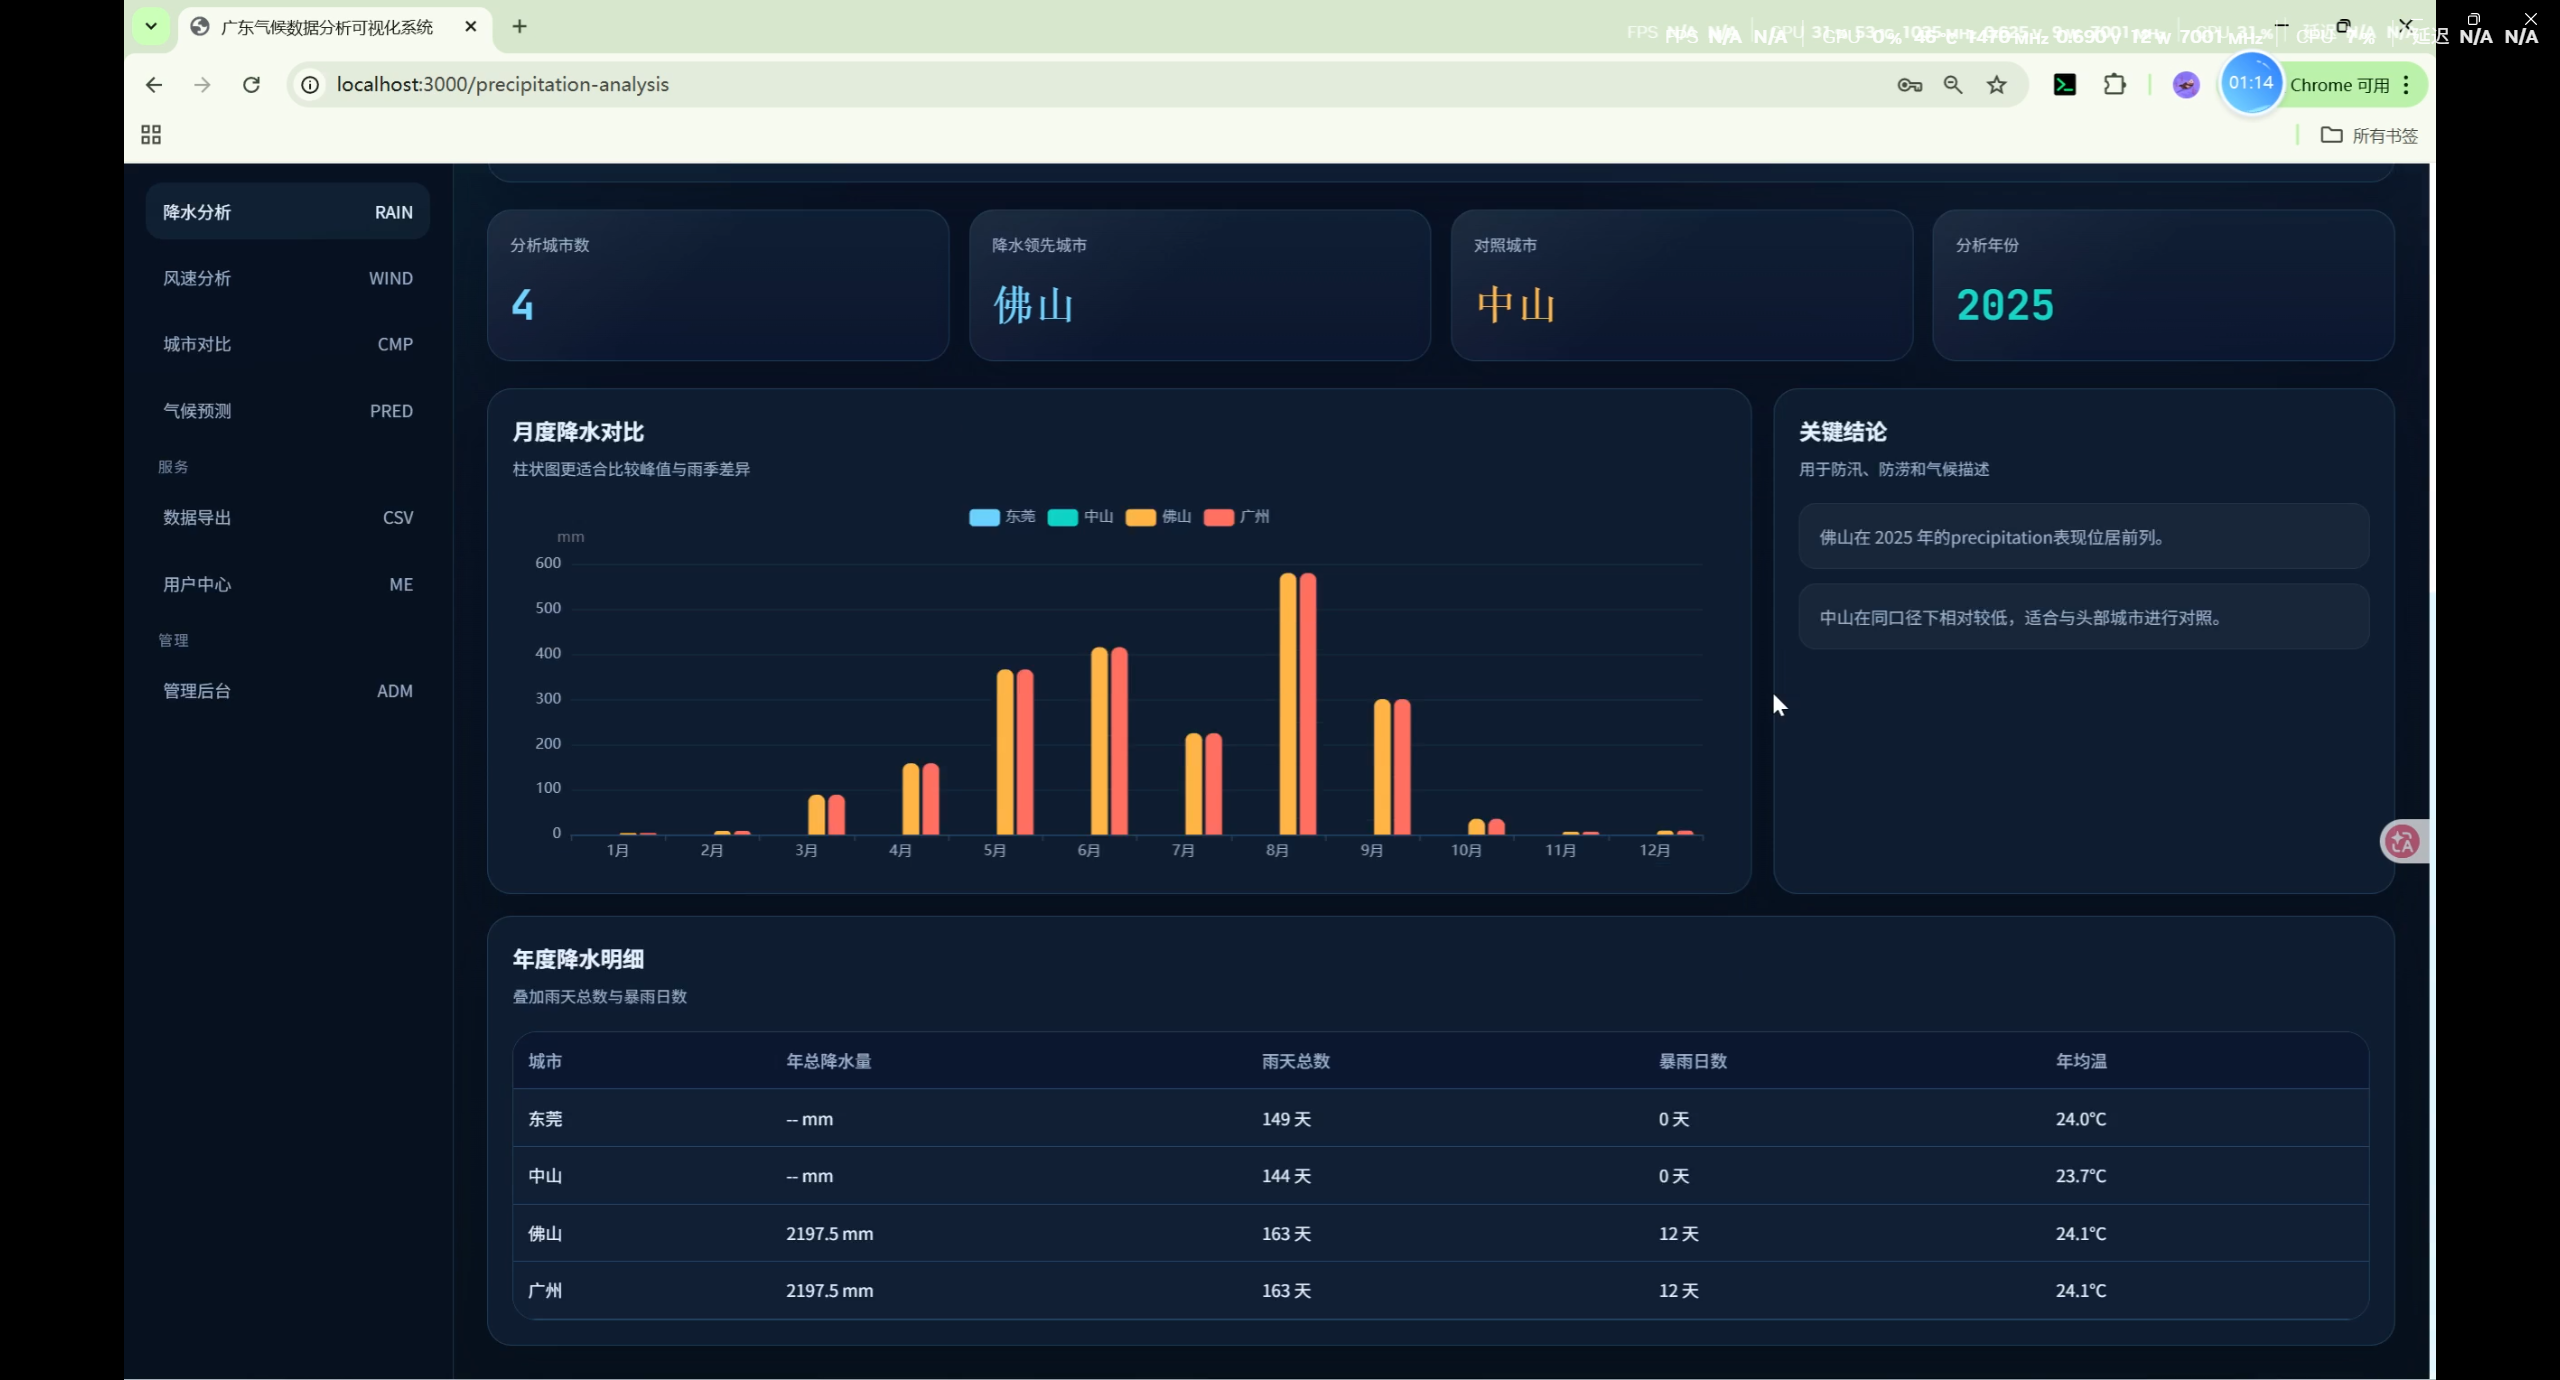
降水分析(PrecipitationAnalysis)
- 多城市月度降水对比
- 降水分布统计
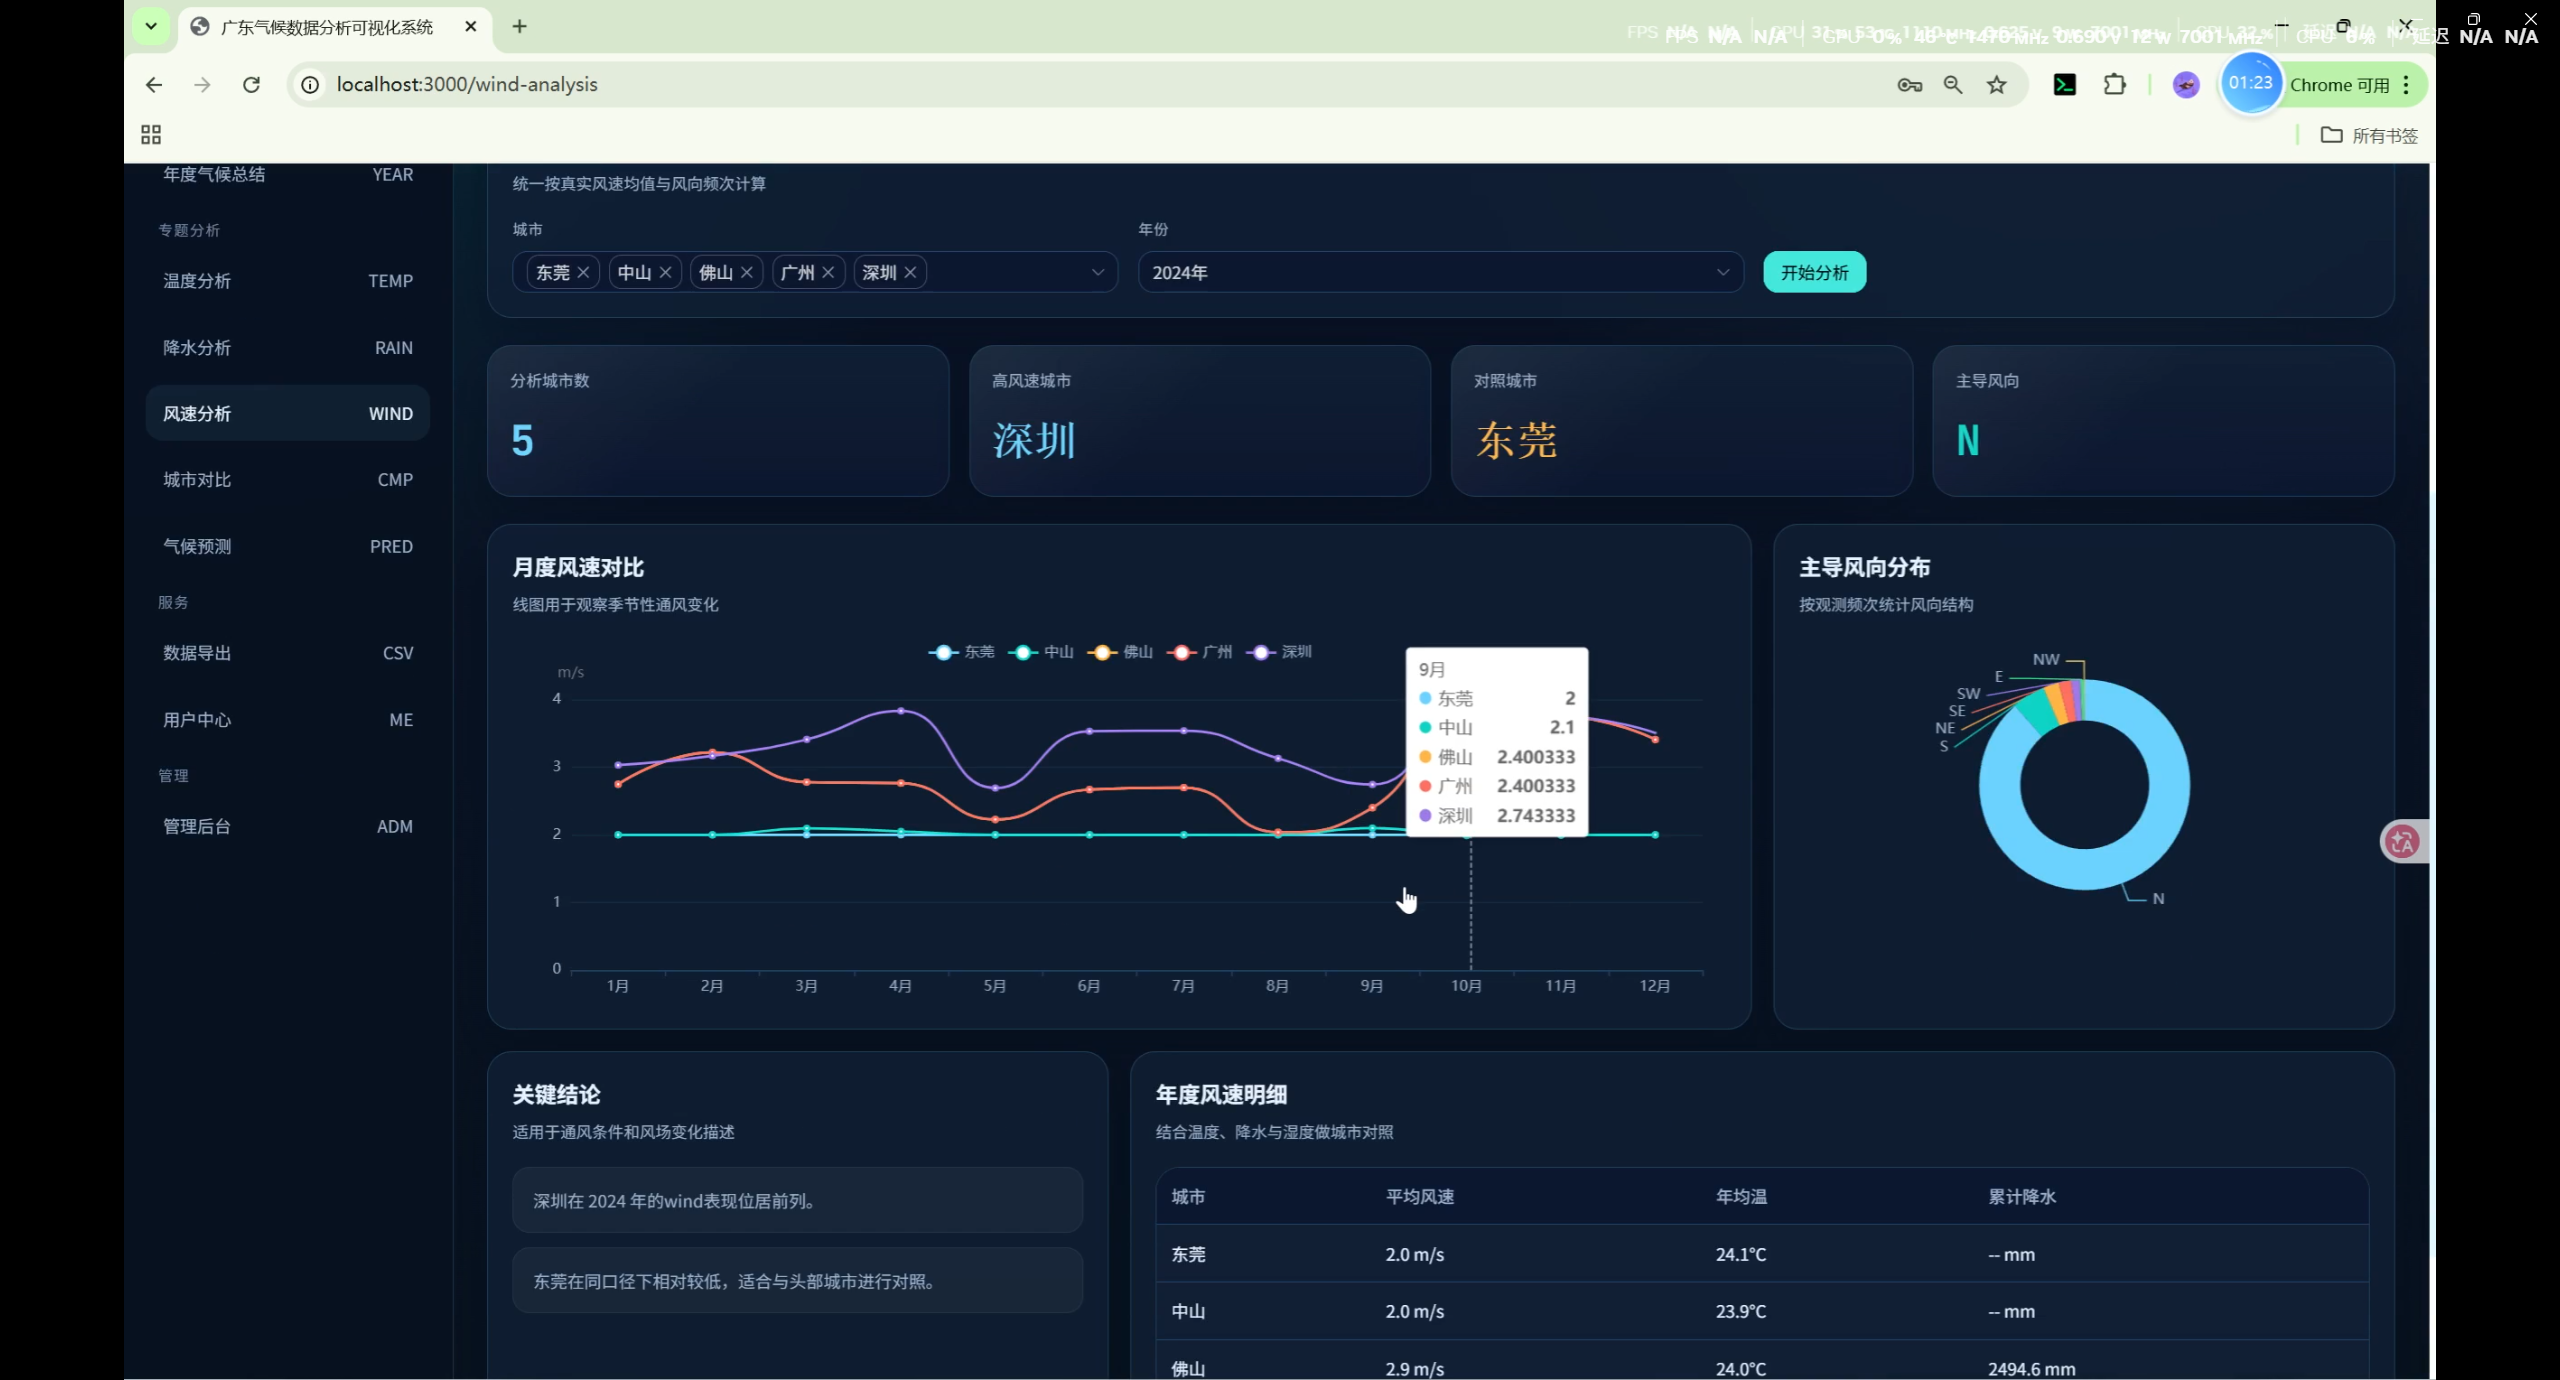
风速分析(WindAnalysis)
- 多城市月度风速对比
- 风速分布统计
湿度分析(HumidityAnalysis)
- 多城市月度湿度对比
- 湿度区间分布
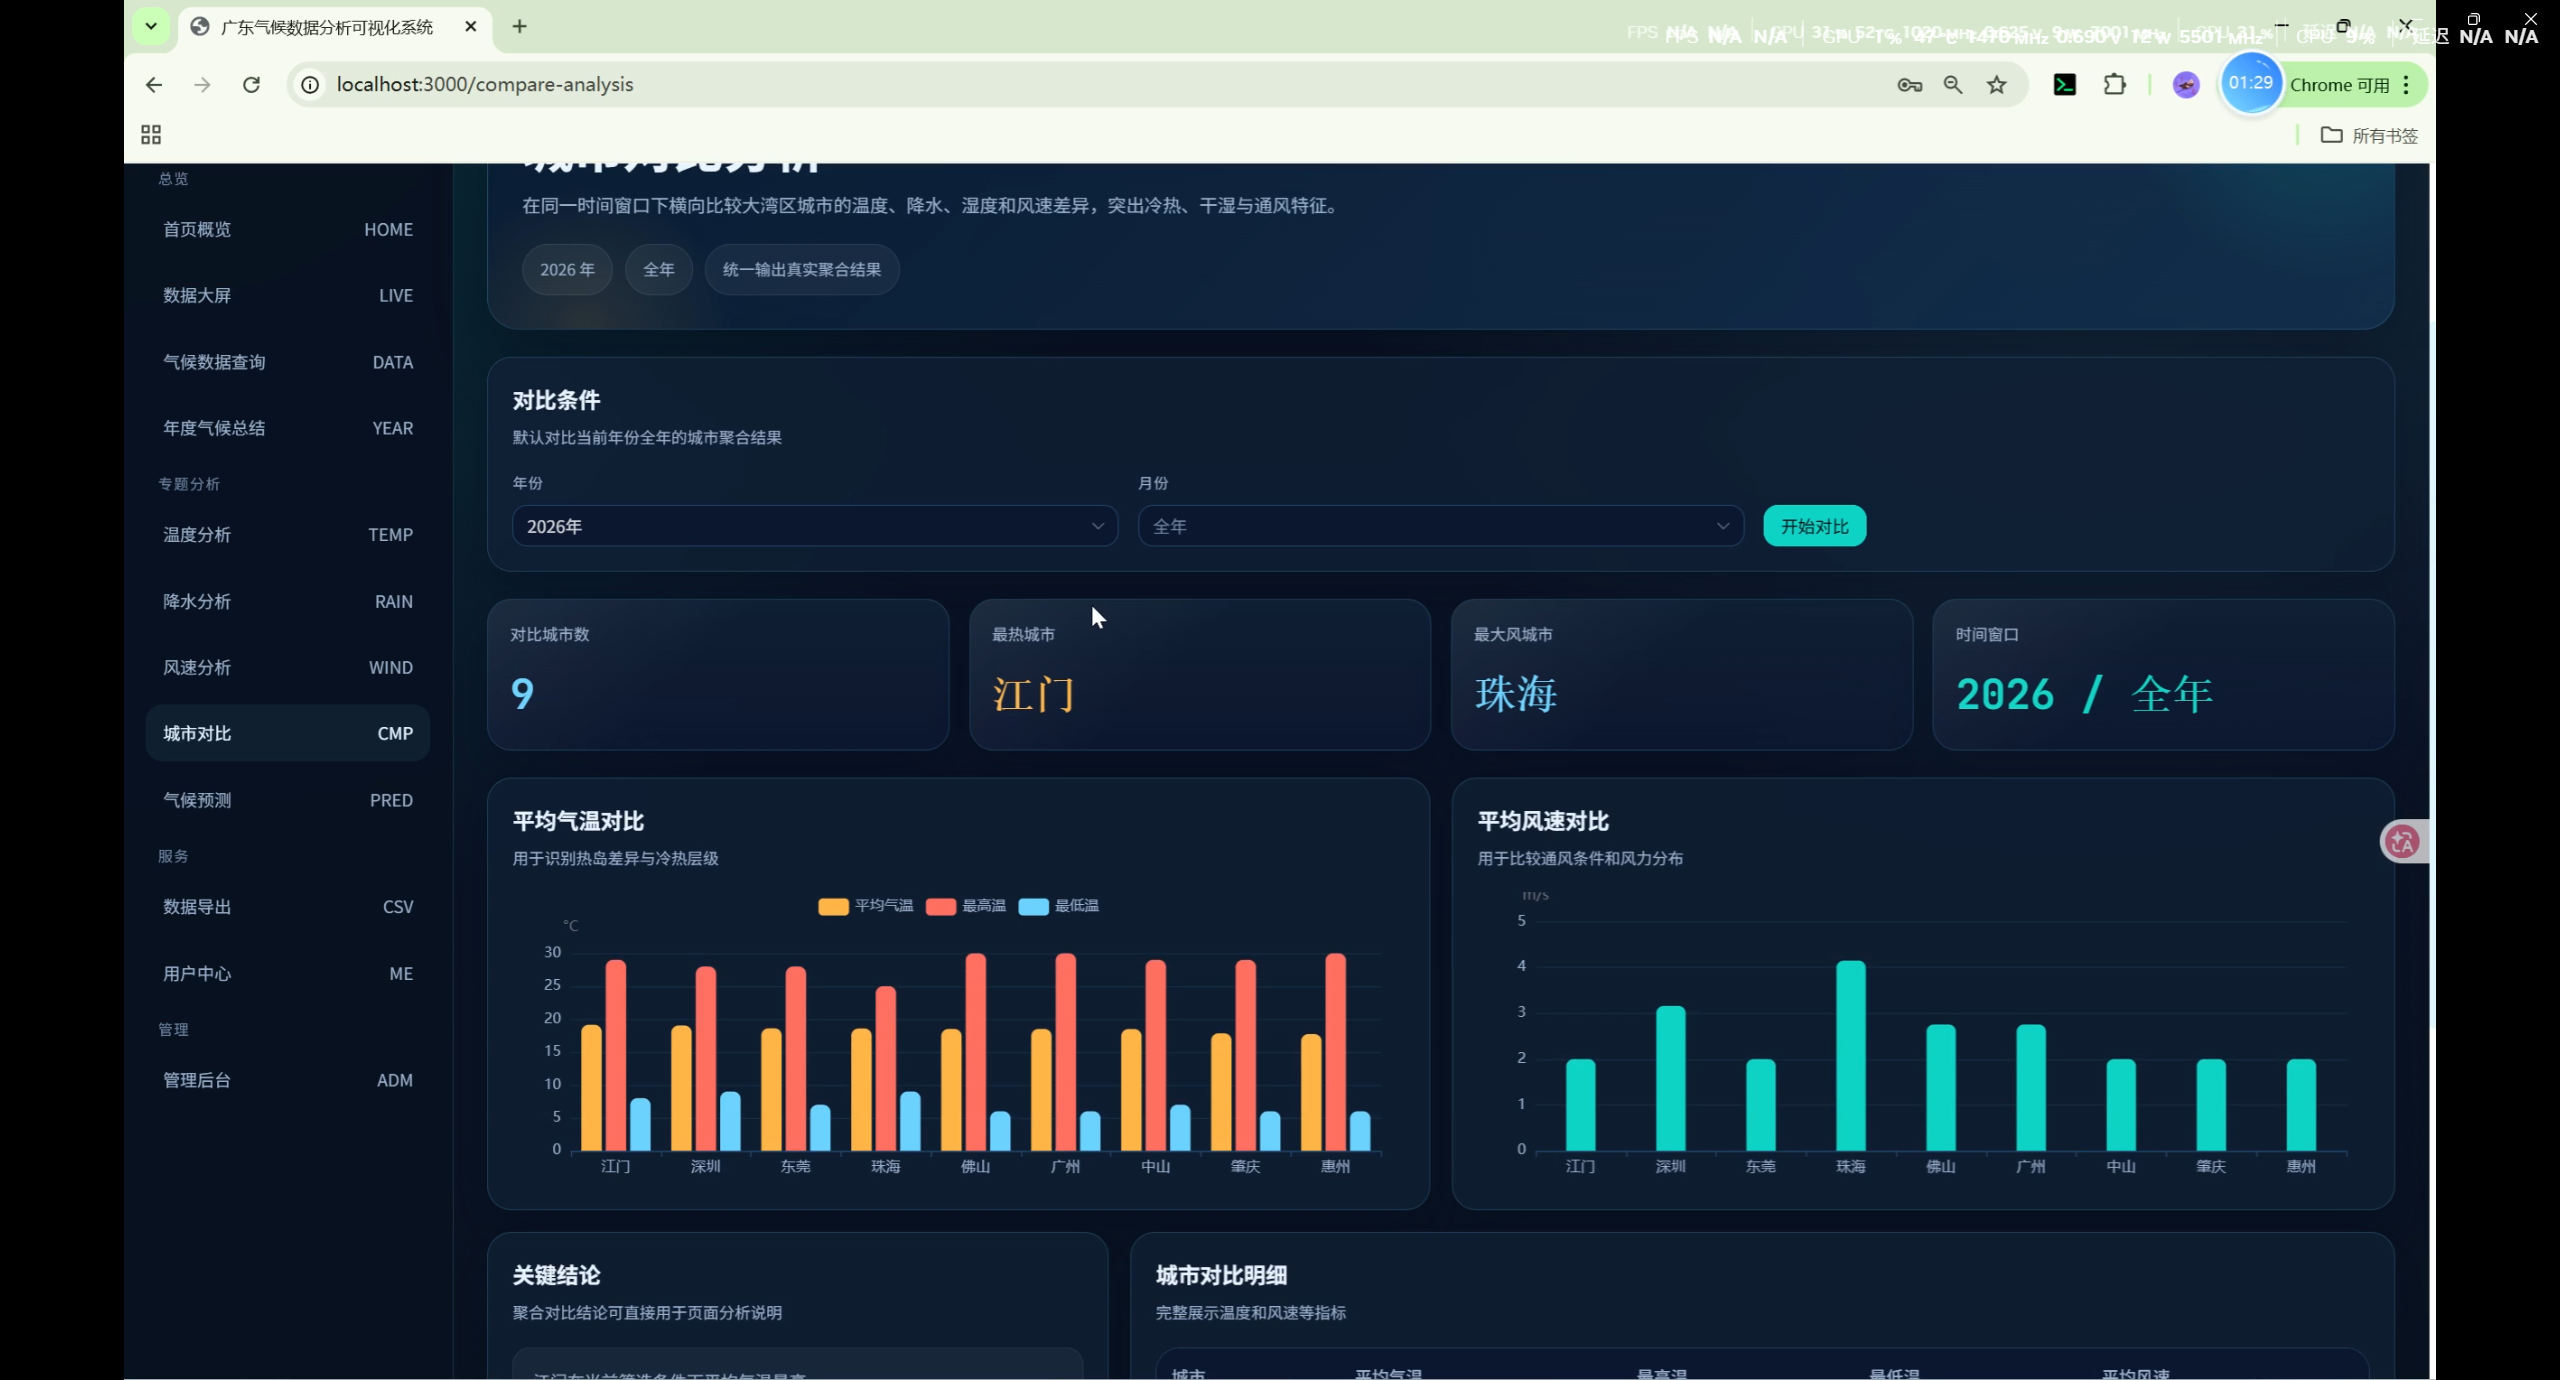
城市对比(CompareAnalysis)
- 选定年份/月份下多城市横向对比
- 气温、风速对比图表
- 关键结论
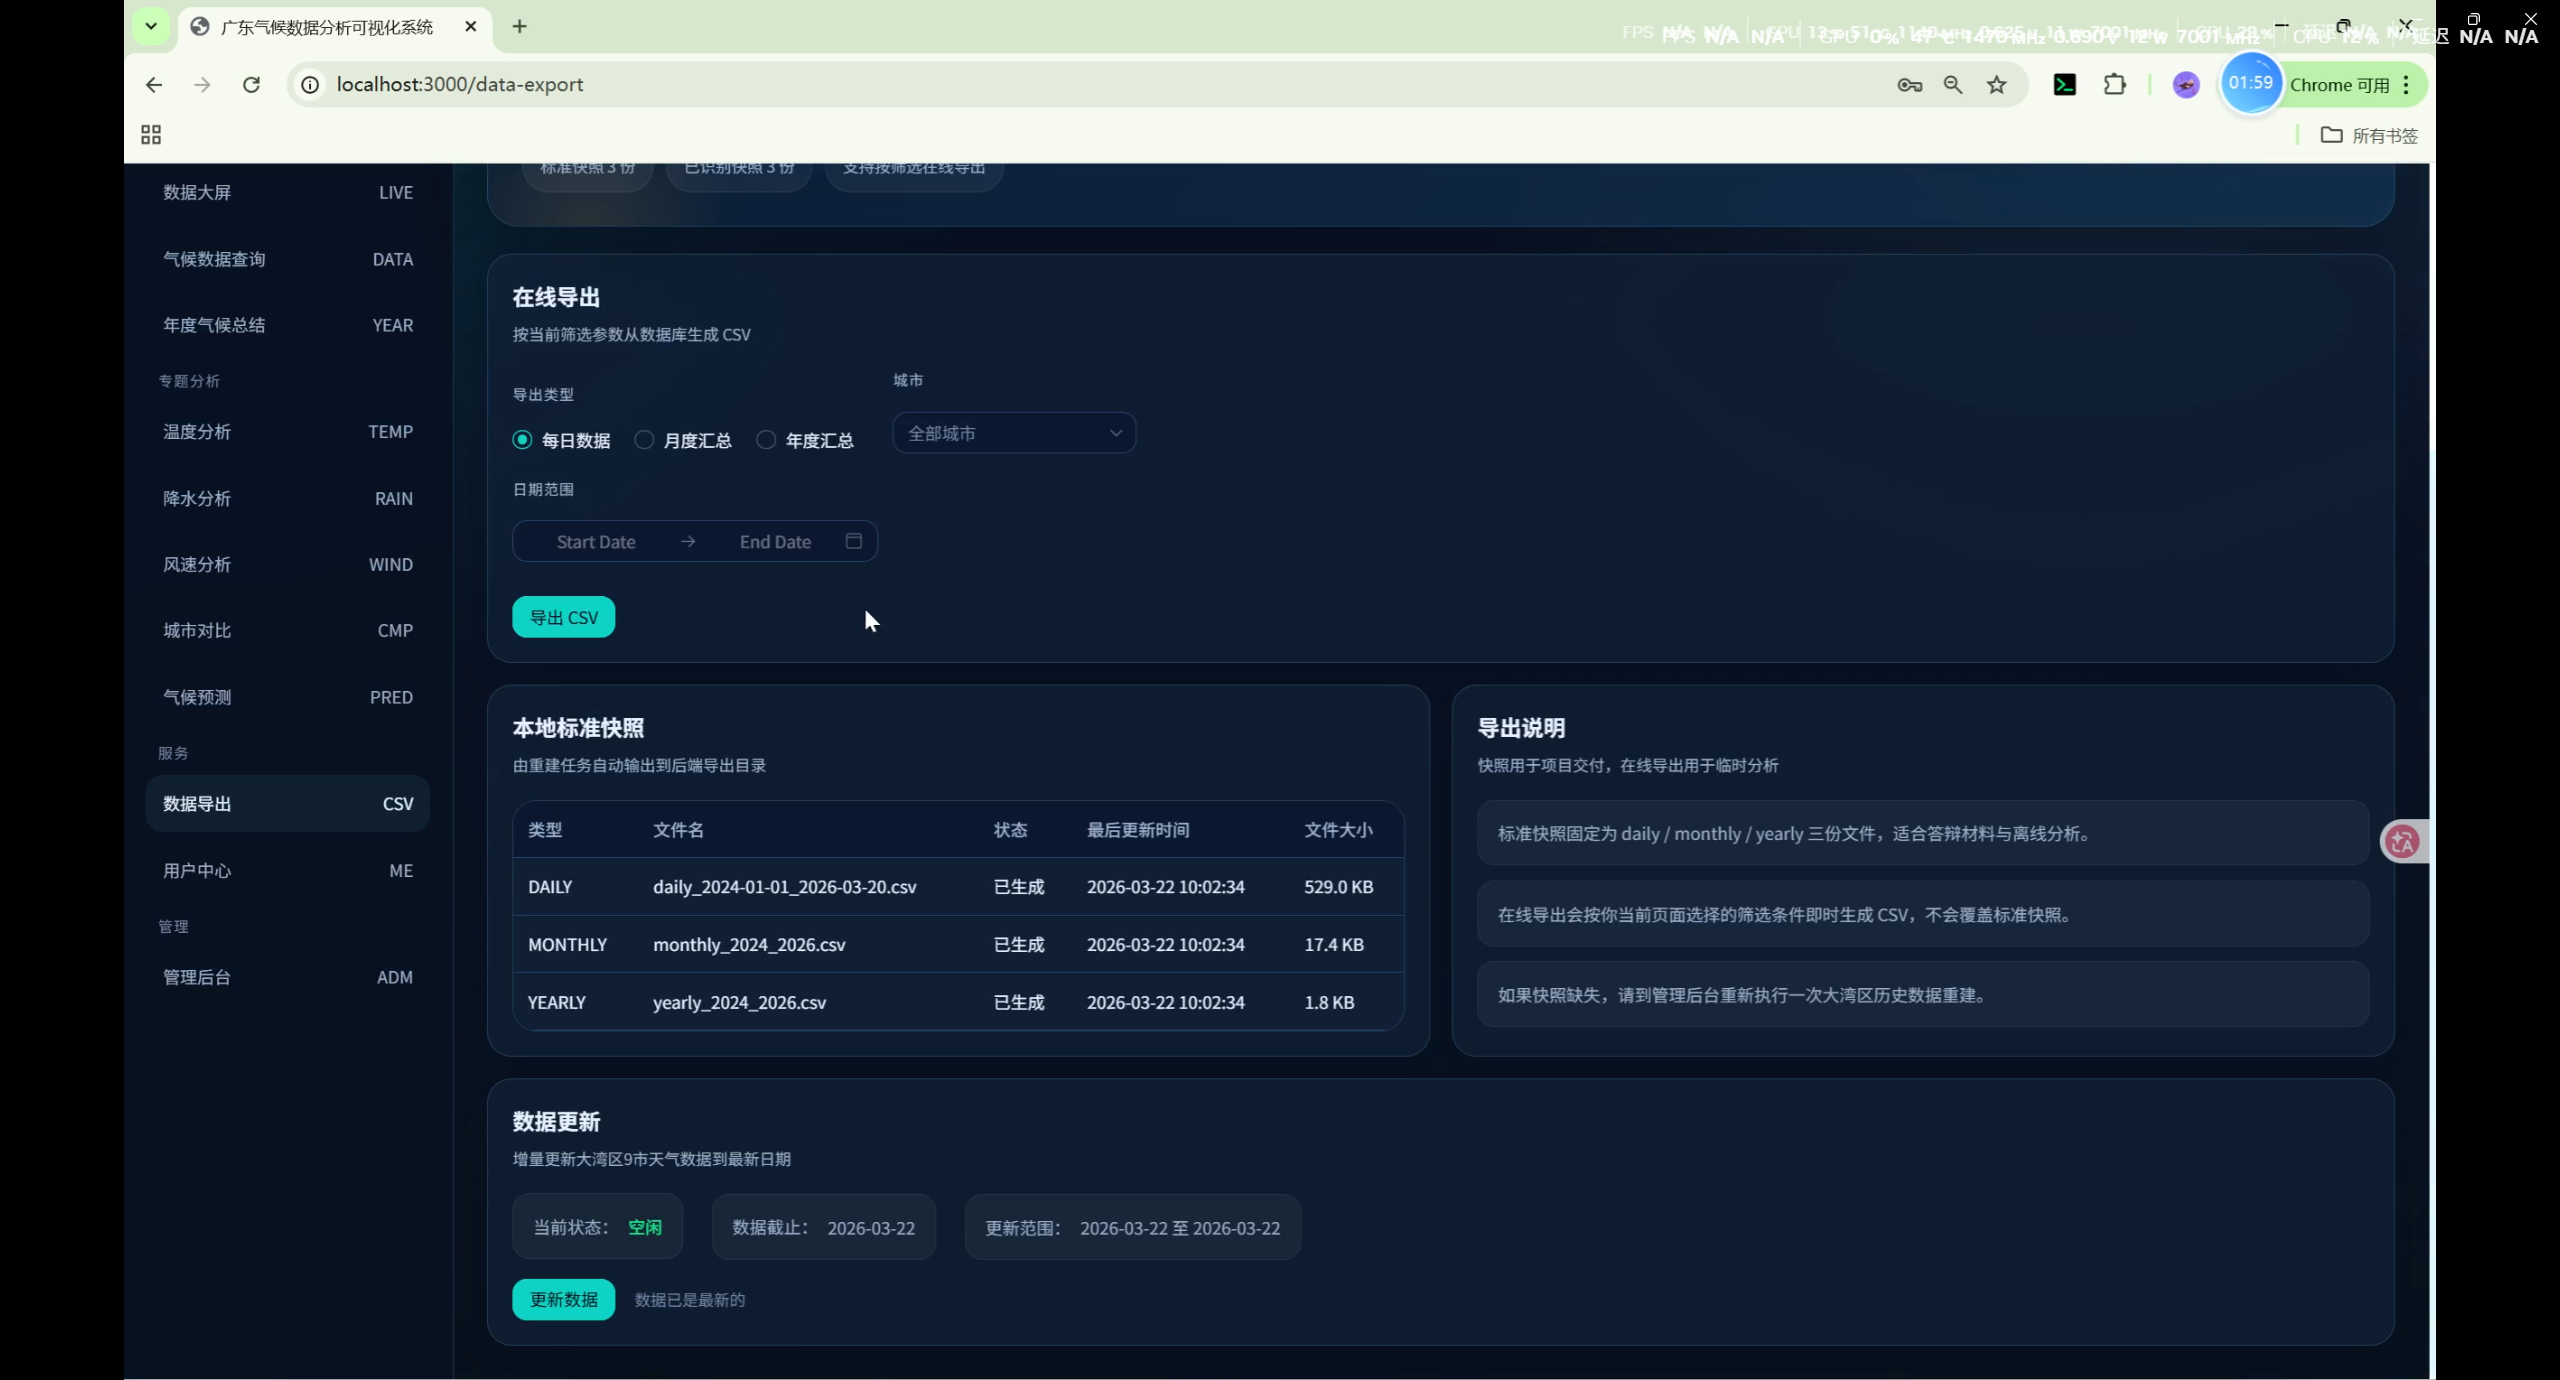
数据导出(DataExport)
- 按类型(每日/月度/年度)和筛选条件在线导出 CSV
- 标准快照状态查看
- 增量更新数据:触发后端爬虫追加最新日期数据
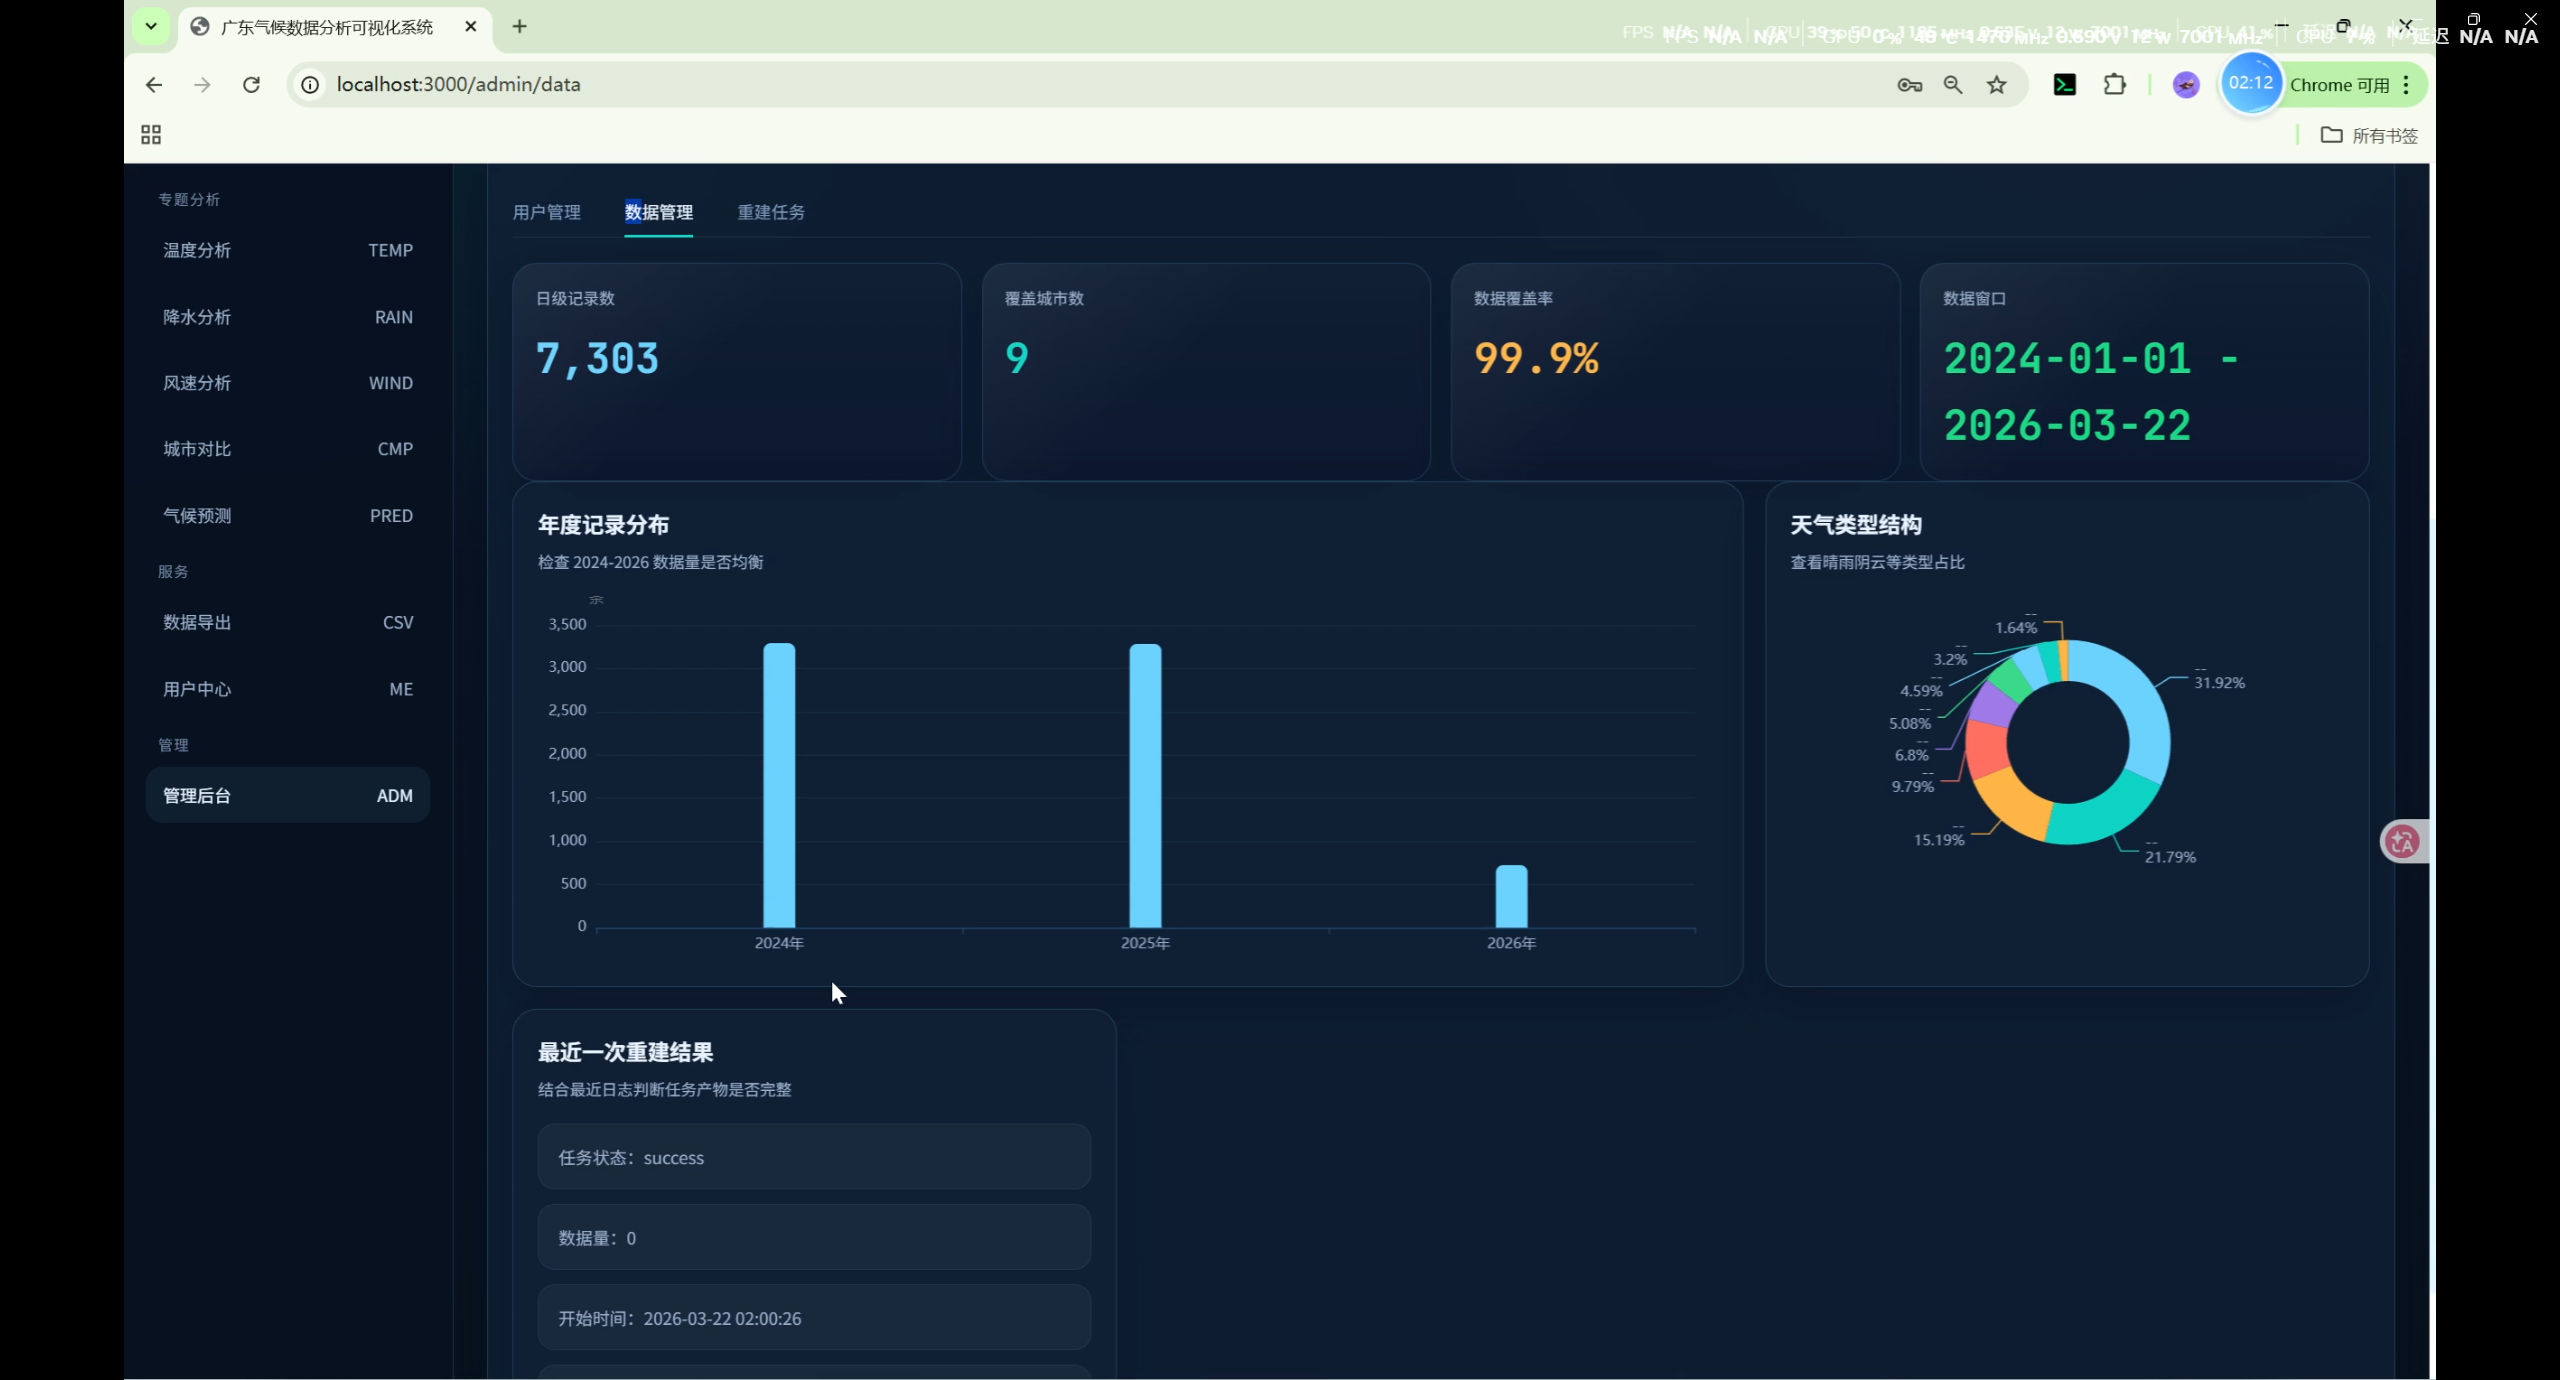
管理后台(Admin)
- 用户管理(管理员)
- 数据总览(记录数、城市数、覆盖率)
- 爬虫控制(启动/停止数据刷新任务)
数据来源
数据源说明
| 数据源 | 说明 | 用途 |
|---|---|---|
| Meteostat | 国际气象数据库,提供全球气象站历史数据 | 主要数据源:温度、降水、风速、湿度,气压 |
| 天气后报 | tianqihoubao.com,提供国内城市历史天气 | 补充天气类型(晴/雨/阴等) |
数据字段
| 字段 | 说明 | 数据来源 |
|---|---|---|
| temp_high / temp_low / temp_avg | 最高/最低/平均气温(°C) | Meteostat |
| precipitation | 降水量 (mm) | Meteostat |
| rain_type | 天气类型 | 天气后报 + 推断 |
| wind_speed | 平均风速 (m/s) | Meteostat + 天气后报 |
| humidity | 相对湿度 (%) | Meteostat |
| pressure_high / pressure_low | 气压 (hPa) | Meteostat |
天气类型
| 代码 | 名称 |
|---|---|
| sunny | 晴 |
| cloudy | 多云 |
| overcast | 阴 |
| windy | 大风 |
| light_rain | 小雨 |
| moderate_rain | 中雨 |
| heavy_rain | 大雨 |
| rainstorm | 暴雨 |
| thunderstorm | 雷阵雨 |
| showers | 阵雨 |
| fog | 雾 |
| haze | 霾 |
大湾区内地9市
| 代码 | 城市 | 类型 | 经度 | 纬度 |
|---|---|---|---|---|
| guangzhou | 广州 | 沿海 | 113.2644 | 23.1291 |
| shenzhen | 深圳 | 沿海 | 114.0579 | 22.5431 |
| zhuhai | 珠海 | 沿海 | 113.5767 | 22.2711 |
| foshan | 佛山 | 内陆 | 113.1227 | 23.0218 |
| dongguan | 东莞 | 内陆 | 113.7633 | 23.0430 |
| zhongshan | 中山 | 沿海 | 113.3826 | 22.5171 |
| huizhou | 惠州 | 沿海 | 114.4158 | 23.1115 |
| jiangmen | 江门 | 沿海 | 113.0781 | 22.5789 |
| zhaoqing | 肇庆 | 内陆 | 112.4651 | 23.0469 |
快速开始
1. 后端启动
bash
# 进入后端目录
cd backend

# 创建虚拟环境
python -m venv venv

# 激活虚拟环境(Windows)
venv\Scripts\activate
# 或 Linux/Mac:
source venv/bin/activate

# 安装依赖
pip install -r requirements.txt

# 执行数据库迁移
python manage.py migrate

# 初始化数据(创建管理员账户)
python init_data.py

# 启动服务
python manage.py runserver
2. 前端启动
bash
# 新开终端,进入前端目录
cd frontend

# 安装依赖
npm install

# 启动开发服务器
npm run dev
3. 初始化气候数据(首次部署)
bash
cd backend
python manage.py shell
python
from apps.airdata.gba_refresh import GBARefreshService
from datetime import date

refresh = GBARefreshService()
# 爬取 2024 年至今的数据(约需 5-10 分钟)
refresh.run_refresh(start_date=date(2024, 1, 1), end_date=date.today(), incremental=True)
默认账户
| 角色 | 用户名 | 密码 |
|---|---|---|
| 管理员 | admin | admin123 |
| 普通用户 | test | test123 |
API 接口
基础说明
- 基础路径:
/api/ - 认证:JWT Token(管理员接口需要)
- 响应格式:
{"code": 200, "data": ...} - 分页响应格式:
{"code": 200, "data": {"items": [...], "pagination": {...}}}
用户接口
| 方法 | 路径 | 说明 |
|---|---|---|
| POST | /api/users/register/ | 用户注册 |
| POST | /api/users/login/ | 用户登录 |
| GET | /api/users/profile/ | 获取个人信息 |
| PUT | /api/users/profile/ | 更新个人信息 |
| POST | /api/users/change-password/ | 修改密码 |
气候数据接口
| 方法 | 路径 | 说明 |
|---|---|---|
| GET | /api/airdata/cities/ | 城市列表 |
| GET | /api/airdata/data/ | 每日气候数据(支持 city/start_date/end_date/page_size 筛选) |
| GET | /api/airdata/monthly/ | 月度汇总 |
| GET | /api/airdata/yearly/ | 年度汇总 |
| GET | /api/airdata/dashboard/ | 大屏数据(自动选择完整数据日期) |
| GET | /api/airdata/statistics/ | 数据统计 |
| GET | /api/airdata/spider-logs/ | 爬虫日志 |
| POST | /api/airdata/spider/ | 启动数据刷新 |
| DELETE | /api/airdata/spider/ | 停止数据刷新 |
| GET | /api/airdata/spider/status/ | 爬虫状态 |
| GET | /api/airdata/export/ | 导出 CSV |
分析接口
| 方法 | 路径 | 说明 |
|---|---|---|
| GET | /api/analysis/climate/ | 综合气候分析 |
| GET | /api/analysis/yearly/ | 年度分析 |
| GET | /api/analysis/monthly/ | 月度分析 |
| GET | /api/analysis/temperature/ | 温度分析 |
| GET | /api/analysis/precipitation/ | 降水分析 |
| GET | /api/analysis/humidity/ | 湿度分析 |
| GET | /api/analysis/wind/ | 风速分析 |
| GET | /api/analysis/city-compare/ | 城市对比 |
数据库模型
City(城市)
| 字段 | 类型 | 说明 |
|---|---|---|
| id | Integer | 主键 |
| code | String | 代码(如 guangzhou) |
| name | String | 名称 |
| province | String | 省份 |
| city_type | String | 沿海/内陆 |
| longitude | Decimal | 经度 |
| latitude | Decimal | 纬度 |
| is_active | Boolean | 是否激活 |
ClimateData(每日气候数据)
| 字段 | 类型 | 说明 |
|---|---|---|
| id | Integer | 主键 |
| city | FK(City) | 所属城市 |
| date | Date | 日期 |
| temp_high | Decimal | 最高温(°C) |
| temp_low | Decimal | 最低温(°C) |
| temp_avg | Decimal | 平均温(°C) |
| precipitation | Decimal | 降水量(mm) |
| rain_type | String | 天气类型 |
| wind_speed | Decimal | 平均风速(m/s) |
| wind_speed_max | Decimal | 最大风速(m/s) |
| wind_direction | String | 风向 |
| humidity | Decimal | 湿度(%) |
| pressure_high | Decimal | 最高气压(hPa) |
| pressure_low | Decimal | 最低气压(hPa) |
| cloud_cover | Decimal | 云量(%) |
| aqi | Integer | 空气质量指数 |
| aqi_level | String | AQI 等级 |
MonthlyClimateSummary(月度汇总)
| 字段 | 类型 | 说明 |
|---|---|---|
| city | FK(City) | 所属城市 |
| year | Integer | 年份 |
| month | Integer | 月份 |
| avg_temp_high | Decimal | 月均最高温 |
| avg_temp_low | Decimal | 月均最低温 |
| avg_temp | Decimal | 月均温 |
| max_temp | Decimal | 月极端高温 |
| min_temp | Decimal | 月极端低温 |
| total_precipitation | Decimal | 月总降水量 |
| rainy_days | Integer | 雨天数 |
| avg_wind_speed | Decimal | 月均风速 |
| dominant_weather | String | 主导天气类型 |
YearlyClimateSummary(年度汇总)
| 字段 | 类型 | 说明 |
|---|---|---|
| city | FK(City) | 所属城市 |
| year | Integer | 年份 |
| annual_avg_temp | Decimal | 年均温 |
| max_temp_record | Decimal | 年极端高温 |
| min_temp_record | Decimal | 年极端低温 |
| hot_days | Integer | 高温天数 |
| cold_days | Integer | 低温天数 |
| annual_precipitation | Decimal | 年总降水量 |
| rainy_days_total | Integer | 年总雨天数 |
| heavy_rain_days | Integer | 暴雨天数 |
| annual_avg_wind_speed | Decimal | 年均风速 |
SpiderLog(爬虫日志)
| 字段 | 类型 | 说明 |
|---|---|---|
| city | FK(City) | 关联城市 |
| start_time | DateTime | 开始时间 |
| end_time | DateTime | 结束时间 |
| status | String | running/success/failed |
| data_count | Integer | 获取数据条数 |
| error_message | Text | 错误信息 |
注意事项
- 数据爬取依赖 Meteostat API 和天气后报网站,需保持网络畅通
- 增量更新会追加数据,不会删除已有记录
- 生产环境请修改
config/settings.py中的SECRET_KEY和数据库配置 - 建议使用 HTTPS 部署
- Dashboard 等展示页面优先选择有完整9市数据的日期(往前最多追溯7天)
功能实现详解
1. 数据刷新服务(GBARefreshService)
数据刷新是系统的核心模块,负责从外部数据源获取并入库气候数据。
位置 :backend/apps/airdata/gba_refresh.py
核心流程:
用户触发刷新 → GBARefreshService.run_refresh()
  ↓
同步城市数据(GBA_CITY_DEFINITIONS → City 表)
  ↓
遍历 9 个城市,对每个城市:
  ├─ fetch_weather_lookup()      # 获取天气后报历史数据
  ├─ fetch_meteostat_frame()     # 获取 Meteostat 气象数据
  ├─ build_city_records()        # 合并数据,构建 ClimateData 记录
  └─ bulk_create / update_or_create  # 写入数据库
  ↓
generate_summary()               # 生成月度/年度汇总
  ↓
写 CSV 快照文件到 exports/gba_snapshots/增量刷新逻辑:
python
def run_refresh(self, start_date, end_date, incremental=False, write_csv=True):
    if incremental:
        # 增量模式:只插入新记录,不更新已有记录
        existing_dates = set(
            ClimateData.objects
            .filter(city=city, date__gte=start_date, date__lte=end_date)
            .values_list('date', flat=True)
        )
        for data in records:
            if data['date'] not in existing_dates:
                ClimateData.objects.create(**data)
    else:
        # 全量模式:先删除再重建
        ClimateData.objects.filter(...).delete()
        ClimateData.objects.bulk_create(records)
天气类型 rain_type 处理逻辑:
python
# 优先使用天气后报的 rain_type
rain_type = weather.get("rain_type") or infer_rain_type(precipitation, cloud_cover)

# infer_rain_type 推断规则
def infer_rain_type(precipitation, cloud_cover):
    if precipitation is not None:
        if precipitation >= 50: return "rainstorm"    # 暴雨
        if precipitation >= 25: return "heavy_rain"   # 大雨
        if precipitation >= 10: return "moderate_rain" # 中雨
        if precipitation > 0:   return "light_rain"   # 小雨
    if cloud_cover is not None:
        if cloud_cover >= 85: return "overcast"          # 阴
        if cloud_cover >= 45: return "cloudy"          # 多云
    return "sunny"                                       # 默认为晴
2. 用户认证机制
技术方案:JWT(JSON Web Token)
流程:
注册/登录请求
    ↓
Django REST Framework SimpleJWT
    ↓
验证用户名密码 → 生成 access_token + refresh_token
    ↓
返回 token 给前端
    ↓
前端存储在 localStorage,每次请求携带
Authorization: Bearer <access_token>
    ↓
后端 JWTAuthentication 中间件验证
    ↓
验证成功 → 注入 request.user
3. 前端页面路由与权限
路由守卫:
javascript
// router/index.js
routes = [
  { path: '/login', name: 'Login' },
  { path: '/register', name: 'Register' },
  {
    path: '/',
    component: Layout,
    meta: { requiresAuth: true },
    children: [
      { path: '', name: 'Home', component: Home },
      { path: 'dashboard', name: 'Dashboard', component: Dashboard },
      { path: 'prediction-analysis', name: 'PredictionAnalysis', component: PredictionAnalysis },
      // ... 其他需要登录的页面
      {
        path: 'admin',
        component: AdminIndex,
        meta: { requiresAuth: true, requiresAdmin: true },
        children: [Users, Data, Spider]
      }
    ]
  }
]权限控制:
javascript
router.beforeEach((to, from, next) => {
  const token = localStorage.getItem('token')
  const isAdmin = localStorage.getItem('isAdmin') === 'true'

  if (to.meta.requiresAuth && !token) {
    next('/login')  // 未登录跳转登录页
  } else if (to.meta.requiresAdmin && !isAdmin) {
    next('/')        // 非管理员跳转首页
  } else {
    next()
  }
})
4. 数据大屏实现(Dashboard)
Dashboard.vue 核心逻辑:
javascript
// 数据获取
async function loadDashboard() {
  const res = await api.getDashboardData()
  statistics.value = res.data.statistics     // 全域统计
  ranking.value = res.data.temp_ranking     // 城市排行
  todayData.value = res.data.today_data     // 当日快照
  trendData.value = res.data.trend_data     // 30日趋势
  weatherDistribution.value = res.data.weather_distribution  // 天气分布
}

// ECharts 趋势图
chart.setOption({
  tooltip: { trigger: 'axis' },
  legend: { data: ['平均气温', '总降水'] },
  xAxis: { type: 'category', data: dates },
  yAxis: [
    { type: 'value', name: '°C / mm', ... }
  ],
  series: [
    { name: '平均气温', type: 'line', smooth: true, ... },
    { name: '总降水', type: 'bar', ... }
  ]
})
后端 Dashboard API:
python
class DashboardView(APIView):
    def get(self, request):
        # 自动选择有足够城市数据的日期(优先完整数据)
        latest_date = get_latest_full_data_date(min_cities=8)
        latest_qs = ClimateData.objects.filter(date=latest_date, city__is_active=True)

        # 天气分布(排除 rain_type 为空)
        weather_distribution = normalize_weather_distribution(latest_qs)

        # 趋势数据(近30日)
        trend_qs = (
            ClimateData.objects
            .filter(date__gte=latest_date - timedelta(29), date__lte=latest_date)
            .values('date')
            .annotate(avg_temp=Avg('temp_avg'), total_precipitation=Sum('precipitation'))
        )

        return Response({
            'latest_date': latest_date,
            'statistics': { 'avg_temp': ..., 'city_count': ... },
            'temp_ranking': top_cities_by_temp,
            'today_data': ClimateDataSerializer(latest_qs, many=True).data,
            'trend_data': list(trend_qs),
            'weather_distribution': weather_distribution,
        })
5. 3D GIS 气候地图实现(Climate3DMap)
技术选型:ECharts 2D geo 组件(非 geo3D,避免注册冲突)
javascript
// 初始化广东地图
echarts.init(dom)
fetch('https://geo.datav.aliyun.com/areas_v3/bound/440000_full.json')
  .then(res => res.json())
  .then(geoJson => {
    echarts.registerMap('guangdong', geoJson)
    chart.setOption({
      geo: {
        map: 'guangdong',
        roam: true,
        // ...
      }
    })
  })

// 城市ID映射:前后端城市标识不一致解决方案
// 前端 cityOptions.value = 'guangzhou'
// 后端 City.id = 数字
// 动态请求 /api/airdata/cities/ 建立 city.code → city.id 映射
async function loadCityMapping() {
  const res = await axios.get('/api/airdata/cities/')
  const cities = res.data?.data?.items || []
  cities.forEach(c => {
    cityCodeToId[c.code] = c.id
  })
}

// 自动选择完整数据日期:往前找1/2/3/5/7天
for (const daysBack of [1, 2, 3, 5, 7]) {
  const dateStr = getDateNDaysAgo(daysBack)
  const res = await axios.get('/api/airdata/data/', {
    params: { start_date: dateStr, end_date: dateStr }
  })
  const uniqueCities = new Set(rows.map(r => r.city))
  if (uniqueCities.size >= 9) { targetDate = dateStr; break }
}
6. 气候预测分析实现(PredictionAnalysis)
三种预测模型算法:
javascript
// 1. 线性回归:斜率外推
if (filters.model === 'lr') {
  const lr = linearRegression(smoothed)
  for (let i = 1; i <= 30; i++) {
    future.push(lr.slope * (lastIdx + i) + lr.intercept)
  }
}

// 2. 移动平均:7天周期模式 + 衰减波动 + 趋势延续
if (filters.model === 'ma') {
  const patternLen = 7
  const recentVals = smoothed.slice(-patternLen)
  for (let i = 1; i <= futureLen; i++) {
    const patternIdx = (i - 1) % patternLen
    const trendEffect = lrResult.slope * i * 0.3
    const noise = (Math.random() - 0.5) * varStd * Math.exp(-i * 0.08) * 0.5
    future.push(recentVals[patternIdx] + trendEffect + noise)
  }
}

// 3. 指数平滑:阻尼振荡
if (filters.model === 'exp') {
  const alpha = 0.3, dampedRatio = 0.85, cycleLen = 7
  for (let i = 1; i <= futureLen; i++) {
    const oscillation = amp * Math.sin((i-1) * 2*Math.PI/cycleLen) * Math.pow(dampedRatio, i)
    const meanReversion = (lastSmooth - level) * Math.pow(0.9, i)
    nextVal = alpha * (lastSmooth + meanReversion) + (1-alpha) * lastSmooth + oscillation
  }
}
API 数据获取 :使用 start_date/end_date 范围 + page_size=200 绕过默认20条分页限制
javascript
const startDate = getDateStr(90)  // 90天前
const endDate = getDateStr(1)      // 昨天
const res = await axios.get('/api/airdata/data/', {
  params: { city: 'guangzhou', start_date: startDate, end_date: endDate, page_size: 200 }
})
const rows = res.data?.data?.items || []
7. 多维数据分析实现
分析视图(Analysis Views):
所有分析视图统一返回结构:
python
{
    "code": 200,
    "data": {
        "summary": { ... },       # 聚合摘要
        "series": {
            "categories": ["1月", "2月", ...],  # X轴标签
            "items": [                           # 多城市数据
                {"name": "广州", "values": [15.2, 16.8, ...]},
                {"name": "深圳", "values": [16.1, 17.5, ...]},
            ]
        },
        "table": [...],          # 明细表格
        "insights": [...]         # 关键结论
    }
}
8. 数据导出实现
CSV 导出流程:
用户选择导出条件(类型/城市/日期范围)
    ↓
GET /api/airdata/export/?type=daily&city_id=1&start_date=...
    ↓
DataExportView 构建查询
    ↓
HttpResponse(content_type='text/csv')
    ↓
CSVWriter 生成文件流
    ↓
浏览器下载
9. 前端状态管理(Pinia)
用户状态(stores/user.js):
javascript
export const useUserStore = defineStore('user', {
  state: () => ({
    token: localStorage.getItem('token') || '',
    userInfo: null,
  }),

  actions: {
    async login(username, password) {
      const res = await api.login({ username, password })
      this.token = res.data.access
      localStorage.setItem('token', this.token)
      await this.fetchUserInfo()
    },

    async fetchUserInfo() {
      const res = await api.getProfile()
      this.userInfo = res.data
    },

    logout() {
      this.token = ''
      this.userInfo = null
      localStorage.removeItem('token')
      router.push('/login')
    }
  }
})
10. 统一响应格式
后端统一响应:
python
# 成功响应
{"code": 200, "data": {...}}

# 错误响应
{"code": 400, "message": "参数错误"}
{"code": 401, "message": "未登录"}
{"code": 403, "message": "权限不足"}
{"code": 500, "message": "服务器内部错误"}前端统一处理(api/index.js):
javascript
axios.interceptors.response.use(
  response => response.data,
  error => {
    if (error.response?.status === 401) {
      userStore.logout()
      router.push('/login')
    }
    return Promise.reject(error)
  }
)
11. 数据库聚合查询模式
系统大量使用 Django ORM 的聚合功能:
python
from django.db.models import Avg, Sum, Max, Min, Count, Q

# 月度聚合示例
stats = (
    ClimateData.objects
    .filter(city=city, date__year=year, date__month=month)
    .aggregate(
        avg_temp_high=Avg('temp_high'),
        avg_temp_low=Avg('temp_low'),
        avg_temp=Avg('temp_avg'),
        max_temp=Max('temp_high'),
        min_temp=Min('temp_low'),
        total_precipitation=Sum('precipitation'),
        avg_wind_speed=Avg('wind_speed'),
    )
)

# 天气类型统计
weather_counts = (
    ClimateData.objects
    .exclude(rain_type="")
    .values('rain_type')
    .annotate(count=Count('id'))
    .order_by('-count')
)
dominant_weather = weather_counts[0]['rain_type'] if weather_counts else 'sunny'
12. 前端 ECharts 图表封装模式
每个图表遵循统一模式:
javascript
// 1. 初始化图表容器
const chartRef = ref(null)
let chart = null

// 2. 在 onMounted 中初始化
onMounted(() => {
  chart = echarts.init(chartRef.value)
  updateChart()
  window.addEventListener('resize', resizeChart)
})

// 3. 更新图表
function updateChart() {
  chart.setOption({
    tooltip: { trigger: 'axis' },
    legend: { data: [...], textStyle: { color: '#9bb2cf' } },
    grid: { top: 48, left: 48, right: 20, bottom: 28 },
    xAxis: { type: 'category', data: categories, ... },
    yAxis: { type: 'value', name: '单位', ... },
    series: [...]
  })
}

// 4. 响应式调整
function resizeChart() { chart?.resize() }

// 5. 在 onUnmounted 中销毁
onUnmounted(() => {
  window.removeEventListener('resize', resizeChart)
  chart?.dispose()
})