Python二手房数据可视化分析系统
项目概述
本项目是一个基于Django框架开发的二手房数据可视化分析系统,集成了用户管理、房源浏览、数据可视化、个性化推荐和房价预测等功能。系统通过直观的界面展示二手房市场数据,帮助用户更好地了解房价趋势和市场动态,为购房决策提供参考。
技术栈
- 后端框架:Django 5.1
- 前端技术:HTML、CSS、JavaScript、ECharts
- 数据处理:Pandas、NumPy
- 机器学习:Scikit-learn(线性回归)
- 数据库:SQLite
- 其他库:Jieba(分词)
功能模块详解
1. 登录注册
登录注册模块实现了用户的身份验证和账户管理功能,确保用户数据的安全性和个性化体验。
核心代码:
python
def login(request):
    if request.method == 'GET':
        return render(request, 'login.html')
    if request.method == 'POST':
        name = request.POST.get('name')
        password = request.POST.get('password')
        if User.objects.filter(username=name, password=password):
            user=User.objects.get(username=name, password=password)
            request.session['username'] = {'username':user.username,'avatar':str(user.avatar)}
            return redirect('index')
        else:
            msg = '信息错误!'
            return render(request, 'login.html', {"msg": msg})

def register(request):
    if request.method == 'POST':
        name = request.POST.get('name')
        password = request.POST.get('password')
        phone = request.POST.get('phone')
        email = request.POST.get('email')
        avatar = request.FILES.get('avatar')
        stu = User.objects.filter(username=name)
        if stu:
            msg = '用户已存在!'
            return render(request, 'register.html', {"msg": msg})
        else:
            User.objects.create(username=name,password=password,phone=phone,email=email,avatar=avatar)
            msg = "注册成功!"
            return render(request, 'login.html', {"msg": msg})
    if request.method == 'GET':
        return render(request,'register.html')
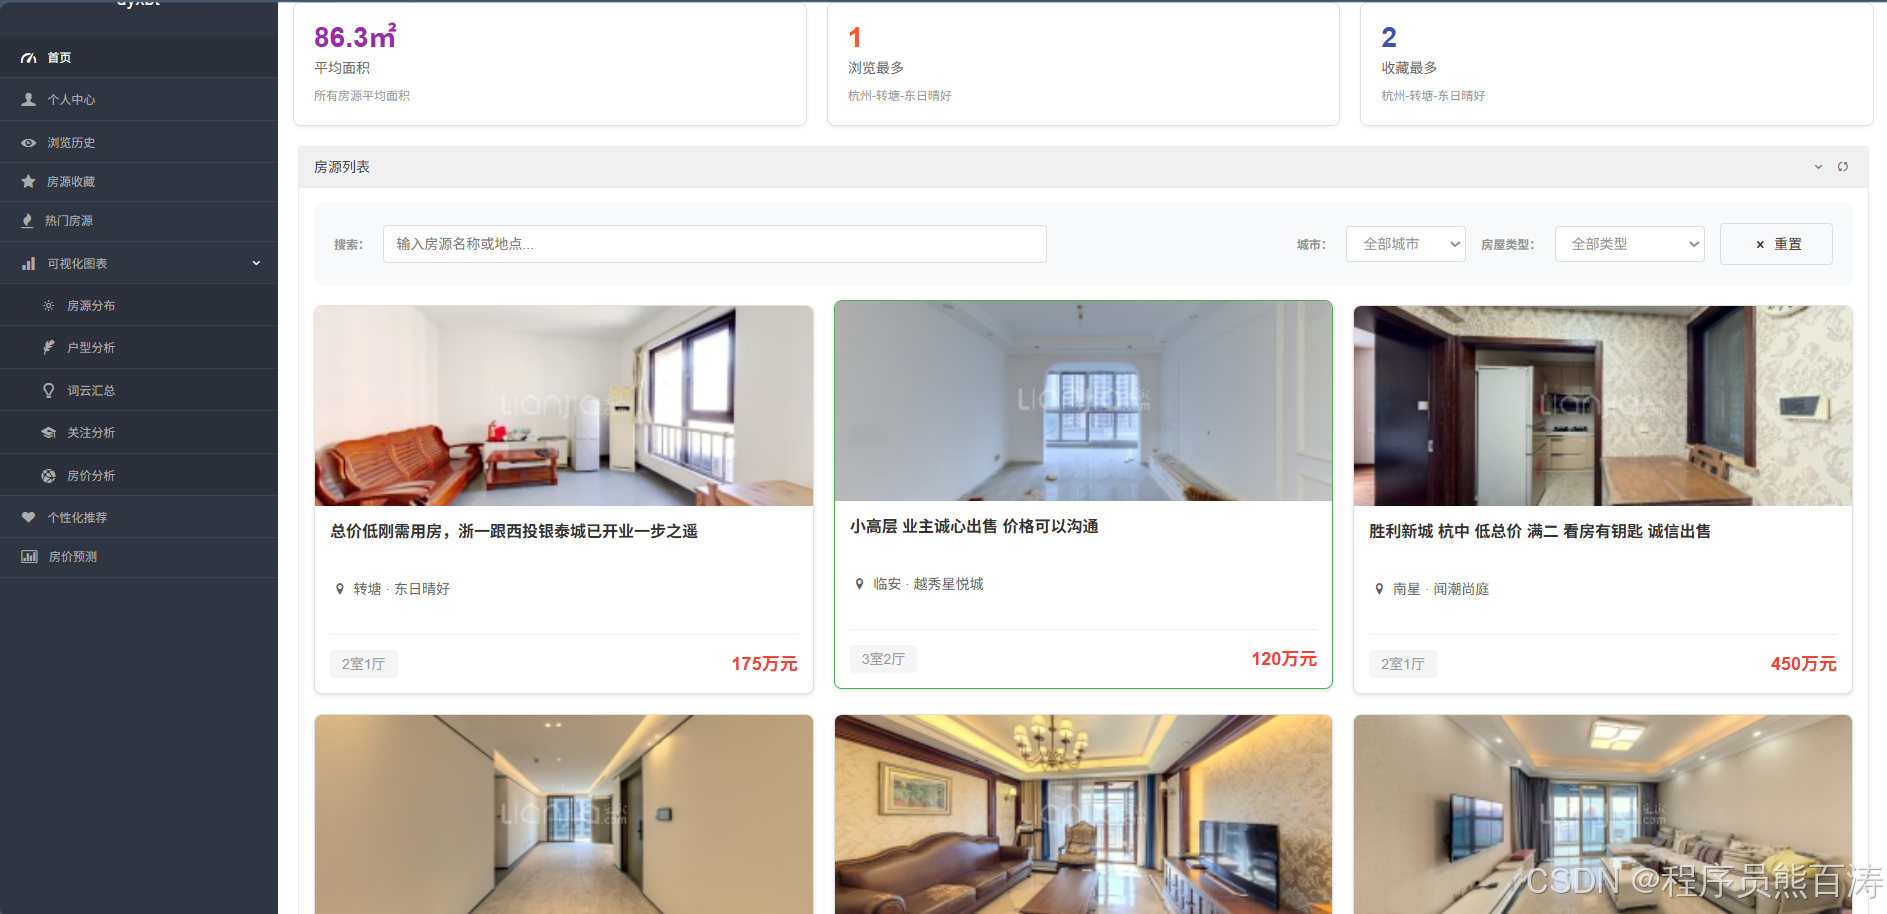
2. 首页
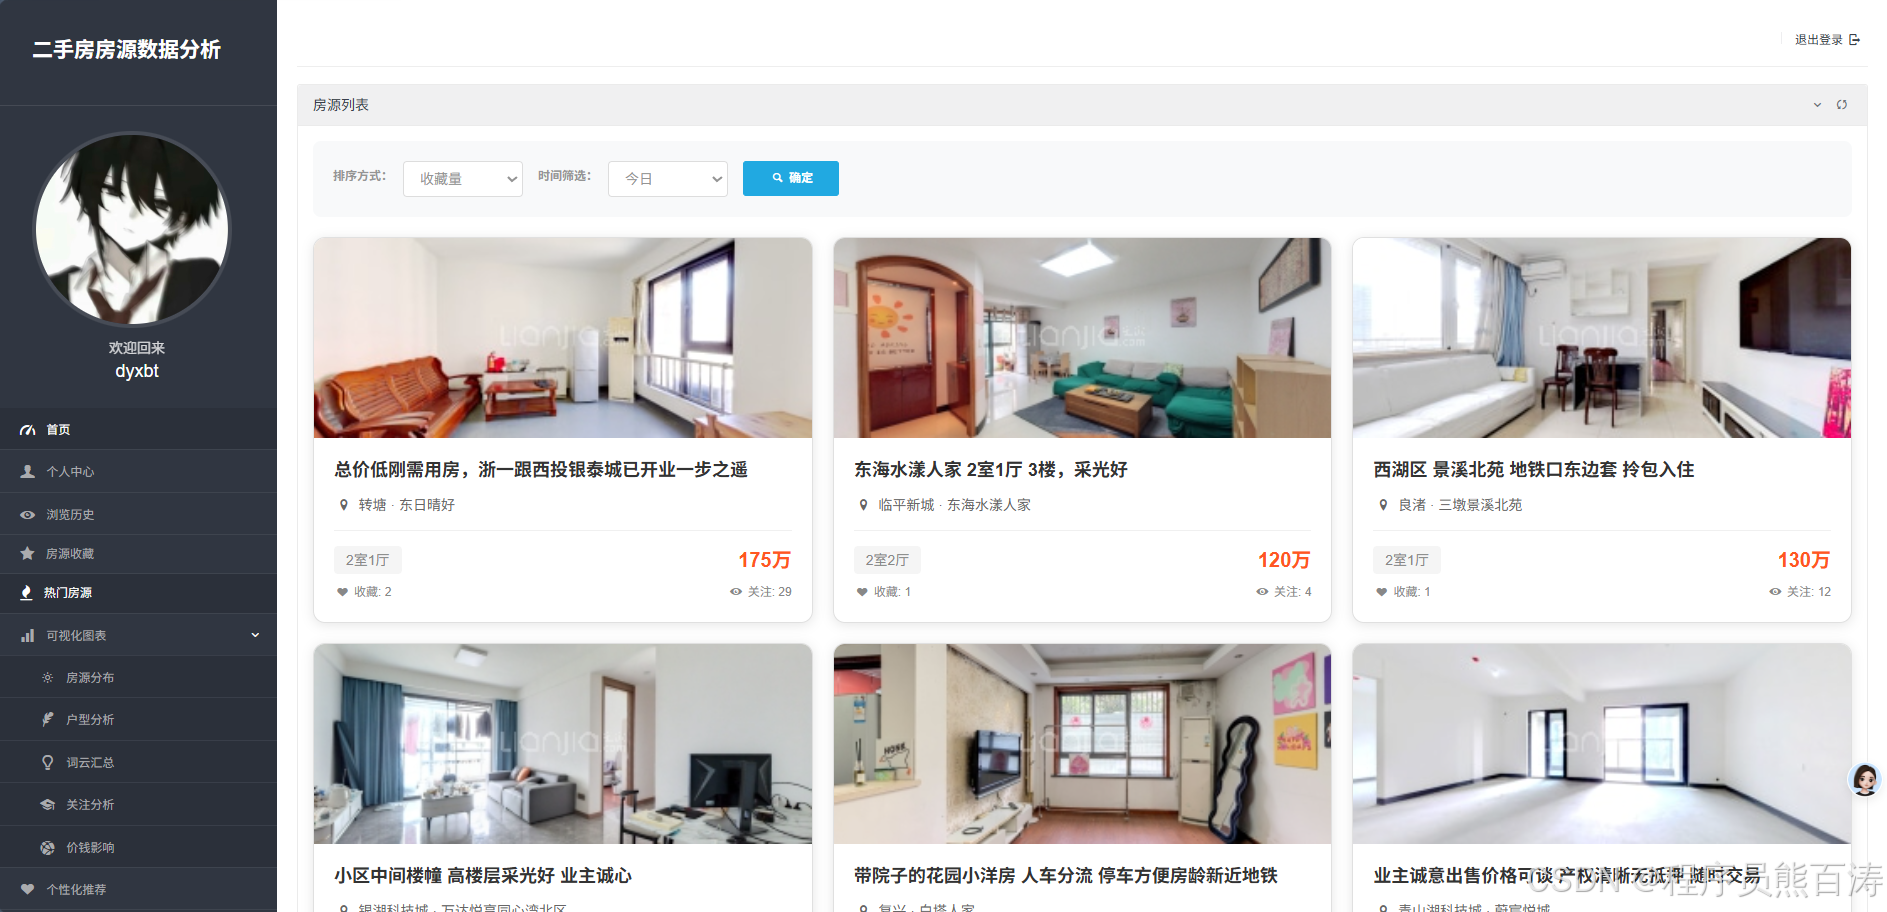
首页是系统的核心展示页面,集成了房源搜索、数据统计和热门房源推荐等功能,为用户提供全面的市场概览。
核心功能:
- 房源搜索与筛选(按关键词、房屋类型、城市)
- 数据统计(房源总量、用户总量、关注最多的小区等)
- 热门房源展示
核心代码:
python
def index(request):
    # 获取用户信息
    username = request.session['username'].get('username')
    useravatar = request.session['username'].get('avatar')

    # 房源数据处理
    houses = House.objects.all().distinct()

    # 获取搜索参数
    search_query = request.GET.get('search', '')
    selected_type = request.GET.get('house_type', '')
    selected_city = request.GET.get('city', '')

    # 应用搜索和筛选
    if search_query:
        houses = houses.filter(
            Q(title__icontains=search_query) |
            Q(location__icontains=search_query) |
            Q(community__icontains=search_query)
        )

    if selected_type:
        houses = houses.filter(house_type=selected_type)

    if selected_city:
        houses = houses.filter(city=selected_city)

    # 数据统计和处理
    # ...(数据统计代码)

    context = {
        'username': username,
        'useravatar': useravatar,
        'houses': houses,
        # ...(其他上下文数据)
    }
    return render(request, 'index.html', context)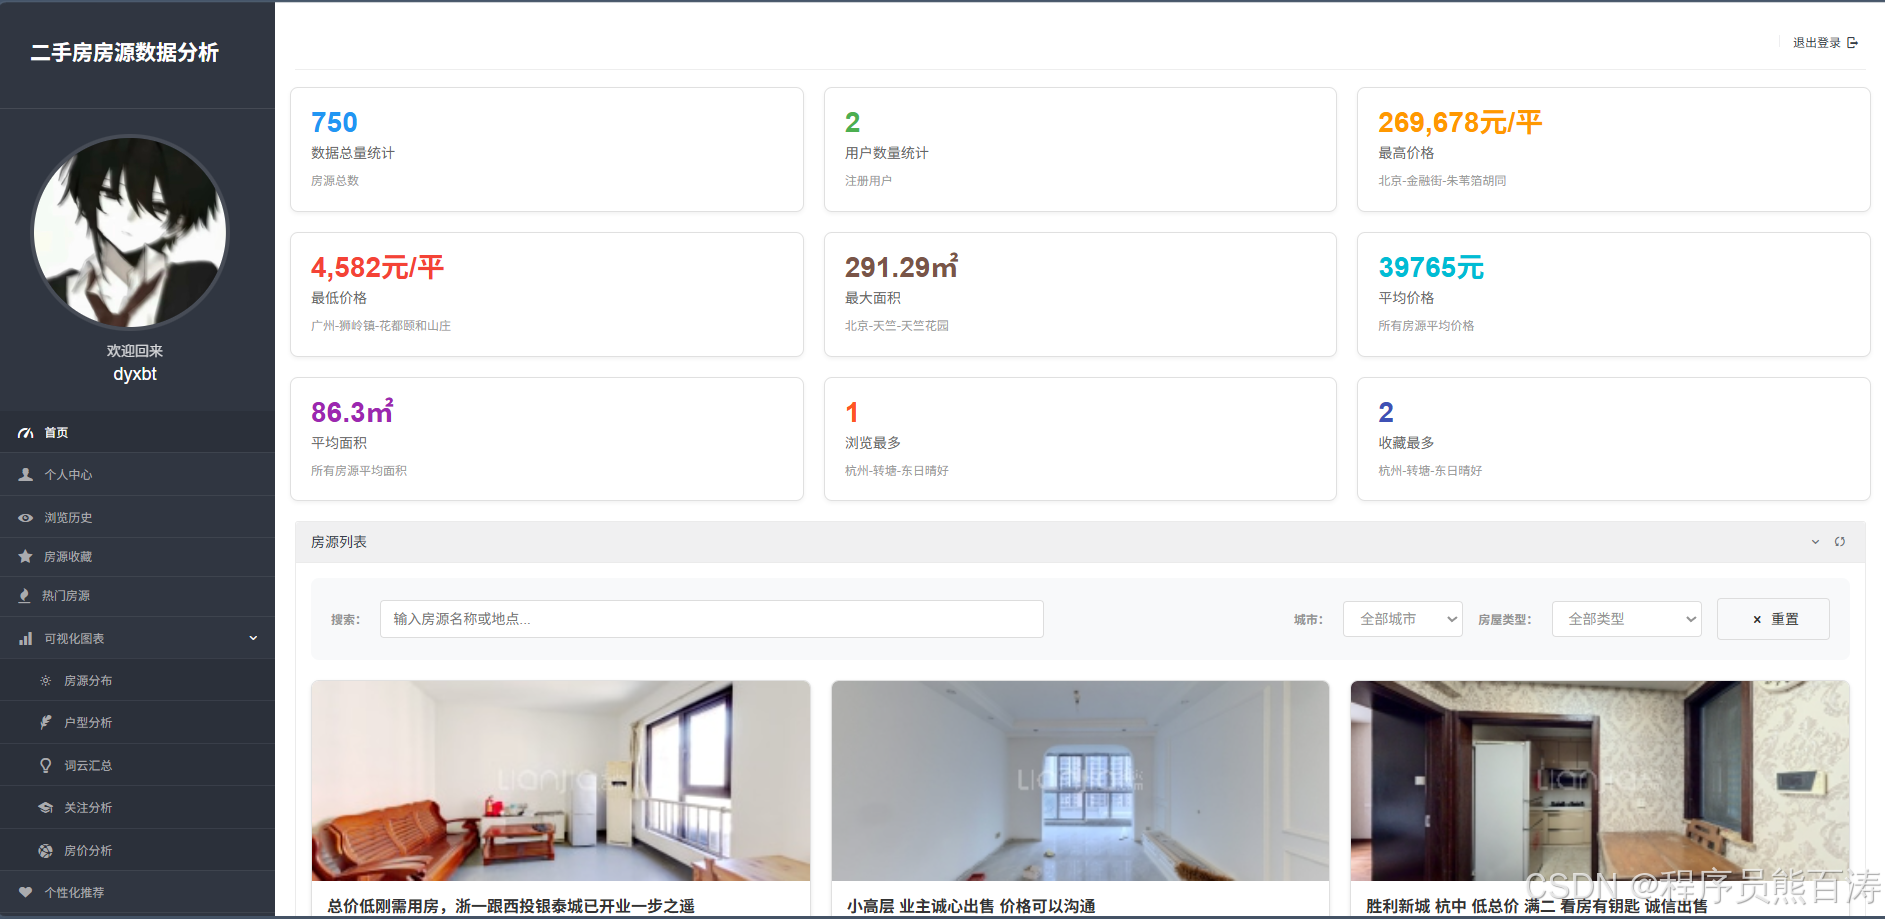
3. 个人中心
个人中心模块允许用户查看和修改个人信息,包括头像、联系方式和密码等,提供个性化的用户体验。
核心代码:
python
def selfInfo(request):
    username = request.session['username'].get('username')
    useravatar = request.session['username'].get('avatar')

    if request.method == 'POST':
        phone = request.POST.get("phone")
        email = request.POST.get("email")
        password = request.POST.get("password")
        avatar = request.FILES.get("avatar")

        selfmes = User.objects.get(username=username)
        selfmes.phone = phone
        selfmes.email = email
        selfmes.password = password
        if avatar:
            selfmes.avatar = avatar
            request.session['username'] = {'username': username, 'avatar': str(avatar)}
        selfmes.save()
        userInfo = User.objects.get(username=username)
        context = {'username': username, 'useravatar': useravatar, 'userInfo': userInfo}
        return render(request, 'selfInfo.html', context)

    userInfo = User.objects.get(username=username)
    context = {'username': username, 'useravatar': useravatar, 'userInfo': userInfo}
    return render(request, 'selfInfo.html', context)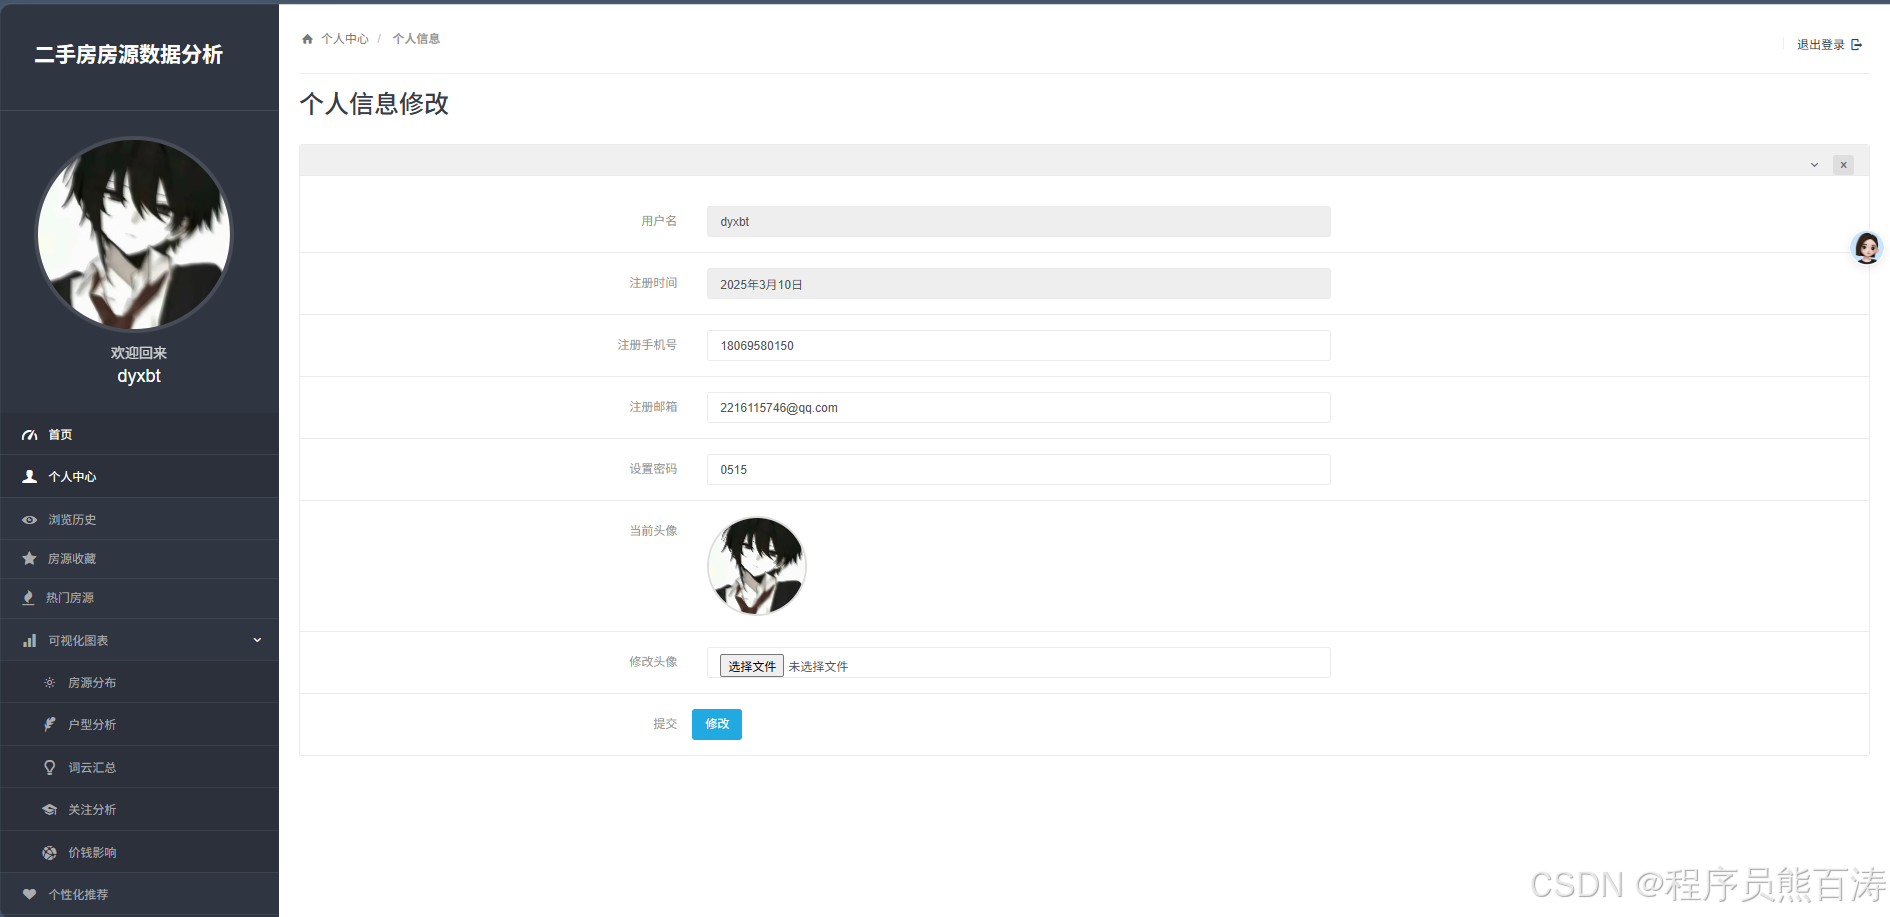
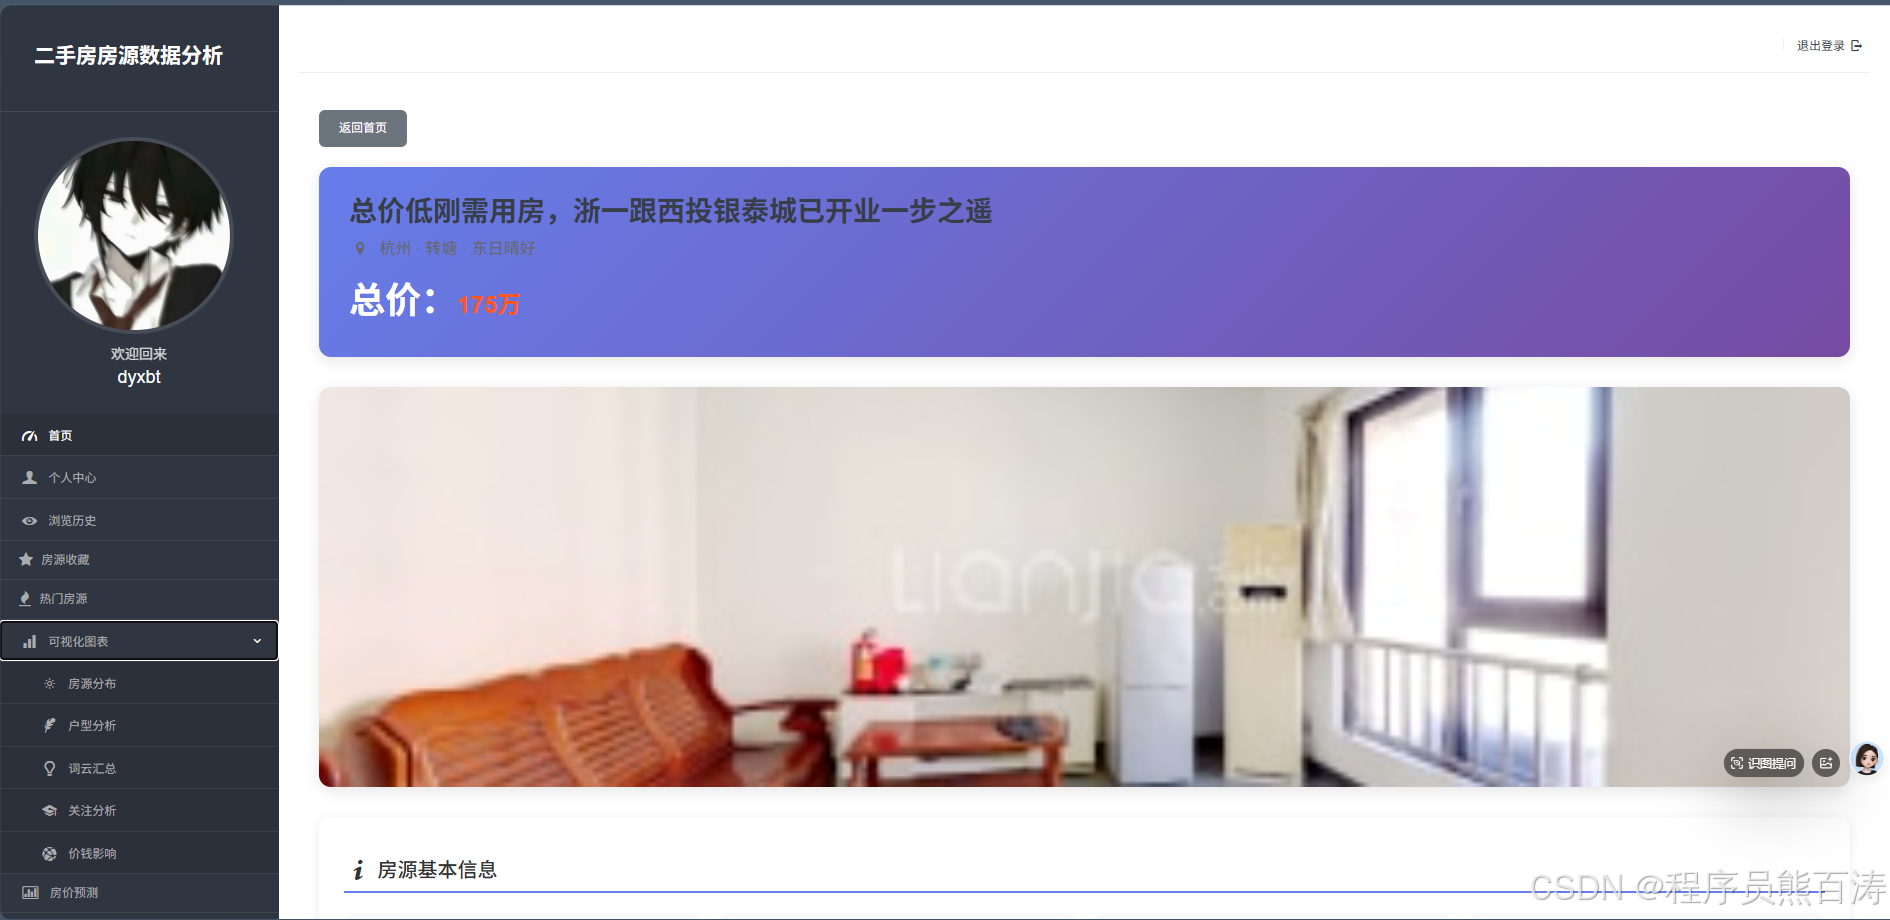
4. 浏览历史
浏览历史模块记录用户查看过的房源信息,方便用户回顾和管理浏览记录,提升用户体验。
核心代码:
python
def browseHistory(request):
    # 检查用户是否登录
    if 'username' not in request.session:
        return redirect('login')

    username = request.session['username'].get('username')
    useravatar = request.session['username'].get('avatar')

    try:
        user = User.objects.get(username=username)
        userInfo = user

        # 获取浏览历史记录,按浏览时间倒序排列
        browse_history = BrowseHistory.objects.filter(user=user).order_by('-browse_time')

        return render(request, 'browseHistory.html', {
            'username': username,
            'useravatar': useravatar,
            'userInfo': userInfo,
            'browse_history': browse_history
        })
    except User.DoesNotExist:
        return redirect('login')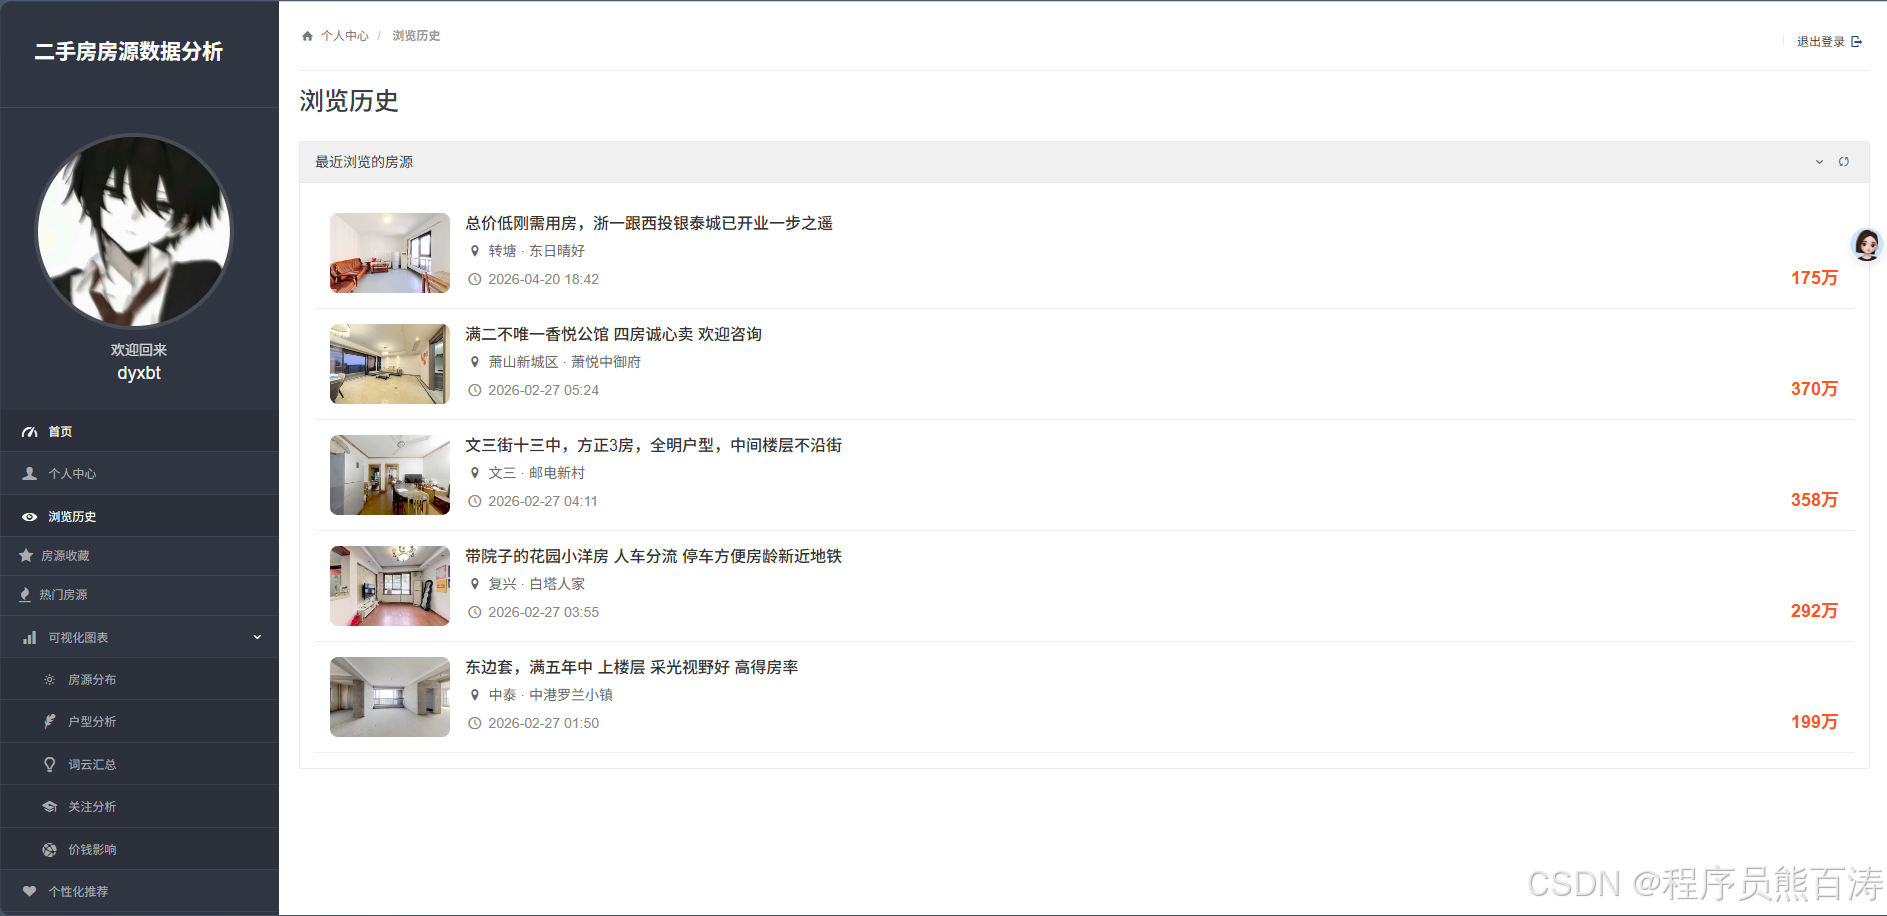
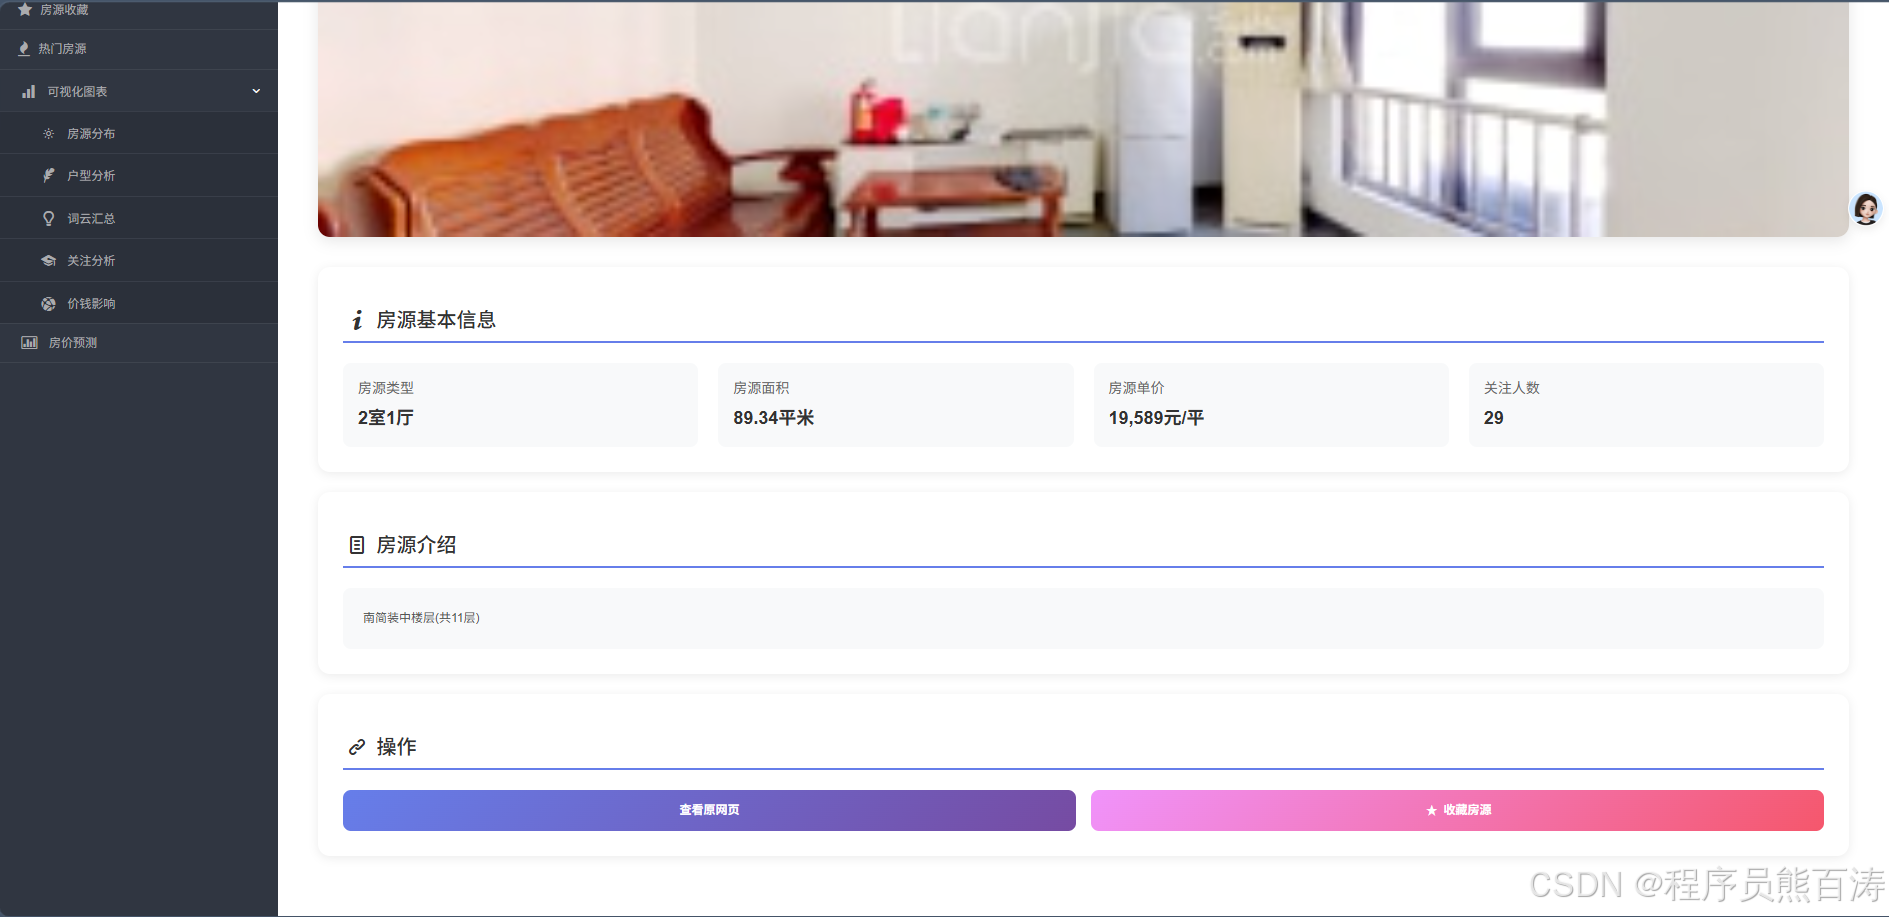
5. 我的收藏
收藏模块允许用户收藏感兴趣的房源,方便后续查看和比较,提高用户体验。
核心代码:
python
def historyTableData(request):
    username = request.session['username'].get('username')
    userInfo = User.objects.get(username=username)
    historyData = getHistoryTableData.getHistoryData(userInfo)
    return render(request, 'collectTableData.html', {
        'username': username,
        'userInfo': userInfo,
        'historyData': historyData
    })

def addHistory(request, houseID):
    username = request.session.get("username").get('username')
    userInfo = User.objects.get(username=username)
    getHistoryTableData.addHistory(userInfo, houseID)
    return redirect('historyTableData')

def deleteHistory(request, history_id):
    try:
        history = Histroy.objects.get(id=history_id)
        history.delete()
    except Histroy.DoesNotExist:
        pass
    return redirect('historyTableData')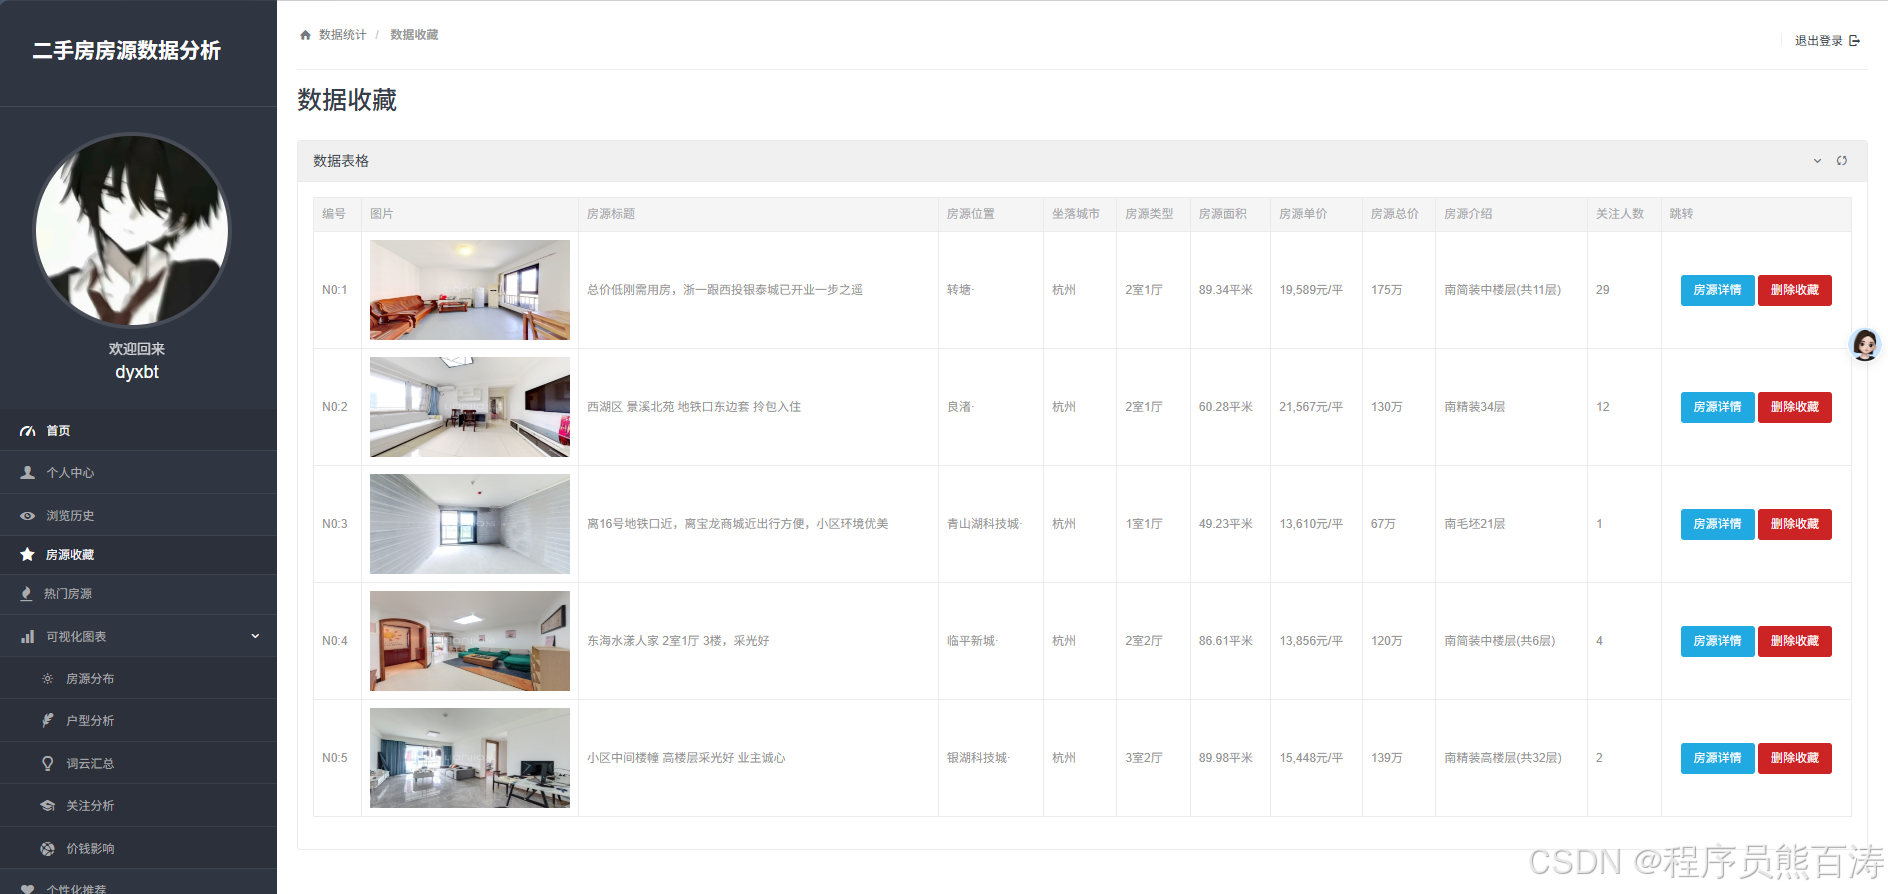
6. 热门房源
7. 数据可视化模块详细介绍
我将分别详细介绍系统中的5个数据可视化页面,每个页面都有其独特的功能和实现方式。
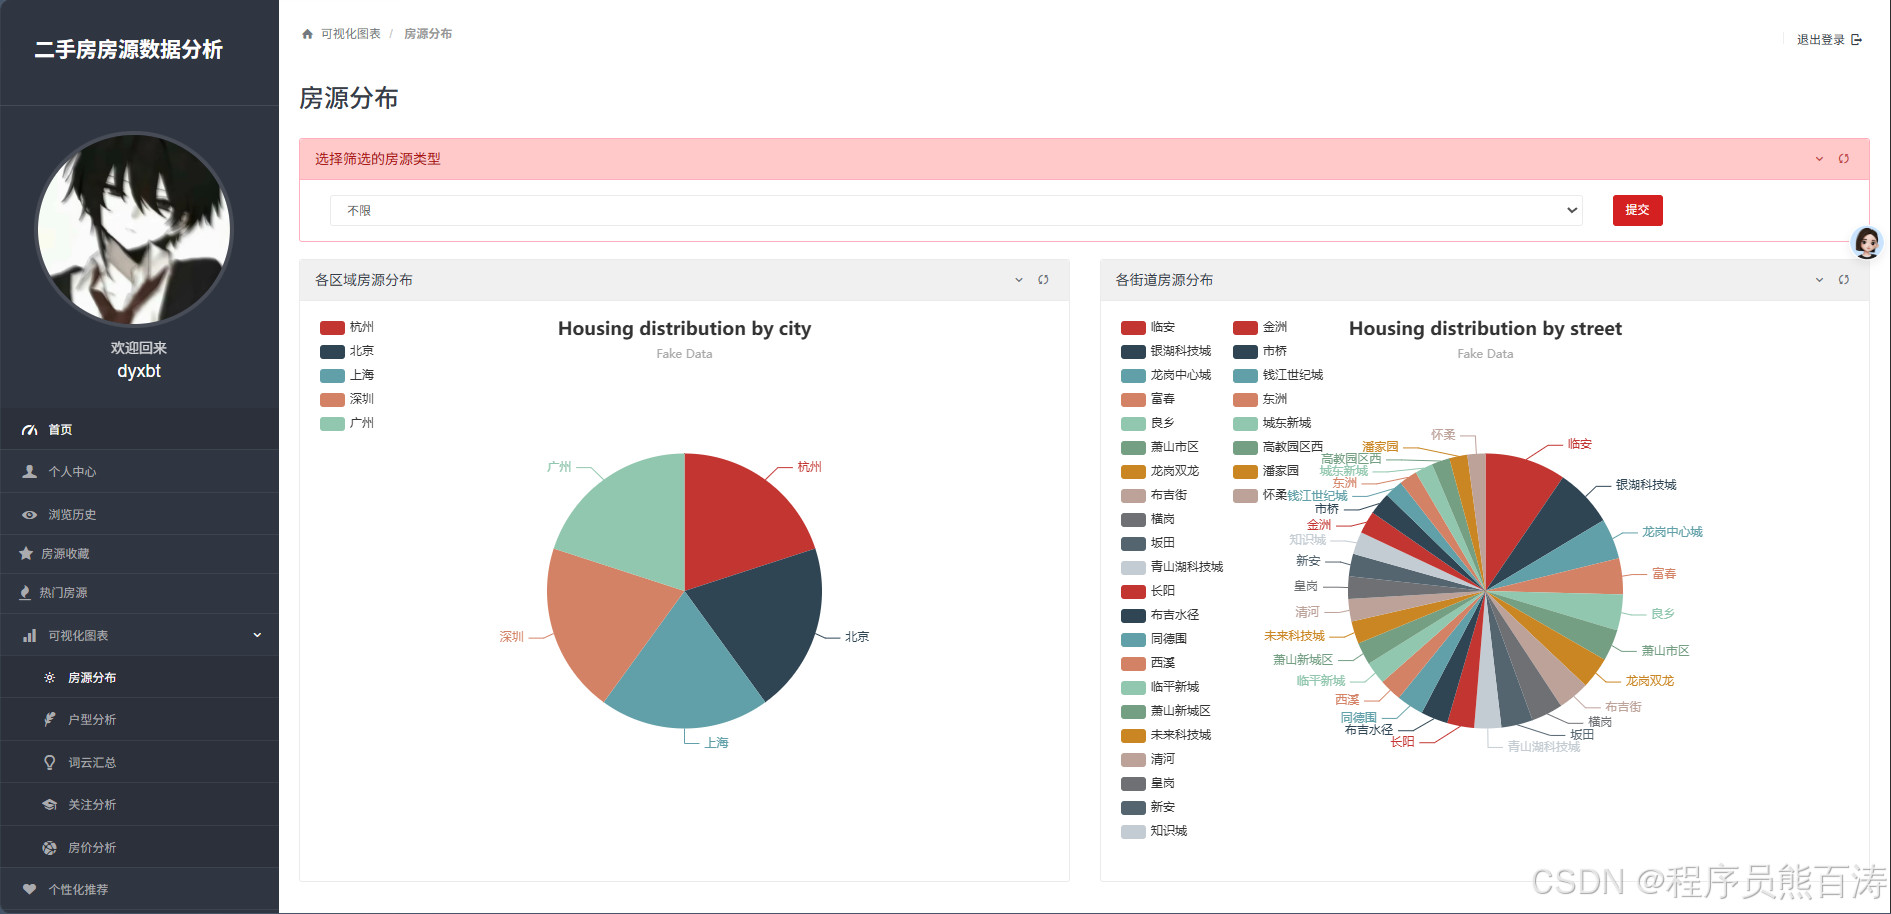
1. 房源分布页面
功能描述:该页面展示了不同城市和区域的房源分布情况,帮助用户了解房源的地域分布特征。
核心功能:
- 按城市统计房源数量
- 按区域统计房源数量(前30个区域)
- 支持按房屋类型筛选数据
核心代码:
python
def houseDistribute(request):
    username = request.session['username'].get('username')
    useravatar = request.session['username'].get('avatar')
    types = list(House.objects.values_list('house_type', flat=True).distinct())
    type_name = request.GET.get('type_name')

    if type_name != '不限' and type_name != None:
        house = House.objects.all().filter(house_type=type_name).distinct().distinct()
    else:
        house = House.objects.all()
    dict1 = {}; result1 = []; dict2 = {}; result2 = []
    for i in house:
        if dict1.get(i.city, -1) == -1:
            dict1[i.city] = 1
        else:
            dict1[i.city] += 1
    for k, v in dict1.items():
        result1.append({
            'value': v,
            "name": k
        })
    for i in house:
        if dict2.get(i.location, -1) == -1:
            dict2[i.location] = 1
        else:
            dict2[i.location] += 1
    for k, v in dict2.items():
        result2.append({
            'value': v,
            "name": k
        })
    result2 = sorted(result2, key=lambda x: x['value'], reverse=True)[:30]
    context = {'result1': result1, 'result2': result2, 'username': username, 'useravatar': useravatar, 'types': types}
return render(request, 'houseDistribute.html', context)实现逻辑:
- 获取用户信息和房屋类型列表
- 根据用户选择的房屋类型筛选房源数据
- 统计每个城市的房源数量
- 统计每个区域的房源数量,并按数量排序取前30个
- 将统计数据传递给前端模板进行可视化展示
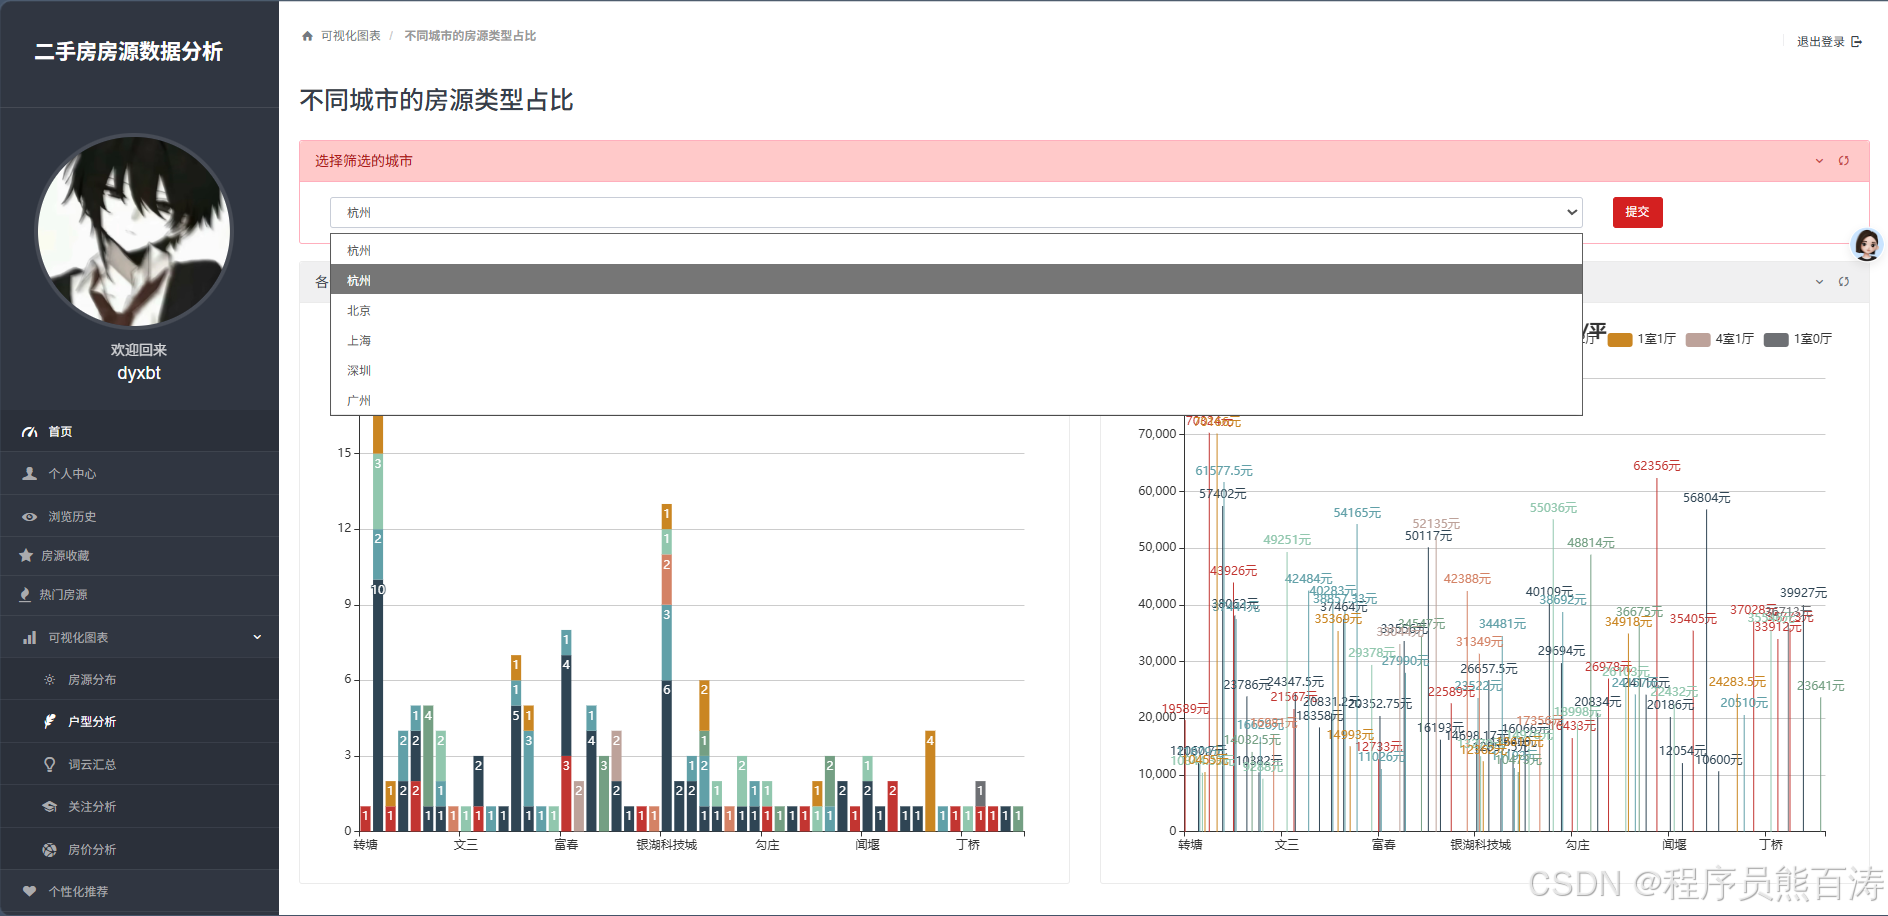
2. 户型分析页面
功能描述:该页面展示了不同城市和区域的户型分布情况,以及不同户型的平均价格,帮助用户了解户型与价格的关系。
核心功能:
- 支持按城市筛选数据
- 展示不同区域和户型的房源数量
- 展示不同区域和户型的平均价格
核心代码:
python
def apartmentlayout(request):
    username = request.session['username'].get('username')
    useravatar = request.session['username'].get('avatar')

    all_cities = list(House.objects.values_list('city', flat=True).distinct())
    default_name = '杭州'
    city_name = request.GET.get('city_name')

    if city_name != None:
        default_name = city_name
    else:
        city_name = default_name

    houses = House.objects.filter(city=city_name).distinct()
    locations = list(House.objects.filter(city=city_name).values_list('location', flat=True).distinct())
    house_types = list(House.objects.filter(city=city_name).values_list('house_type', flat=True).distinct())

    count_data = {}
    price_data = {}

    for location in locations:
        count_data[location] = {}
        price_data[location] = {}
        for house_type in house_types:
            count = House.objects.filter(city=city_name, location=location, house_type=house_type).count()
            count_data[location][house_type] = count

            houses_for_avg = House.objects.filter(city=city_name, location=location, house_type=house_type)
            total_price = 0
            for house in houses_for_avg:
                price_str = house.unit_price.replace('元/平', '').replace(',', '')
                try:
                    total_price += float(price_str)
                except:
                    pass
            avg_price = round(total_price / count, 2) if count > 0 else 0
            price_data[location][house_type] = avg_price

    count_result = []
    for location in locations:
        for house_type in house_types:
            count_result.append({
                'location': location,
                'house_type': house_type,
                'count': count_data[location][house_type]
            })

    price_result = []
    for location in locations:
        for house_type in house_types:
            if price_data[location][house_type] > 0:
                price_result.append({
                    'location': location,
                    'house_type': house_type,
                    'price': price_data[location][house_type]
                })

    context = {
        'username': username,
        'useravatar': useravatar,
        'all_cities': all_cities,
        'default_name': default_name,
        'locations': locations,
        'house_types': house_types,
        'count_result': count_result,
        'price_result': price_result
    }
return render(request, 'Apartmentlayout.html', context)实现逻辑:
- 获取用户信息和所有城市列表
- 根据用户选择的城市筛选房源数据
- 获取该城市的所有区域和房屋类型
- 统计每个区域和户型的房源数量
- 计算每个区域和户型的平均价格
- 将统计数据传递给前端模板进行可视化展示
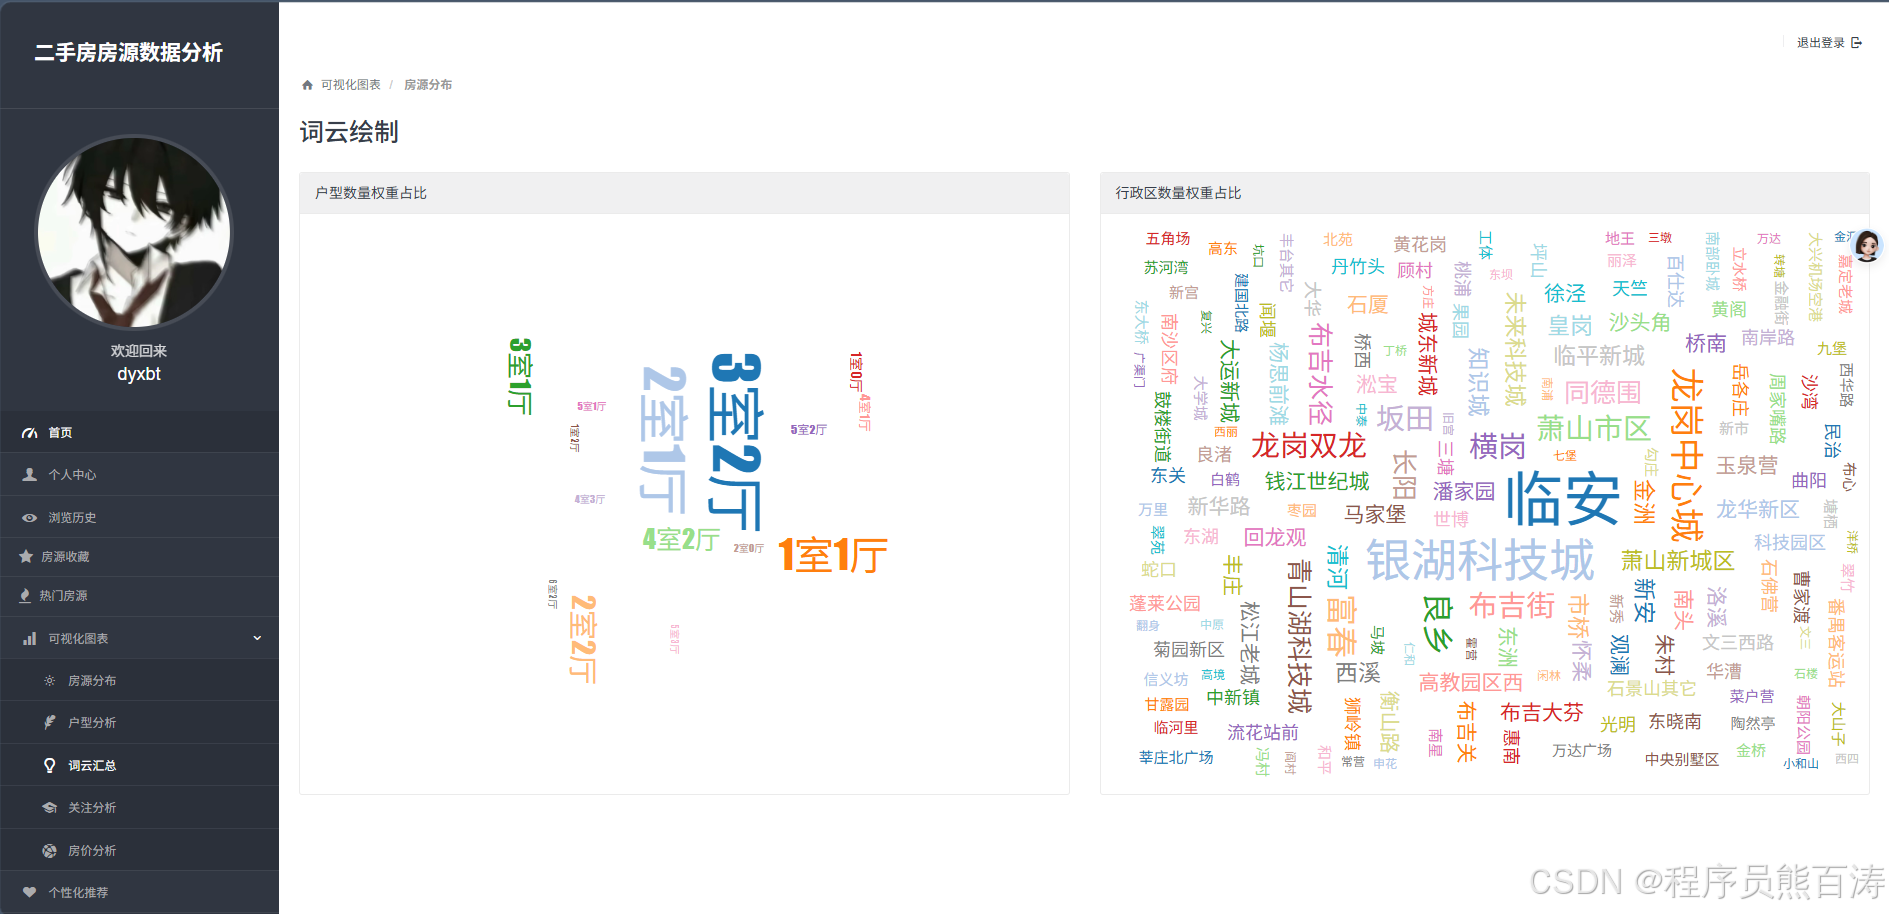
3. 词云分析页面
功能描述:该页面通过词云的形式展示房屋类型和区域的分布情况,直观呈现市场上常见的房屋类型和热门区域。
核心功能:
- 展示房屋类型的分布情况
- 展示区域的分布情况
- 使用词云形式可视化数据
核心代码:
python
def housewordcloud(request):
    username = request.session['username'].get('username')
    useravatar = request.session['username'].get('avatar')

    house_types = House.objects.values_list('house_type', flat=True).distinct()
    locations = House.objects.values_list('location', flat=True).distinct()

    house_type_data = []
    for house_type in house_types:
        count = House.objects.filter(house_type=house_type).count()
        house_type_data.append({
            'name': house_type,
            'value': count
        })

    location_data = []
    for location in locations:
        count = House.objects.filter(location=location).count()
        location_data.append({
            'name': location,
            'value': count
        })

    context = {
        'username': username,
        'useravatar': useravatar,
        'house_type_data': house_type_data,
        'location_data': location_data
    }
return render(request, 'housewordcloud.html', context)实现逻辑:
- 获取用户信息
- 获取所有房屋类型和区域
- 统计每种房屋类型的房源数量
- 统计每个区域的房源数量
- 将统计数据传递给前端模板,使用词云形式展示
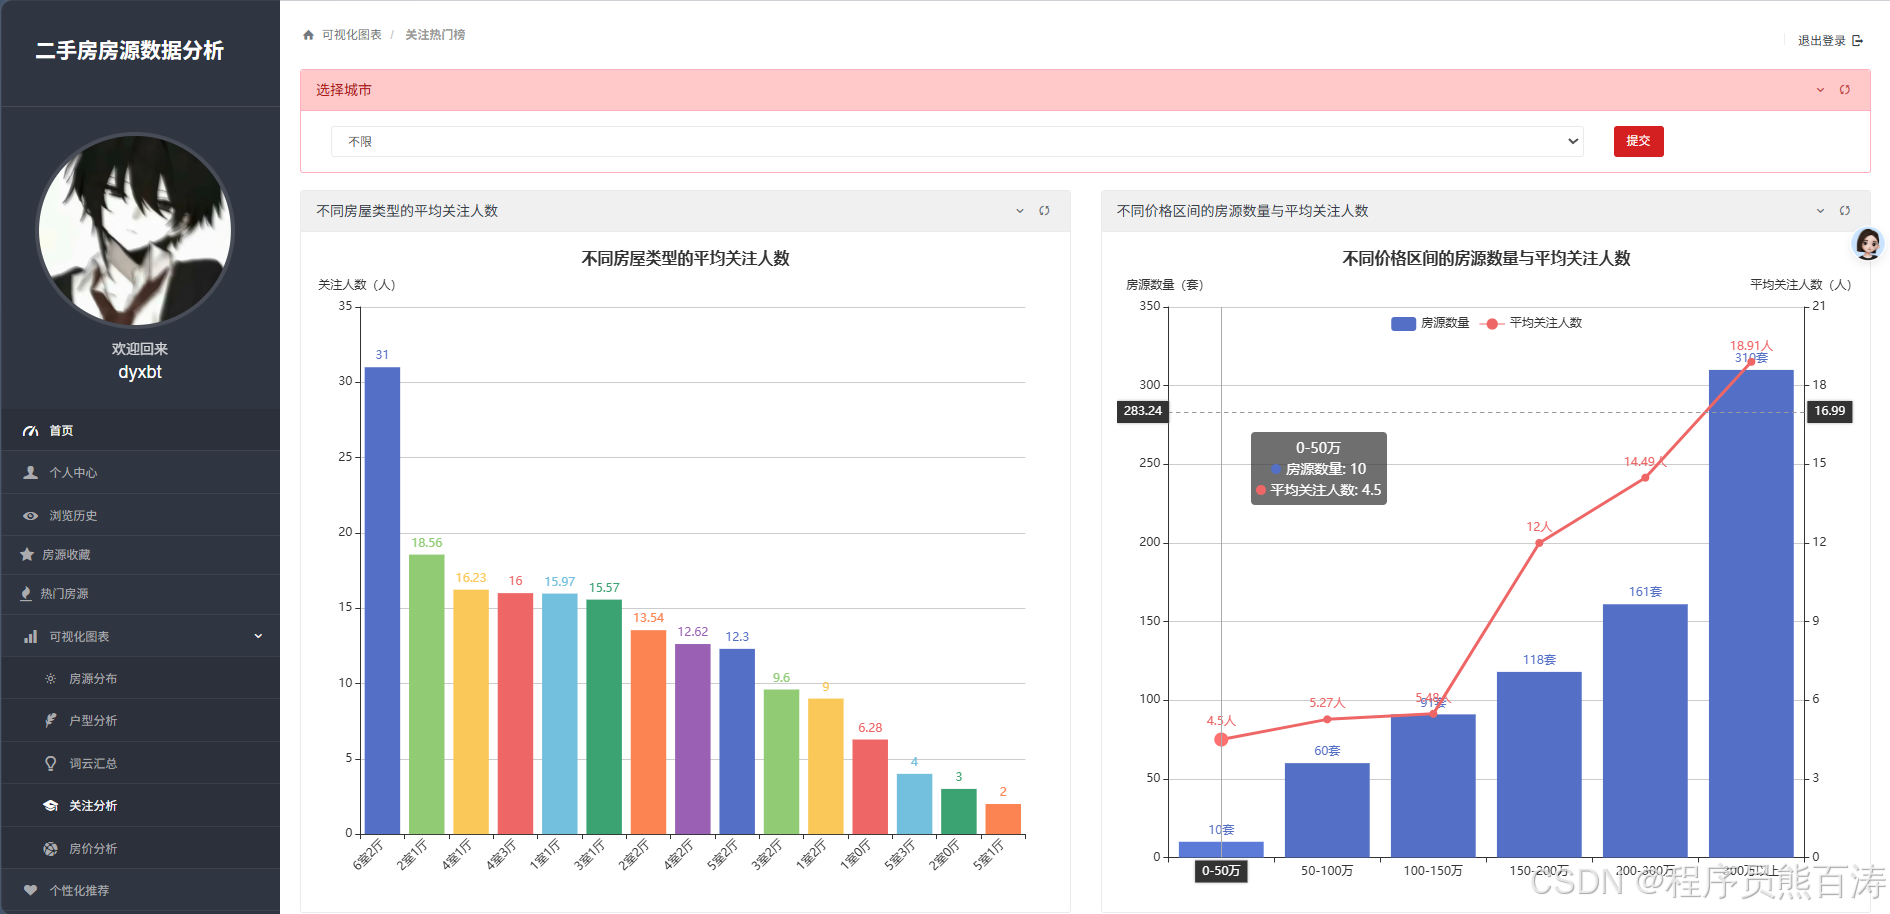
4. 关注分析页面
功能描述:该页面分析了不同房屋类型和价格区间的关注度情况,帮助用户了解市场热点。
核心功能:
- 支持按城市筛选数据
- 展示不同房屋类型的平均关注度
- 展示不同价格区间的房源数量和平均关注度
核心代码:
python
def followAnalysis(request):
    if 'username' not in request.session:
        return redirect('login')

    username = request.session['username'].get('username')
    useravatar = request.session['username'].get('avatar')

    city_name = request.GET.get('city_name', '不限')

    if city_name == '不限':
        houses = House.objects.all()
    else:
        houses = House.objects.filter(city=city_name)

    list_city = list(House.objects.values_list('city', flat=True).distinct())
    list_city.sort()

    house_types = list(House.objects.values_list('house_type', flat=True).distinct())

    house_type_attention = []
    for house_type in house_types:
        type_houses = houses.filter(house_type=house_type)
        if type_houses.exists():
            avg_attention = type_houses.aggregate(avg=Avg('attention'))['avg']
            house_type_attention.append({
                'name': house_type,
                'value': round(avg_attention, 2) if avg_attention else 0
            })

    house_type_attention.sort(key=lambda x: x['value'], reverse=True)

    price_ranges = [
        {'name': '0-50万', 'min': 0, 'max': 50},
        {'name': '50-100万', 'min': 50, 'max': 100},
        {'name': '100-150万', 'min': 100, 'max': 150},
        {'name': '150-200万', 'min': 150, 'max': 200},
        {'name': '200-300万', 'min': 200, 'max': 300},
        {'name': '300万以上', 'min': 300, 'max': float('inf')}
    ]

    price_range_data = []
    price_range_attention = []

    for price_range in price_ranges:
        if price_range['max'] == float('inf'):
            range_houses = houses.filter(total_price__gte=price_range['min'])
        else:
            range_houses = houses.filter(total_price__gte=price_range['min'], total_price__lt=price_range['max'])

        count = range_houses.count()
        avg_attention = range_houses.aggregate(avg=Avg('attention'))['avg']

        price_range_data.append({
            'name': price_range['name'],
            'value': count
        })

        price_range_attention.append({
            'name': price_range['name'],
            'value': round(avg_attention, 2) if avg_attention else 0
        })

    context = {
        'username': username,
        'useravatar': useravatar,
        'list_city': list_city,
        'defaultType': city_name,
        'house_type_attention': house_type_attention,
        'price_range_data': price_range_data,
        'price_range_attention': price_range_attention
    }
return render(request, 'followAnalysis.html', context)实现逻辑:
- 检查用户登录状态
- 获取用户信息和城市列表
- 根据用户选择的城市筛选房源数据
- 统计每种房屋类型的平均关注度
- 按照价格区间统计房源数量和平均关注度
- 将统计数据传递给前端模板进行可视化展示
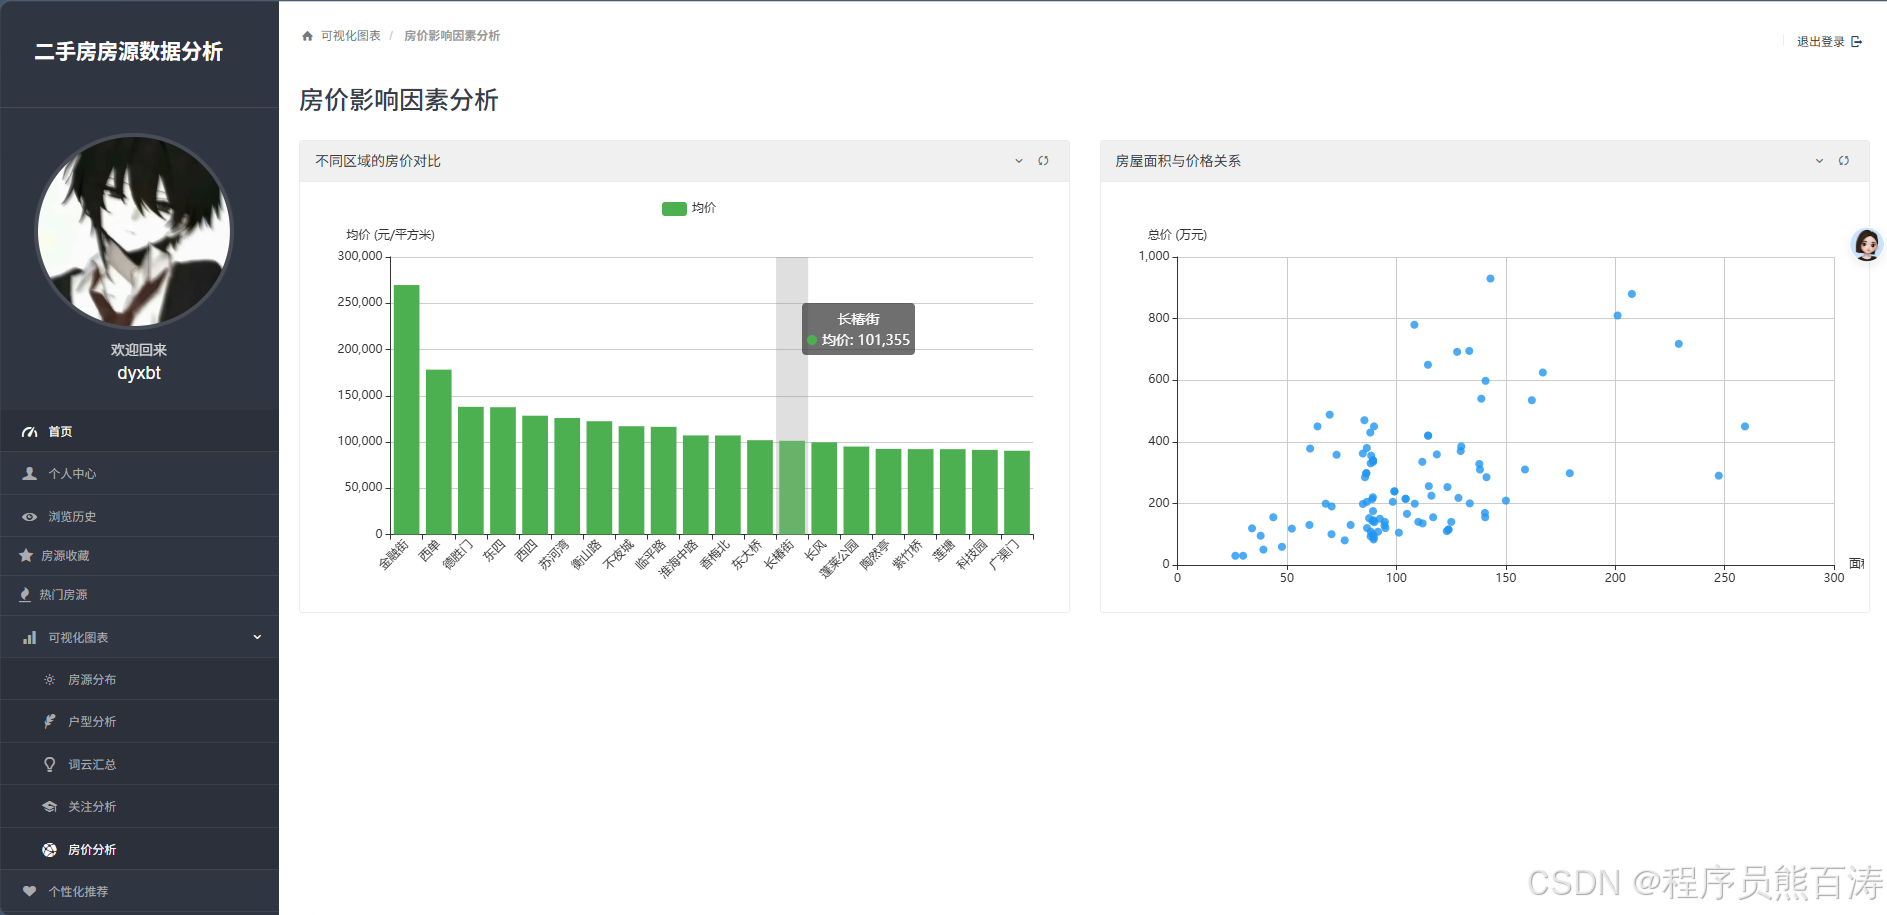
5. 价格分析页面
功能描述:该页面分析了不同区域的房价对比和房屋面积与价格的关系,帮助用户了解房价的地域差异和面积对价格的影响。
核心功能:
- 展示不同区域的平均房价对比(前20个区域)
- 展示房屋面积与总价的关系散点图
核心代码:
python
def priceAnalysis(request):
    # 检查用户是否登录
    if 'username' not in request.session:
        return redirect('login')

    username = request.session['username'].get('username')
    useravatar = request.session['username'].get('avatar')

    # 不同区域的房价对比
    area_price_data = []
    locations = House.objects.values_list('location', flat=True).distinct()
    for location in locations:
        houses = House.objects.filter(location=location)
        total_price = 0
        valid_count = 0
        for house in houses:
            # 提取单价数字
            try:
                # 使用正则表达式提取数字
                price_match = re.search(r'\d+(?:,\d+)*', house.unit_price)
                if price_match:
                    price_str = price_match.group().replace(',', '')
                    price = float(price_str)
                    total_price += price
                    valid_count += 1
            except:
                pass
        if valid_count > 0:
            avg_price = total_price / valid_count
            area_price_data.append({'location': location, 'avg_price': avg_price})

    # 按平均价格排序,取前20个
    area_price_data.sort(key=lambda x: x['avg_price'], reverse=True)
    area_price_data = area_price_data[:20]

    areas = [item['location'] for item in area_price_data]
    area_prices = [round(item['avg_price'], 2) for item in area_price_data]

    # 房屋面积与价格关系
    size_price_data = []
    houses = House.objects.all()[:100]  # 限制数据量以提高性能
    for house in houses:
        try:
            # 提取面积数字
            size_match = re.search(r'\d+(?:\.\d+)?', house.area)
            if size_match:
                size_str = size_match.group()
                size = float(size_str)

                # 提取总价数字
                total_match = re.search(r'\d+(?:\.\d+)?', str(house.total_price))
                if total_match:
                    total_str = total_match.group()
                    total = float(total_str)

                    if size > 0 and total > 0:
                        size_price_data.append([size, total])
        except:
            pass

    return render(request, 'priceAnalysis.html', {
        'username': username,
        'useravatar': useravatar,
        'areas': areas,
        'area_prices': area_prices,
        'size_price_data': size_price_data
    })
实现逻辑:
- 检查用户登录状态
- 获取用户信息
- 统计每个区域的平均房价
- 按平均房价排序,取前20个区域
- 提取房屋面积和总价数据,生成散点图数据
- 将统计数据传递给前端模板进行可视化展示
数据可视化模块总结
系统的5个数据可视化页面从不同角度展示了二手房市场数据,包括:
- 房源的地域分布情况
- 不同户型的分布和价格
- 房屋类型和区域的词云展示
- 不同房屋类型和价格区间的关注度
- 区域房价对比和面积价格关系
这些可视化页面通过直观的图表形式,帮助用户更好地了解二手房市场的整体情况,为购房决策提供参考。每个页面都支持相应的筛选功能,用户可以根据自己的需求查看特定条件下的数据分布。
前端使用ECharts库实现了各种图表的展示,包括柱状图、折线图、词云图和散点图等,确保数据展示的美观性和交互性。
7. 个性化推荐
个性化推荐模块基于用户的浏览历史和收藏记录,为用户推荐可能感兴趣的房源,提升用户体验和购房效率。
核心代码:
python
def personalizedRecommendation(request):
    # 检查用户是否登录
    if 'username' not in request.session:
        return redirect('login')

    username = request.session['username'].get('username')
    useravatar = request.session['username'].get('avatar')

    try:
        user = User.objects.get(username=username)
        userInfo = user

        # 获取个性化推荐房源
        recommended_houses = hybrid_recommend(user.id, top_n=15)

        # 如果没有推荐结果,返回关注度最高的房源
        if not recommended_houses:
            recommended_houses = House.objects.order_by('-attention')[:15]

        return render(request, 'personalizedRecommendation.html', {
            'username': username,
            'useravatar': useravatar,
            'userInfo': userInfo,
            'recommended_houses': recommended_houses
        })
    except User.DoesNotExist:
        return redirect('login')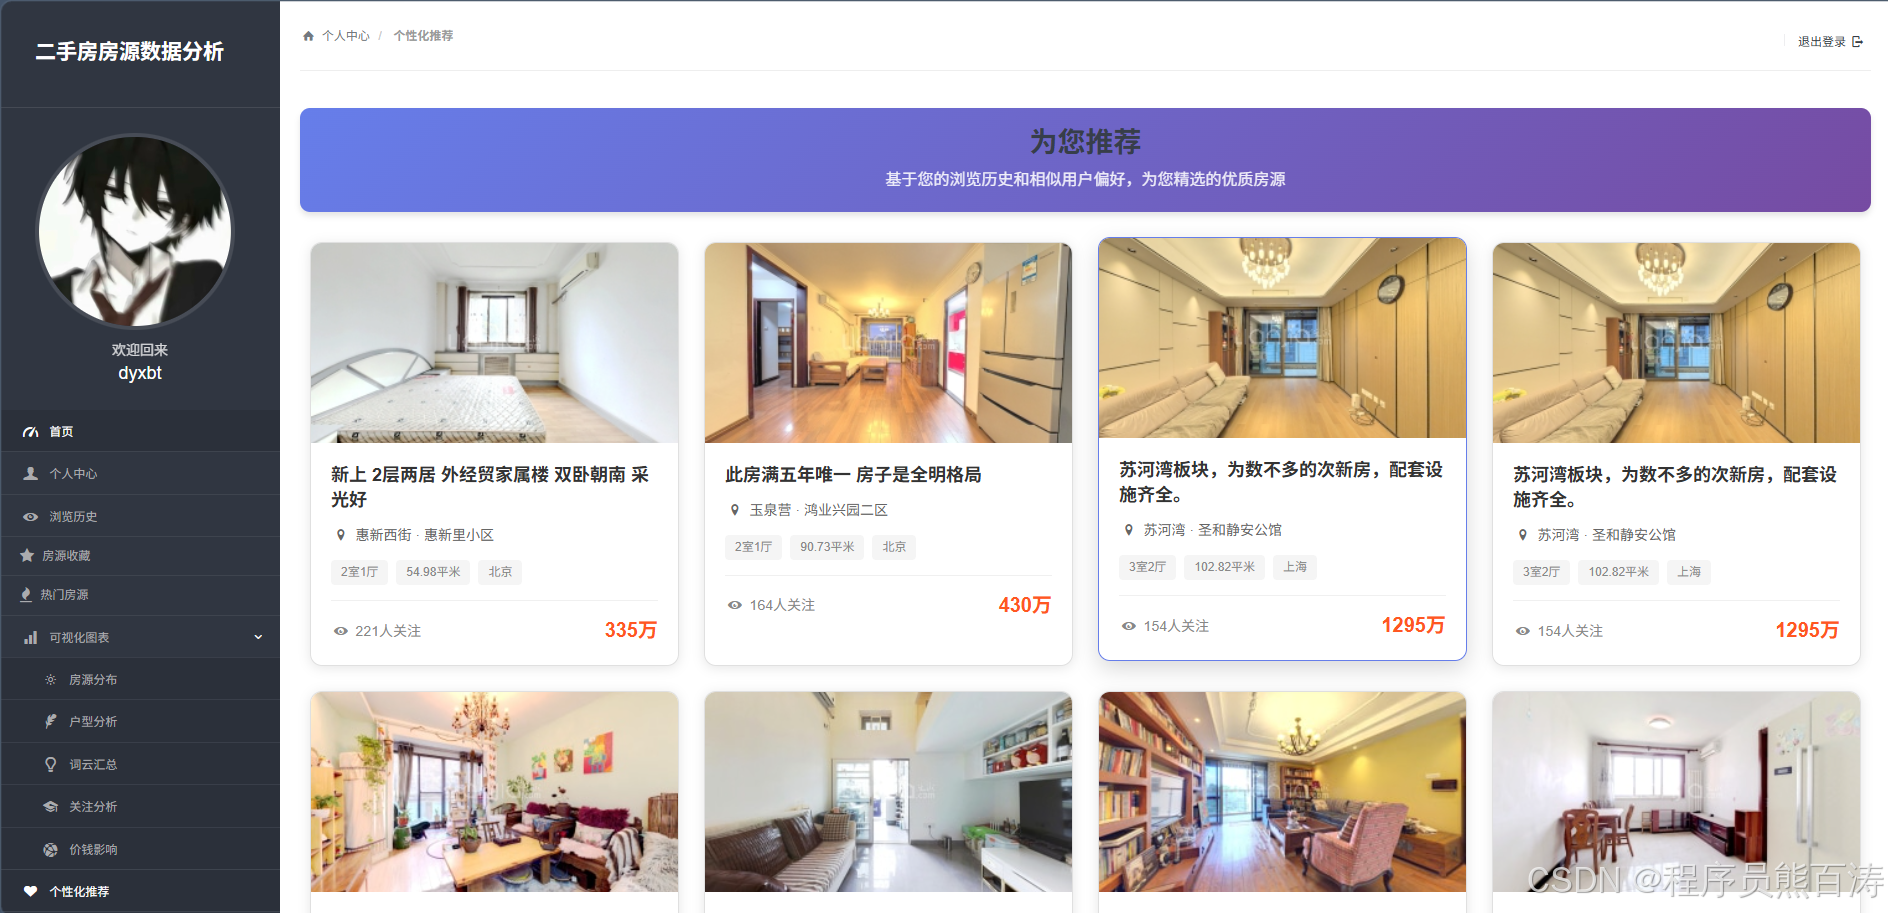
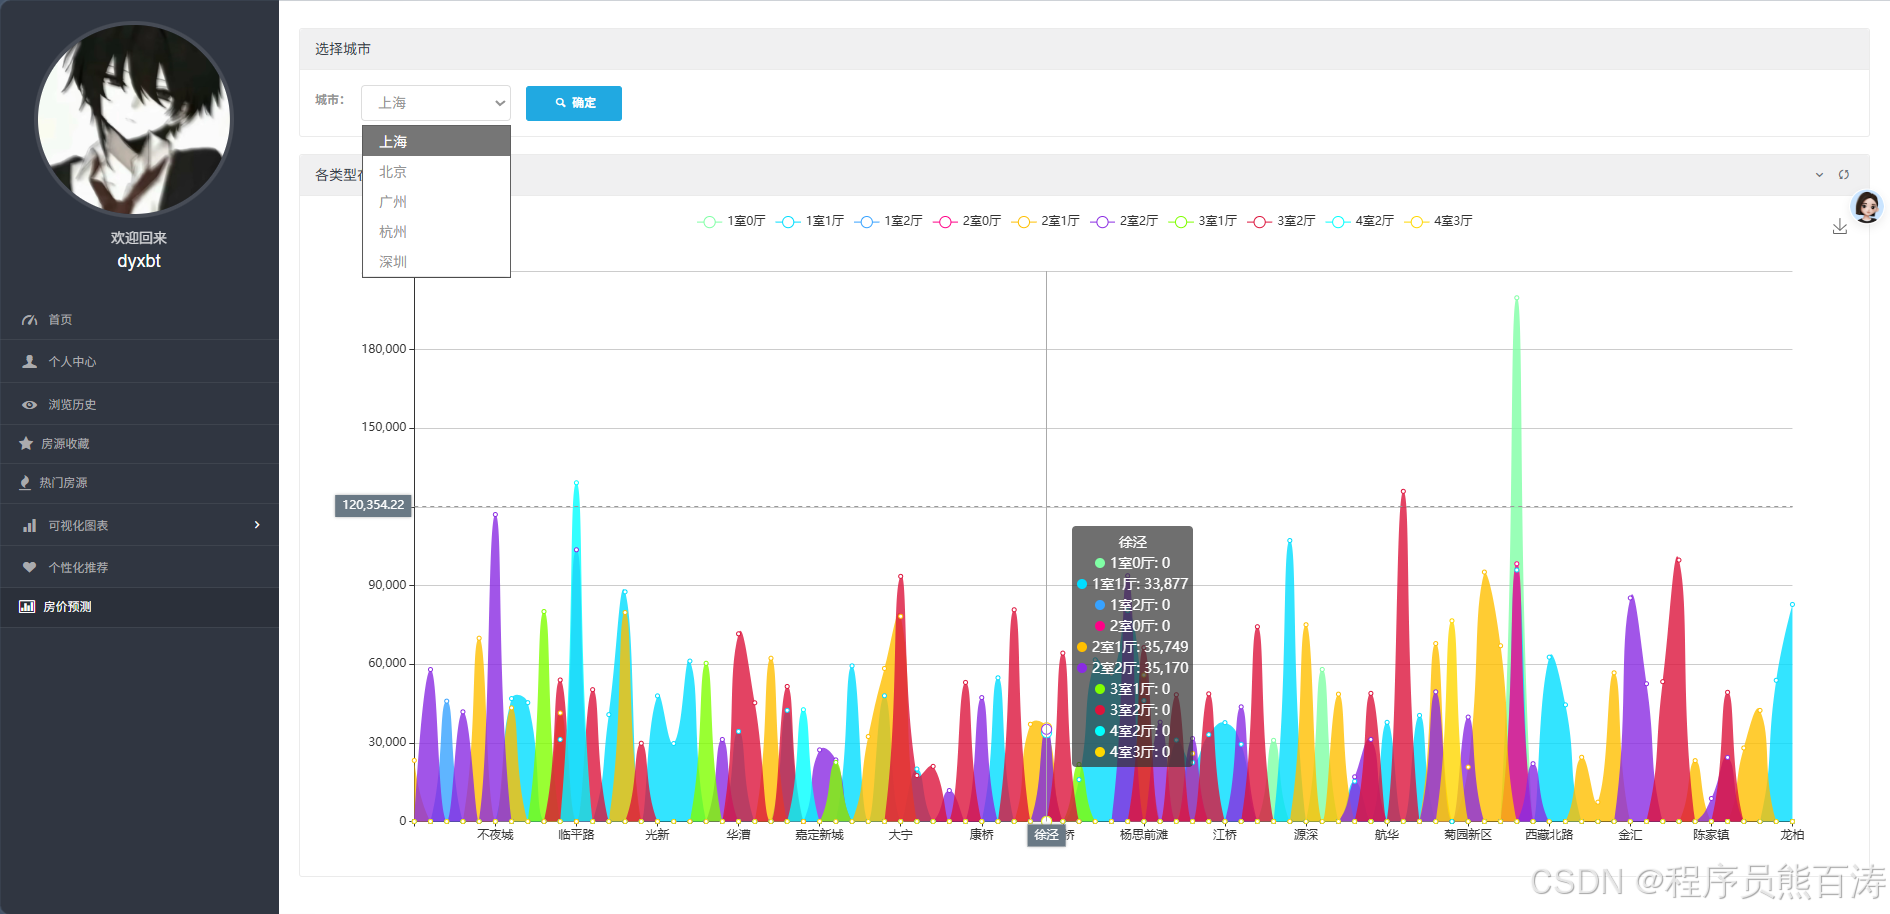
8. 房价预测
房价预测模块基于线性回归模型,根据房源的位置和类型等特征,预测二手房的单价,为用户提供价格参考。
核心代码:
python
def predict_unit_price(request):
    # 检查用户是否登录
    if 'username' not in request.session:
        return redirect('login')

    # 用户缓存数据
    username = request.session['username'].get('username')
    useravatar = request.session['username'].get('avatar')
    all_cities = list(House.objects.values_list('city', flat=True).distinct())
    all_cities.sort()
    default_name = all_cities[0] if all_cities else '不限'
    city_name = request.GET.get('city_name')
    if city_name != None:
        default_name = city_name
    else:
        city_name = default_name

    # 1. 获取房源数据
    queryset = House.objects.filter(city=default_name)

    # 2. 数据清洗和转换
    data = []
    for house in queryset:
        # 清洗单价数据(去除逗号和单位)
        cleaned_price = house.unit_price \
            .replace('元/平', '') \
            .replace('元/平米', '') \
            .replace('元/㎡', '') \
            .replace(',', '') \
            .strip()

        # 尝试转换为数字
        try:
            price = float(cleaned_price)
            if price > 0:
                data.append({
                    'location': house.location,
                    'house_type': house.house_type,
                    'unit_price': price
                })
        except (ValueError, TypeError):
            continue

    # 3. 转换数据结构
    df = pd.DataFrame(data)

    if df.empty:
        return render(request, 'predict_unit_price.html', {
            'username': username,
            'useravatar': useravatar,
            'error': f'城市 "{default_name}" 暂无有效数据,请选择其他城市',
            'all_cities': all_cities,
            'default_name': default_name
        })

    # 4. 保存原始组合信息(在特征编码之前)
    actual_combinations = df[['location', 'house_type']].drop_duplicates()

    # 计算每个组合的平均价格和样本数量
    combo_stats = defaultdict(lambda: {'sum': 0, 'count': 0})
    for _, row in df.iterrows():
        combo_key = (row['location'], row['house_type'])
        combo_stats[combo_key]['sum'] += row['unit_price']
        combo_stats[combo_key]['count'] += 1

    # 5. 特征编码
    df = pd.get_dummies(df, columns=['location', 'house_type'])

    # 6. 训练预测模型
    X = df.drop('unit_price', axis=1)
    y = df['unit_price']

    if X.shape[0] < 2:
        return render(request, 'predict_unit_price.html', {
            'username': username,
            'useravatar': useravatar,
            'error': '数据不足,无法进行预测',
            'all_cities': all_cities,
            'default_name': default_name
        })

    model = LinearRegression()
    model.fit(X, y)

    # 7. 生成预测结果(只预测训练数据中实际存在的组合)
    predictions = []

    for _, row in actual_combinations.iterrows():
        location = row['location']
        house_type = row['house_type']
        combo_key = (location, house_type)

        # 检查该组合的样本数量
        sample_count = combo_stats[combo_key]['count']

        # 如果样本数量少于3,使用平均值;否则使用预测值
        if sample_count < 3:
            predicted_value = round(combo_stats[combo_key]['sum'] / sample_count, 2)
        else:
            # 创建特征向量
            features = {
                f'location_{location}': 1,
                f'house_type_{house_type}': 1
            }

            # 转换为DataFrame
            input_df = pd.DataFrame([features]).fillna(0)

            # 确保列顺序匹配
            input_df = input_df.reindex(columns=X.columns, fill_value=0)

            # 进行预测
            predicted_price = model.predict(input_df)

            # 确保预测价格不为负数
            predicted_value = round(predicted_price[0], 2)
            if predicted_value < 0:
                predicted_value = round(combo_stats[combo_key]['sum'] / sample_count, 2)

        predictions.append({
            'location': location,
            'house_type': house_type,
            'predicted_unit_price': predicted_value
        })

    # 生成可视化数据
    # ...(可视化数据处理代码)

    return render(request, 'predict_unit_price.html', {
        'username': username,
        'useravatar': useravatar,
        'predictions': predictions,
        'house_types': house_types,
        'locations': locations,
        'series': series,
        'color_pool': color_pool,
        'all_cities': all_cities,
        'default_name': default_name
    })
项目特色
-
多维度数据可视化:通过多种图表(柱状图、折线图、词云等)展示二手房市场数据,直观呈现市场趋势。
-
个性化推荐系统:基于用户行为数据,为用户推荐可能感兴趣的房源,提高用户体验。
-
房价预测功能:利用机器学习算法预测房价,为用户提供价格参考。
-
完善的用户管理:支持用户注册、登录、个人信息修改等功能,确保用户数据安全。
-
实时数据更新:系统会实时更新房源数据,确保数据的准确性和时效性。
-
响应式设计:适配不同设备的屏幕尺寸,提供良好的移动端体验。
总结
本项目是一个功能完善的二手房数据可视化分析系统,集成了用户管理、房源浏览、数据可视化、个性化推荐和房价预测等功能。通过直观的界面和强大的数据分析能力,帮助用户更好地了解二手房市场情况,为购房决策提供参考。
系统采用Django框架开发,结合ECharts等前端技术,实现了数据的可视化展示;使用Pandas和Scikit-learn等库,实现了数据处理和房价预测功能。整体设计合理,功能完善,用户体验良好。
未来可以考虑进一步优化推荐算法,增加更多数据源,以及开发移动端应用,提升系统的实用性和便捷性。