用matlab绘制大图时,以4个子图的2*2图片为例,采用subplot虽然可以有效绘图,但是图片的细节很难把握,比如排序、间距等,但是直接一个一个绘制子图,再用ppt合并之后,其细节又会损失(是假的矢量图),因此采用折中方案,先一张一张绘制子图,再用超大图窗合并起来即可
比如有4几个fig文件已经生成完毕了(名称分别为1.fig、2.fig、3.fig、4.fig),但是需要在matlab里合并为一整张图,代码如下:
matlab
function Combine_260508()
%% 原封不动 2×2 合并 fig(全局统一字号版)
%% 合并 4 个 fig 为 2×2 大图
clc
clear
close all
%% ========== 1. 设置文件名与全局字号 ==========
figFiles = {'1.fig', ...
            '2.fig', ...
            '3.fig', ...
            '4.fig'};

labels   = {'(a) x(1)', '(b) x(2)', '(c) x(3)', '(d) x(4)'};

fontSize = 20;        % <-- 全局统一字号,只改这里即可%%%%%%%%%%%%%%%%%%%%%%%%%%%%%%%%%%%%%
fontName = 'Times New Roman';   % 统一字体(不需要可注释掉)

%% ========== 2. 创建新图窗 ==========
figNew = figure('Color','w','Position',[0 0 2400 1000]);

%% ========== 3. 2×2 布局位置(归一化 [left bottom width height])==========
pos = [0.06 0.54 0.42 0.40;   % 左上
       0.52 0.54 0.42 0.40;   % 右上
       0.06 0.07 0.42 0.40;   % 左下
       0.52 0.07 0.42 0.40];  % 右下

%% ========== 4. 逐个处理 ==========
for i = 1:length(pos)
    % 后台打开原始 fig
    hFig = openfig(figFiles{i}, 'invisible');
    drawnow;

    % ---- 4.1 找到主坐标轴(过滤 legend/colorbar 产生的寄生 axes)----
    axAll = findobj(hFig, 'Type', 'axes', '-depth', 1);
    isMain = true(size(axAll));
    for k = 1:numel(axAll)
        tag = lower(axAll(k).Tag);
        isMain(k) = isempty(strfind(tag, 'legend')) && isempty(strfind(tag, 'colorbar'));
    end
    axMain = axAll(isMain);

    if isempty(axMain)
        warning('跳过 %s:未找到主坐标轴', figFiles{i});
        close(hFig); continue;
    end

    % 若有多个 axes(如含 inset),取面积最大的
    if numel(axMain) > 1
        areas = zeros(size(axMain));
        for k = 1:numel(axMain)
            areas(k) = axMain(k).Position(3) * axMain(k).Position(4);
        end
        [~, idx] = max(areas);
        axOrig = axMain(idx);
    else
        axOrig = axMain(1);
    end

    % ---- 4.2 原封不动复制整个坐标轴 ----
    axNew = copyobj(axOrig, figNew);
    axNew.Units = 'normalized';
    axNew.Position = pos(i,:);

    % ---- 4.3 【核心】统一修改该子图内所有文字大小 ----

    % 1) 坐标轴刻度字体
    axNew.FontSize = fontSize;
    axNew.FontName = fontName;

    % 2) X/Y/Z 轴标签
    if ~isempty(axNew.XLabel.String)
        axNew.XLabel.FontSize = fontSize;
        axNew.XLabel.FontName = fontName;
    end
    if ~isempty(axNew.YLabel.String)
        axNew.YLabel.FontSize = fontSize;
        axNew.YLabel.FontName = fontName;
    end
    if ~isempty(axNew.ZLabel.String)
        axNew.ZLabel.FontSize = fontSize;
        axNew.ZLabel.FontName = fontName;
    end

    % 3) 标题
    if ~isempty(axNew.Title.String)
        axNew.Title.FontSize = fontSize;
        axNew.Title.FontName = fontName;
    end

    % 4) 坐标轴内所有 text 对象(如手动添加的注释文字)
    hTexts = findobj(axNew, 'Type', 'text');
    for k = 1:numel(hTexts)
        hTexts(k).FontSize = fontSize;
        hTexts(k).FontName = fontName;
    end

    % ---- 4.4 重建 Legend 并统一字号 ----
    hLeg = findobj(hFig, 'Type', 'legend');
    for k = 1:numel(hLeg)
        try
            if isequal(hLeg(k).Axes, axOrig)
                hL = legend(axNew, hLeg(k).String, ...
                       'Location', hLeg(k).Location, ...
                       'FontSize', fontSize, ...      % <-- 统一字号
                       'FontName', fontName, ...
                       'Box',      hLeg(k).Box, ...
                       'Color',    hLeg(k).Color);
            end
        catch
            hL = legend(axNew, hLeg(k).String, ...
                   'Location', hLeg(k).Location, ...
                   'FontSize', fontSize, ...
                   'FontName', fontName);
        end
    end

    % ---- 4.5 重建 Colorbar(如有)并统一字号 ----
    hCb = findobj(hFig, 'Type', 'colorbar');
    for k = 1:numel(hCb)
        try
            if isequal(hCb(k).Axes, axOrig)
                hC = colorbar(axNew, 'Location', hCb(k).Location);
                hC.FontSize = fontSize;
                hC.FontName = fontName;
            end
        catch
            hC = colorbar(axNew);
            hC.FontSize = fontSize;
            hC.FontName = fontName;
        end
    end

    % ---- 4.6 在子图正下方添加 (a)(b)(c)(d) ----
    xCenter = pos(i,1) + pos(i,3)/2;   % 子图水平中心
    yBottom = pos(i,2) - 0.07;         % 子图底部再往下一点
    annotation(figNew, 'textbox', ...
        [xCenter-0.03, yBottom, 0.06, 0.03], ...
        'String', labels{i}, ...
        'EdgeColor', 'none', ...
        'HorizontalAlignment', 'center', ...
        'VerticalAlignment', 'top', ...
        'FontSize', fontSize, ...       % <-- 统一字号
        'FontName', fontName);%, ...
       % 'FontWeight', 'bold');

    % 关闭原始 fig
    close(hFig);
end
4个fig子图(示例):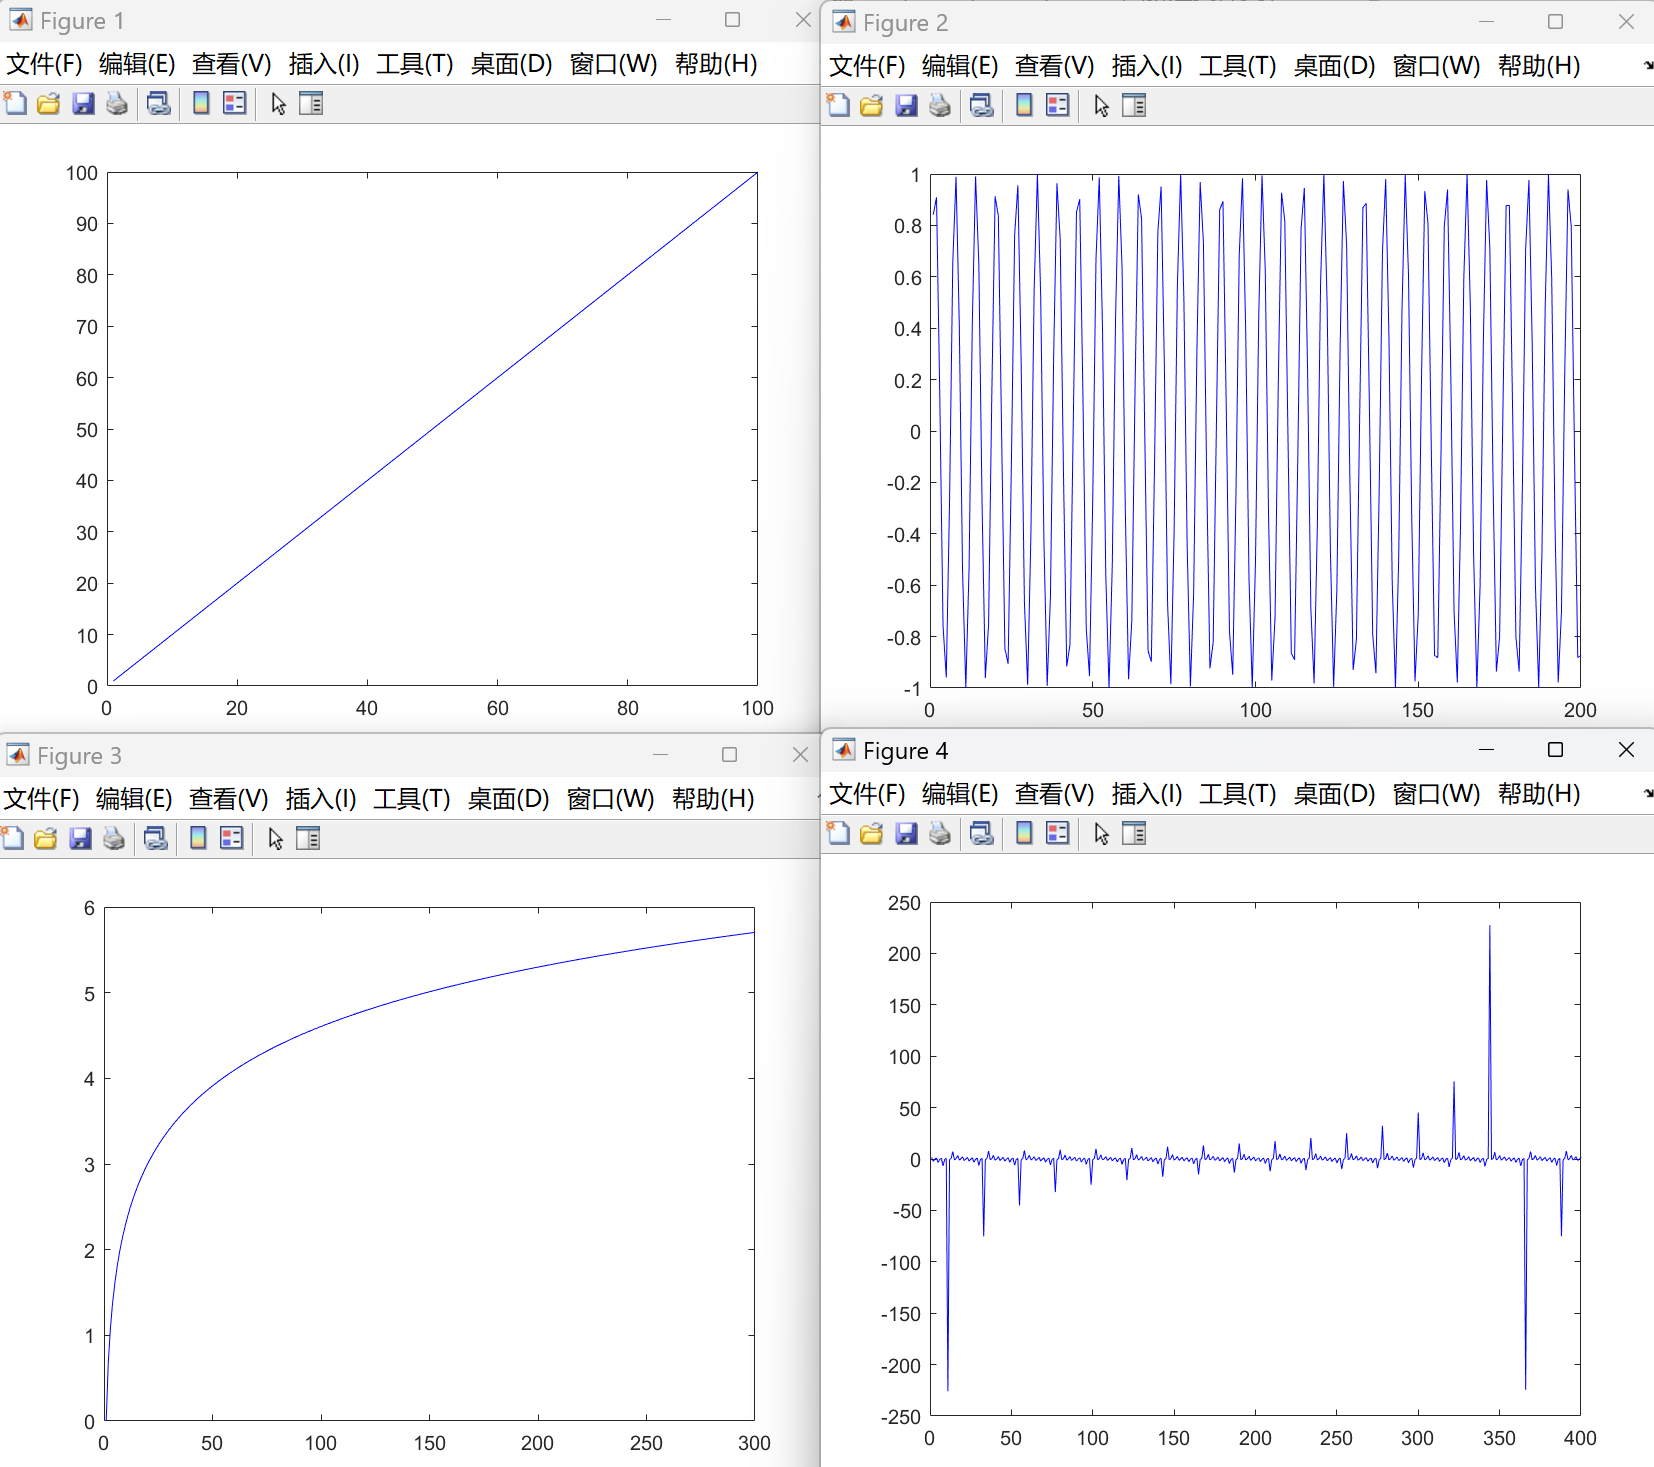
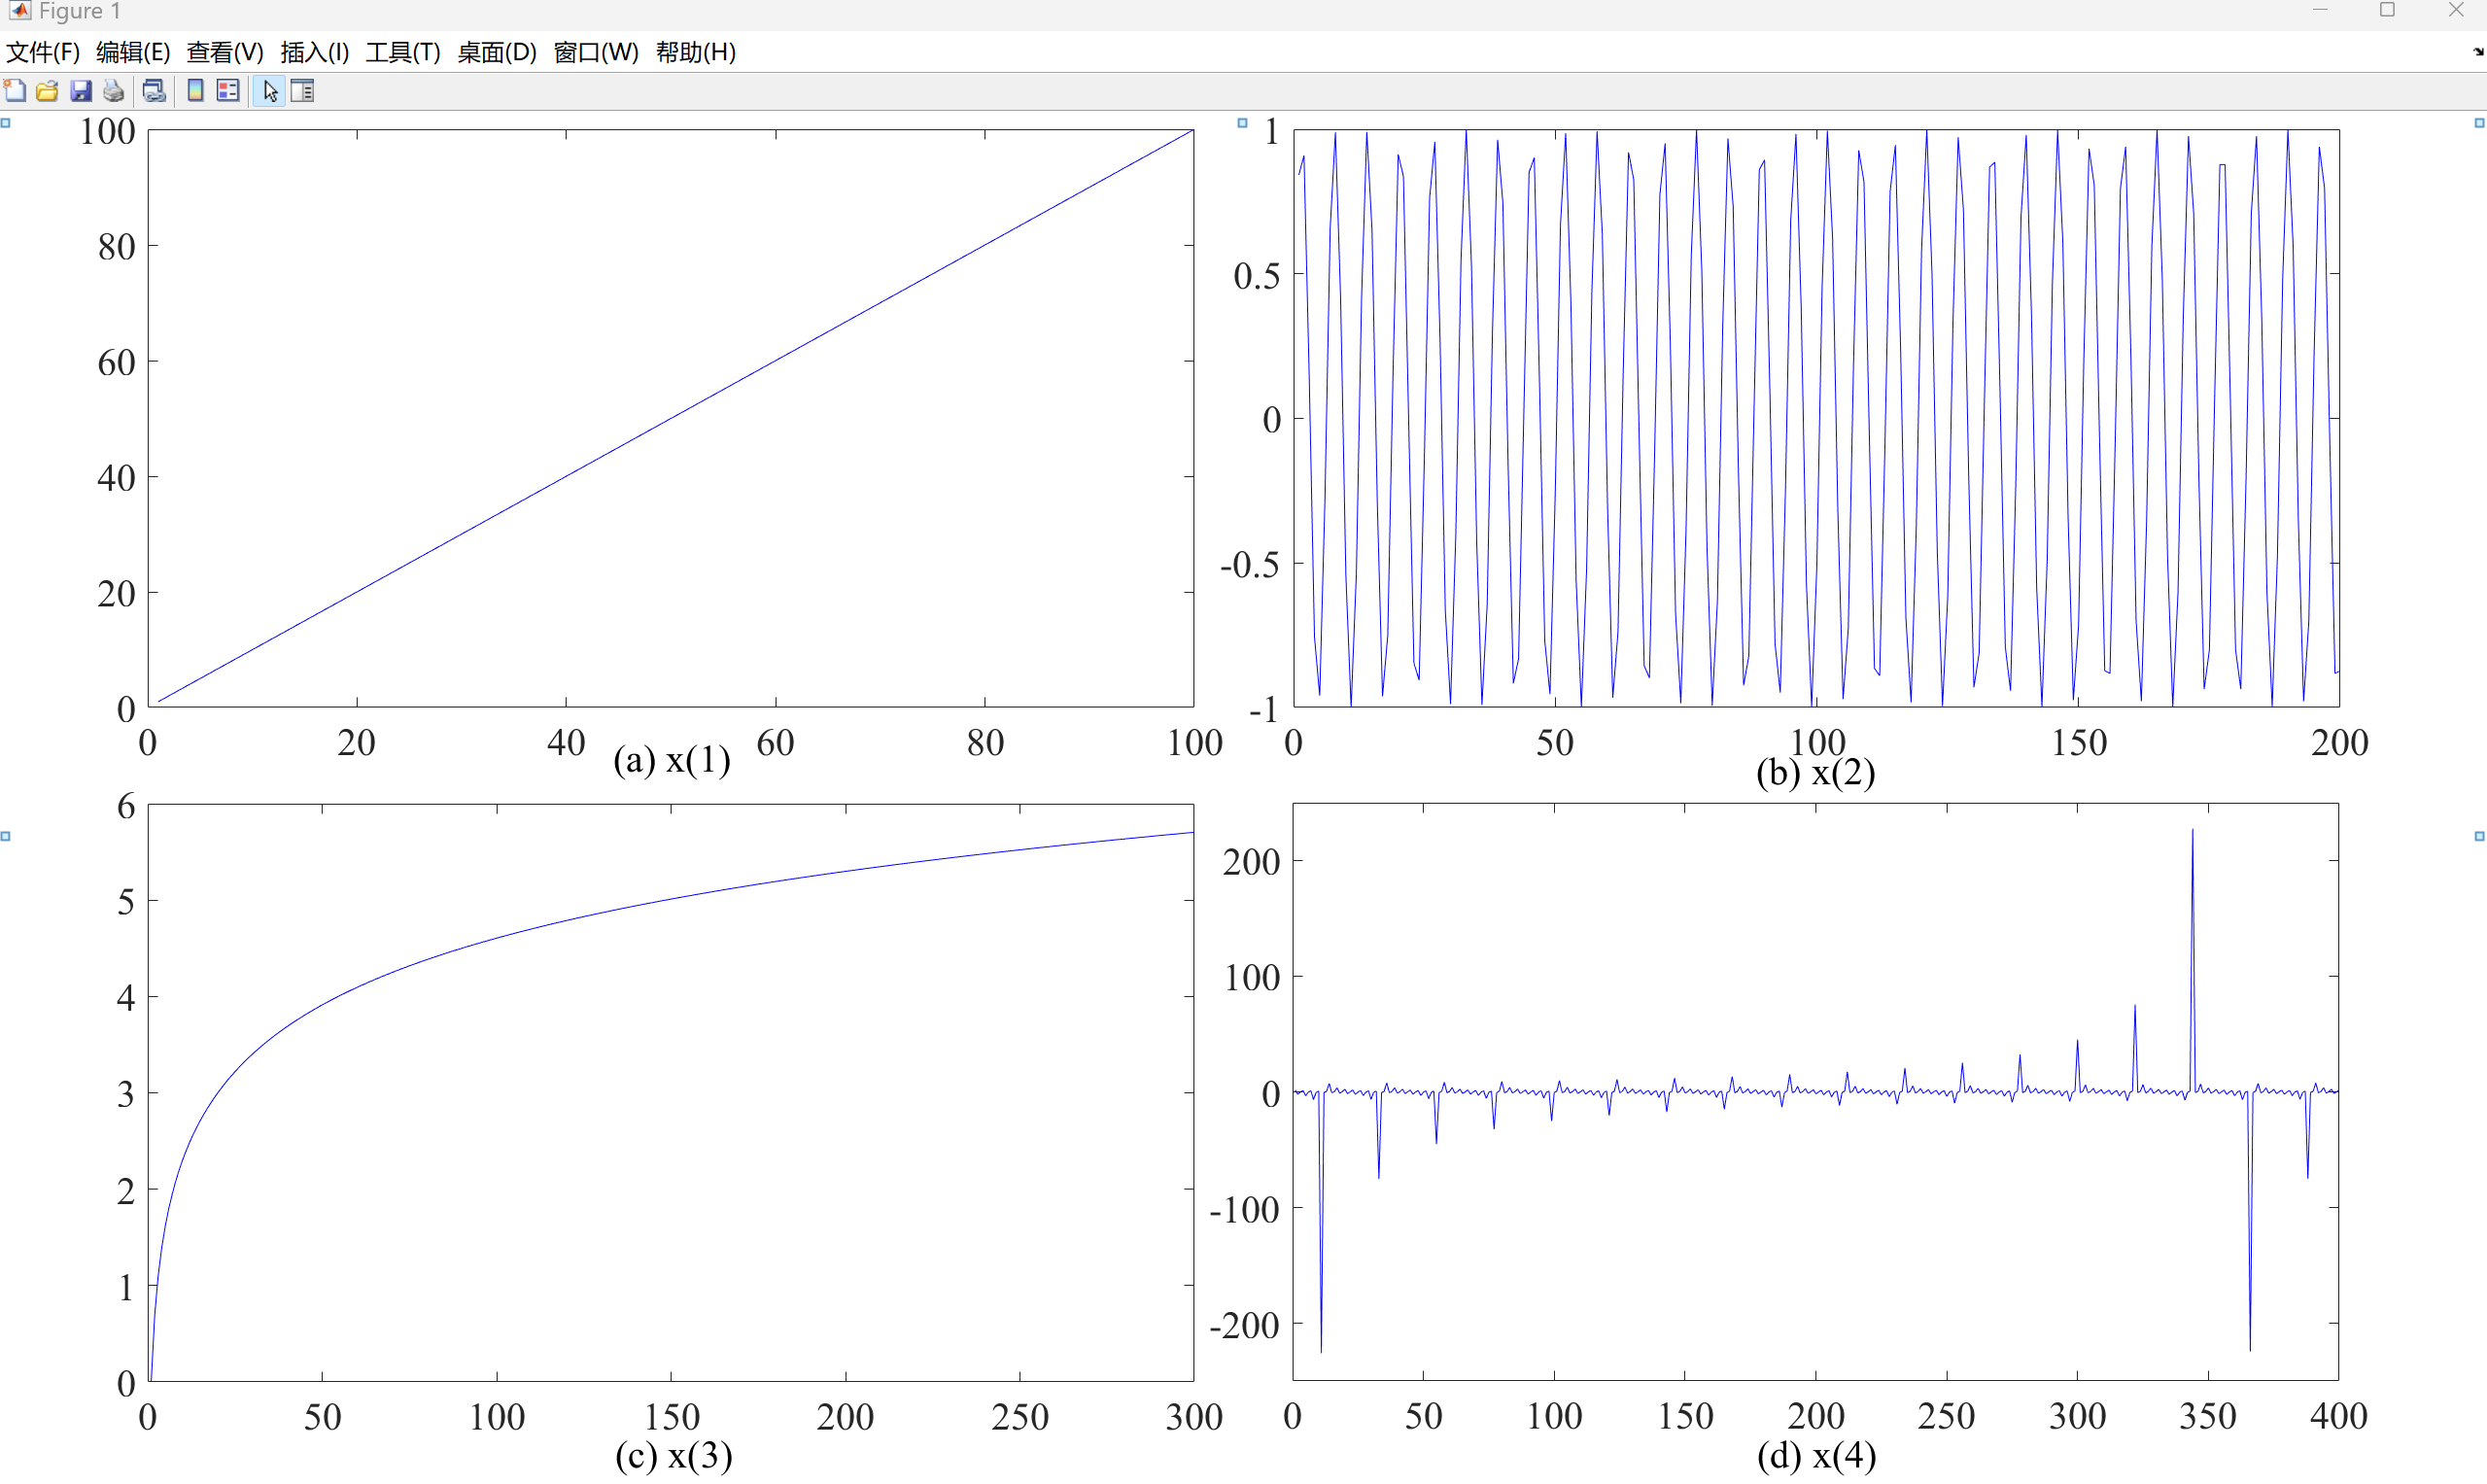
合并后的大图(需手动调整):