- 作者介绍
作者:曹晟,男,西安工程大学电子信息学院,2025级研究生。
研究方向:图像生成
电子邮件:caosheng216@163.com,
作者:董柯帆,西安工程大学电子信息学院,2025级研究生 张宏伟人工智能课题组
研究方向:机器视觉与人工智能
联系邮箱:867068473@qq.com
- 关于理论方面的知识介绍
2.1 逻辑回归二分类算法原理
逻辑回归用于二分类任务。模型先对输入特征进行线性组合 z=w^T x+b,再通过 Sigmoid 函数将结果映射到 0-1 概率区间。当概率大于阈值(通常设为 0.5)时判定为正类,否则判定为负类。该方法本质是"线性边界 + 概率输出"的分类模型。
2.2 算法讲解与分析
本实验优化目标为最小化预测概率与真实标签之间的交叉熵损失,训练过程通过求解器迭代更新参数。参数意义如下:penalty=l2 表示使用 L2 正则项抑制过拟合;C=1.0 为正则化强度的倒数,C 越大模型对训练集拟合越强,C 越小正则化约束越强;solver=liblinear 适用于中小规模二分类任务,收敛稳定;max_iter=1000 用于保证迭代充分,避免"未收敛"告警;seed=42 用于固定随机过程,提高复现性;StandardScaler 用于统一特征尺度,降低不同量纲对优化路径的干扰。从判别机理看,模型先计算 z=w^T x+b,再通过 Sigmoid 映射为恶性概率,最后按阈值完成二分类决策。
- 关于实验过程的介绍,完整实验代码,测试结果
3.1 数据集来源与介绍
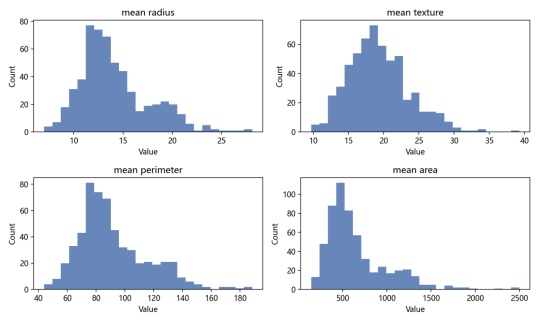
本实验使用 scikit-learn 内置乳腺癌数据集 load_breast_cancer(对应 Wisconsin Diagnostic Breast Cancer, WDBC)。该数据集包含 569 个样本、30 个连续特征,标签为良性(benign)与恶性(malignant)两类。各特征来自 FNA 图像中的细胞核统计量,代表性字段包括 mean radius、mean texture、mean perimeter、mean area 等。实验采用 8:2 划分训练集与测试集,并使用 stratify 保持类别比例一致,再进行标准化预处理,以保证训练稳定性和评估公平性。
3.2 实验环境与代码实现过程
实验环境:Python 3.x,numpy,pandas,scikit-learn,matplotlib,seaborn。代码实现流程分为五步:第一步读取数据并拆分特征与标签;第二步进行分层训练/测试划分;第三步使用 StandardScaler 在训练集拟合并对训练集和测试集同步变换;第四步构建并训练 LogisticRegression 模型;第五步计算 Accuracy、Precision、Recall、F1、ROC-AUC 并输出可视化文件。程序通过时间戳创建独立输出目录,便于不同实验配置横向对比与结果追踪。
主要运行命令:python main.py --config configs/2026-05-06_logreg_breast_cancer_baseline.yaml。该命令会读取配置文件中的数据划分参数和模型超参数,执行完整训练评估流程,并在 outputs 目录下生成带时间戳的结果子目录。
3.3 测试结果与可视化
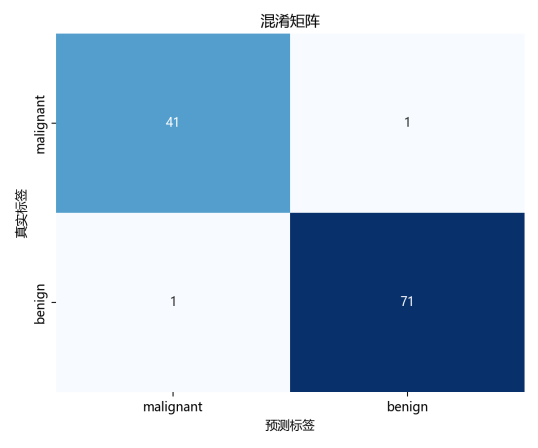
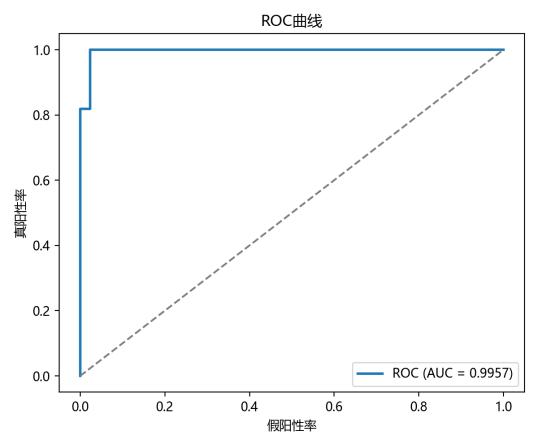
模型在测试集上的结果为:Accuracy=0.9825,Precision=0.9861,Recall=0.9861,F1=0.9861,ROC-AUC=0.9957。其中,ROC-AUC 接近 1,说明模型对两类样本具有较强区分能力;Precision 与 Recall 同时较高,表示误报和漏报控制较为均衡。结合混淆矩阵可见,良性与恶性样本均被较好识别,验证了"标准化 + 逻辑回归"作为课程基线方案的有效性。
结果文件目录:D:/桌面/人工智能课程/breast_cancer_logreg/outputs/logreg_breast_cancer_baseline_20260507_184002
3.4 编程过程中遇到的问题与解决办法
问题一:脚本只打印评估指标,但未生成图片文件。在调试初期,终端可输出 Accuracy 等指标,但 outputs 目录中缺少混淆矩阵和 ROC 图。原因是图像仅完成绘制,未执行 plt.savefig(...),或者输出目录未提前创建。解决方法是在保存前确保目录存在(如 os.makedirs(out_dir, exist_ok=True)),并对每张图显式执行保存调用。修复后可稳定生成 confusion_matrix.png、roc_curve.png、feature_histograms.png。
问题二:可视化图中的中文文字显示乱码。原因是 matplotlib 默认字体可能不支持中文,导致标题与坐标轴出现方块或乱码。解决方法是在程序开始处设置中文字体(如 Microsoft YaHei),并设置 plt.rcParams'axes.unicode_minus'=False,保证中文和负号均可正常显示。修复后图表可直接用于课程汇报展示。
3.5 完整实验代码(main.py)
以下为本实验主程序代码:
python
import argparse
import json
import random
from datetime import datetime
from pathlib import Path

import matplotlib.pyplot as plt
plt.rcParams["font.sans-serif"] = ["Microsoft YaHei"]
plt.rcParams["axes.unicode_minus"] = False

import numpy as np
import seaborn as sns
import yaml
from sklearn.datasets import load_breast_cancer
from sklearn.linear_model import LogisticRegression
from sklearn.metrics import (
    accuracy_score,
    confusion_matrix,
    f1_score,
    precision_score,
    recall_score,
    roc_auc_score,
    roc_curve,
)
from sklearn.model_selection import train_test_split
from sklearn.preprocessing import StandardScaler


def set_seed(seed: int) -> None:
    random.seed(seed)
    np.random.seed(seed)


def parse_args() -> argparse.Namespace:
    parser = argparse.ArgumentParser(description="Breast cancer classification with logistic regression.")
    parser.add_argument(
        "--config",
        type=str,
        default="configs/2026-05-06_logreg_breast_cancer_baseline.yaml",
        help="Path to experiment config YAML.",
    )
    return parser.parse_args()


def ensure_dir(path: Path) -> None:
    path.mkdir(parents=True, exist_ok=True)


def save_confusion_matrix(cm: np.ndarray, class_names: list[str], save_path: Path) -> None:
    plt.figure(figsize=(6, 5))
    sns.heatmap(cm, annot=True, fmt="d", cmap="Blues", cbar=False, xticklabels=class_names, yticklabels=class_names)
    plt.title("混淆矩阵")
    plt.xlabel("预测标签")
    plt.ylabel("真实标签")
    plt.tight_layout()
    plt.savefig(save_path, dpi=200)
    plt.close()


def save_roc_curve(y_true: np.ndarray, y_score: np.ndarray, save_path: Path) -> None:
    fpr, tpr, _ = roc_curve(y_true, y_score)
    auc = roc_auc_score(y_true, y_score)
    plt.figure(figsize=(6, 5))
    plt.plot(fpr, tpr, lw=2, label=f"ROC (AUC = {auc:.4f})")
    plt.plot([0, 1], [0, 1], linestyle="--", color="gray")
    plt.xlabel("假阳性率")
    plt.ylabel("真阳性率")
    plt.title("ROC曲线")
    plt.legend(loc="lower right")
    plt.tight_layout()
    plt.savefig(save_path, dpi=200)
    plt.close()


def save_feature_histograms(X: np.ndarray, feature_names: list[str], save_path: Path) -> None:
    top_features = ["mean radius", "mean texture", "mean perimeter", "mean area"]
    indices = [feature_names.index(name) for name in top_features]
    plt.figure(figsize=(10, 6))
    for i, idx in enumerate(indices, start=1):
        plt.subplot(2, 2, i)
        plt.hist(X[:, idx], bins=25, color="#4C72B0", alpha=0.85)
        plt.title(top_features[i - 1])
        plt.xlabel("Value")
        plt.ylabel("Count")
    plt.tight_layout()
    plt.savefig(save_path, dpi=200)
    plt.close()


def main() -> None:
    args = parse_args()
    config_path = Path(args.config)
    with config_path.open("r", encoding="utf-8") as f:
        cfg = yaml.safe_load(f)

    set_seed(cfg["seed"])
    run_name = cfg["experiment_name"]
    run_date = datetime.now().strftime("%Y%m%d_%H%M%S")
    output_dir = Path(cfg["output_dir"]) / f"{run_name}_{run_date}"
    ensure_dir(output_dir)

    data = load_breast_cancer()
    X = data.data
    y = data.target
    feature_names = list(data.feature_names)
    class_names = list(data.target_names)

    X_train, X_test, y_train, y_test = train_test_split(
        X,
        y,
        test_size=cfg["data"]["test_size"],
        random_state=cfg["seed"],
        stratify=y,
    )

    scaler = StandardScaler()
    X_train_scaled = scaler.fit_transform(X_train)
    X_test_scaled = scaler.transform(X_test)

    model = LogisticRegression(
        penalty=cfg["model"]["penalty"],
        C=cfg["model"]["C"],
        solver=cfg["model"]["solver"],
        max_iter=cfg["model"]["max_iter"],
        random_state=cfg["seed"],
    )
    model.fit(X_train_scaled, y_train)

    y_pred = model.predict(X_test_scaled)
    y_prob = model.predict_proba(X_test_scaled)[:, 1]

    metrics = {
        "accuracy": float(accuracy_score(y_test, y_pred)),
        "precision": float(precision_score(y_test, y_pred)),
        "recall": float(recall_score(y_test, y_pred)),
        "f1": float(f1_score(y_test, y_pred)),
        "roc_auc": float(roc_auc_score(y_test, y_prob)),
    }

    cm = confusion_matrix(y_test, y_pred)


    save_confusion_matrix(cm, class_names, output_dir / "confusion_matrix.png")
    save_roc_curve(y_test, y_prob, output_dir / "roc_curve.png")
    save_feature_histograms(X, feature_names, output_dir / "feature_histograms.png")

    result = {
        "experiment_name": run_name,
        "run_time": run_date,
        "seed": cfg["seed"],
        "config_path": str(config_path.as_posix()),
        "dataset": "sklearn.datasets.load_breast_cancer",
        "model": cfg["model"],
        "data": cfg["data"],
        "metrics": metrics,
        "notes": [
            "Nondeterministic source reminder: BLAS backend, CPU threading, and sklearn internal parallel paths may still introduce tiny numeric variation.",
            "If strict reproducibility is required, fix library versions and thread counts.",
        ],
    }

    with (output_dir / "result_summary.json").open("w", encoding="utf-8") as f:
        json.dump(result, f, indent=2, ensure_ascii=False)

    print(f"[INFO] Output directory: {output_dir}")
    print("[INFO] Metrics:")
    for k, v in metrics.items():
        print(f"  - {k}: {v:.4f}")
    print("[INFO] Saved files:")
    print(f"  - {(output_dir / 'confusion_matrix.png').as_posix()}")
    print(f"  - {(output_dir / 'roc_curve.png').as_posix()}")
    print(f"  - {(output_dir / 'feature_histograms.png').as_posix()}")
    print(f"  - {(output_dir / 'result_summary.json').as_posix()}")


if __name__ == "__main__":
main()- 参考链接
(1)scikit-learn 官方文档:LogisticRegression
(2)scikit-learn 官方文档:load_breast_cancer 数据集
(3)UCI Machine Learning Repository:WDBC 数据说明