功能:
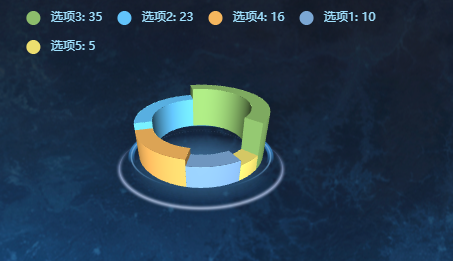
- 1、3D柱状
- 2、扇形(空心半径可配置)
- 3、自定义图片底座
- 4、展示tooltip
效果:
组件代码:pie_3Dstyle02_chart.vue
html
<!-- 3D旋转饼状图 自定义样式-->
<template>
  <!-- 饼图 -->
  <div class="container">
    <!-- 🔴 修改点1:将 id 改为 ref,防止同一页面引入多次时 id 冲突 -->
    <div class="chartsGl" ref="chartRef"></div>
    <!-- 饼图下面的底座 -->
    <div class="buttomCharts" v-if="internalDiameterRatio !== 0"></div>
  </div>
</template>

<script>
import * as echarts from "echarts";
import "echarts-gl";
require("echarts/theme/macarons"); // echarts theme

export default {
  name: "Pie3DStyle02Chart",
  components: {},
  // 🔴 修改点2:定义 props 接收父组件传来的数据
  props: {
    dataList: {
      type: Array,
      default: () => [],
    },
    // 高度乘数,默认值为 50
    heightMultiplier: {
      type: Number,
      default: 50,
    },
    // 内部空心占比比例,默认值为 0.85
    internalDiameterRatio: {
      type: Number,
      default: 0.85,
    },
  },
  data() {
    return {
      myChart: null, // 🔴 保存 echarts 实例
    };
  },
  mounted() {
    this.$nextTick(() => {
      this.init();
    });
  },
  // 🔴 修改点3:添加 watch 监听,当父组件数据异步更新时,重新渲染图表
  watch: {
    dataList: {
      handler(newVal) {
        if (newVal) {
          this.$nextTick(() => {
            this.init();
          });
        }
      },
      deep: true, // 深度监听
    },
  },
  // 🔴 修改点4:组件销毁时释放图表内存,防止内存泄漏
  beforeDestroy() {
    if (this.myChart) {
      this.myChart.dispose();
      this.myChart = null;
    }
  },
  methods: {
    init() {
      // 🔴 修改点5:使用 ref 获取 DOM 节点,且复用实例
      if (!this.myChart) {
        this.myChart = echarts.init(this.$refs.chartRef);
      }

      // 🔴 修改点6:防空判断,如果没传数据则清空图表
      if (!this.dataList || this.dataList.length === 0) {
        this.myChart.clear();
        return;
      }

      // 🔴 修改点7:将 this.optionData 替换为 this.dataList
      let rawData = JSON.parse(JSON.stringify(this.dataList));
      let option = this.getPie3D(rawData, this.internalDiameterRatio);
      this.myChart.setOption(option, true); // 加上 true 表示不合并配置
    },
    //配置构建 pieData 饼图数据 internalDiameterRatio:透明的空心占比
    getPie3D(pieData, internalDiameterRatio) {
      let that = this;
      let series = [];
      let sumValue = 0;
      let startValue = 0;
      let endValue = 0;
      let legendData = [];
      let legendBfb = [];
      let k = 1 - internalDiameterRatio;
      pieData.sort((a, b) => {
        return b.value - a.value;
      });
      // 为每一个饼图数据,生成一个 series-surface(参数曲面) 配置
      for (let i = 0; i < pieData.length; i++) {
        sumValue += pieData[i].value;
        let seriesItem = {
          name:
            typeof pieData[i].name === "undefined"
              ? `series${i}`
              : pieData[i].name,
          type: "surface",
          parametric: true,
          wireframe: {
            show: false,
          },
          pieData: pieData[i],
          pieStatus: {
            selected: false,
            hovered: false,
            k: k,
          },
        };
        if (typeof pieData[i].itemStyle != "undefined") {
          let itemStyle = {};
          typeof pieData[i].itemStyle.color != "undefined"
            ? (itemStyle.color = pieData[i].itemStyle.color)
            : null;
          typeof pieData[i].itemStyle.opacity != "undefined"
            ? (itemStyle.opacity = pieData[i].itemStyle.opacity)
            : null;
          seriesItem.itemStyle = itemStyle;
        }
        series.push(seriesItem);
      }

      legendData = [];
      legendBfb = [];
      for (let i = 0; i < series.length; i++) {
        endValue = startValue + series[i].pieData.value;
        series[i].pieData.startRatio = startValue / sumValue;
        series[i].pieData.endRatio = endValue / sumValue;
        series[i].parametricEquation = this.getParametricEquation(
          series[i].pieData.startRatio,
          series[i].pieData.endRatio,
          false,
          false,
          k,
          series[i].pieData.value
        );
        startValue = endValue;
        let bfb = that.fomatFloat(series[i].pieData.value / sumValue, 4);
        legendData.push({
          name: series[i].name,
          value: bfb,
        });
        legendBfb.push({
          name: series[i].name,
          value: bfb,
        });
      }

      let boxHeight = this.getHeight3D(series, 13, this.heightMultiplier);

      let option = {
        legend: {
          data: legendData,
          orient: "horizontal",
          left: "center",
          top: 10,
          itemGap: 15,
          textStyle: {
            color: "#A1E2FF",
          },
          show: true,
          icon: "circle",
          formatter: function (name) {
            var target;
            for (var i = 0, l = pieData.length; i < l; i++) {
              if (pieData[i].name == name) {
                target = pieData[i].value;
              }
            }
            return `${name}: ${target}`;
          },
        },
        // 提示框
        tooltip: {
          formatter: (params) => {
            if (
              params.seriesName !== "mouseoutSeries" &&
              params.seriesName !== "pie2d"
            ) {
              if (
                params.seriesIndex !== undefined &&
                option.series[params.seriesIndex]
              ) {
                let bfb =
                  (option.series[params.seriesIndex].pieData.endRatio -
                    option.series[params.seriesIndex].pieData.startRatio) *
                  100;
                return (
                  `${params.seriesName}<br/>` +
                  `<span style="display:inline-block;margin-right:5px;border-radius:10px;width:10px;height:10px;background-color:${params.color};"></span>` +
                  `${bfb.toFixed(2)}%`
                );
              }
            }
          },
        },
        xAxis3D: { min: -1, max: 1 },
        yAxis3D: { min: -1, max: 1 },
        zAxis3D: { min: -1, max: 1 },
        grid3D: {
          show: false,
          boxHeight: boxHeight,
          top: "20.5%",
          viewControl: {
            alpha: 30,
            distance: 200,
            rotateSensitivity: 0,
            zoomSensitivity: 0,
            panSensitivity: 0,
            autoRotate: false,
          },
        },
        series: series,
      };
      return option;
    },
    getHeight3D(series, height, heightMultiplier) {
      if (!series || series.length === 0) return 1;
      series.sort((a, b) => {
        return b.pieData.value - a.pieData.value;
      });
      return (height * heightMultiplier) / series[0].pieData.value;
    },
    getParametricEquation(startRatio, endRatio, isSelected, isHovered, k, h) {
      let midRatio = (startRatio + endRatio) / 2;
      let startRadian = startRatio * Math.PI * 2;
      let endRadian = endRatio * Math.PI * 2;
      let midRadian = midRatio * Math.PI * 2;
      if (startRatio === 0 && endRatio === 1) {
        isSelected = false;
      }
      k = typeof k !== "undefined" ? k : 1 / 3;
      let offsetX = isSelected ? Math.cos(midRadian) * 0.1 : 0;
      let offsetY = isSelected ? Math.sin(midRadian) * 0.1 : 0;
      let hoverRate = isHovered ? 1.05 : 1;
      return {
        u: { min: -Math.PI, max: Math.PI * 3, step: Math.PI / 32 },
        v: { min: 0, max: Math.PI * 2, step: Math.PI / 20 },
        x: function (u, v) {
          if (u < startRadian) {
            return (
              offsetX +
              Math.cos(startRadian) * (1 + Math.cos(v) * k) * hoverRate
            );
          }
          if (u > endRadian) {
            return (
              offsetX + Math.cos(endRadian) * (1 + Math.cos(v) * k) * hoverRate
            );
          }
          return offsetX + Math.cos(u) * (1 + Math.cos(v) * k) * hoverRate;
        },
        y: function (u, v) {
          if (u < startRadian) {
            return (
              offsetY +
              Math.sin(startRadian) * (1 + Math.cos(v) * k) * hoverRate
            );
          }
          if (u > endRadian) {
            return (
              offsetY + Math.sin(endRadian) * (1 + Math.cos(v) * k) * hoverRate
            );
          }
          return offsetY + Math.sin(u) * (1 + Math.cos(v) * k) * hoverRate;
        },
        z: function (u, v) {
          if (u < -Math.PI * 0.5) {
            return Math.sin(u);
          }
          if (u > Math.PI * 2.5) {
            return Math.sin(u) * h * 0.1;
          }
          return Math.sin(v) > 0 ? 1 * h * 0.1 : -1;
        },
      };
    },
    fomatFloat(num, n) {
      var f = parseFloat(num);
      if (isNaN(f)) {
        return false;
      }
      f = Math.round(num * Math.pow(10, n)) / Math.pow(10, n);
      var s = f.toString();
      var rs = s.indexOf(".");
      if (rs < 0) {
        rs = s.length;
        s += ".";
      }
      while (s.length <= rs + n) {
        s += "0";
      }
      return s;
    },
  },
};
</script>

<style lang="scss" scoped>
.container {
  position: relative;
  display: flex;
  justify-content: center;
  width: 100%;
  height: 100%;
}
.chartsGl {
  position: absolute;
  height: 200px;
  width: 400px;
}
.buttomCharts {
  background: center top url(~@/assets/images/icon_chart_01.png) no-repeat;
  background-size: cover;
  height: 180px;
  width: 180px;
  margin-top: 56px;
}
</style>
页面中引用:
html
<div class="chart-container">
      <Pie3DStyle02Chart :dataList="myChartData02" />
    </div>
数据源:
html
 //饼图数据+颜色
      myChartData02: [
        {
          name: "选项1", //名称
          value: 10, //值
          itemStyle: {
            //颜色 紫色
            color: "rgba(123, 167, 212,1)",
          },
        },
        {
          name: "选项2", //蓝色
          value: 23,
          itemStyle: {
            color: "rgba(98, 195, 250,1)",
          },
        },
        {
          name: "选项3", //绿色
          value: 35,
          itemStyle: {
            color: "rgba(140, 189, 107,1)",
          },
        },
        {
          name: "选项4", //橙色
          value: 16,
          itemStyle: {
            color: "rgba(245, 182, 94,1)",
          },
        },
        {
          name: "选项5", //黄色
          value: 5,
          itemStyle: {
            color: "rgba(237, 222, 111,1)",
          },
        },
      ],
样式:
html
  .chart-container {
    width: 400px;
    height: 400px;
  }