Cesium 入门系列(四):区域高亮显示的两种实现方案
业务场景:在地图上把某个行政区、园区、地块用颜色填充并描边,让用户一眼识别目标范围。Cesium 里常见的做法分两类------前端矢量高亮与后端瓦片遮罩。本文会给出可直接运行的完整代码,并对比它们的适用场景。
一、前端矢量高亮(Entity / GeoJSON)
1.1 方案特点
优点:
- 交互灵活:随时开启、关闭、修改透明度、颜色。
- 支持鼠标悬浮高亮、点击切换等事件。
- 不需要后端服务,部署简单。
缺点:
- 边界越复杂(例如上万节点的省界),前端渲染压力越大。
- 超大 GeoJSON 会阻塞主线程,需要抽稀或切块。
适用场景:
区县、小范围区域、需要频繁交互切换的高亮需求。
1.2 实现代码
假设项目 public 目录下已有 dongcheng.geojson,核心逻辑如下:
vue
<script setup>
import * as Cesium from 'cesium'
import { onBeforeUnmount, onMounted } from 'vue'

const TIANDITU_TOKEN = '*****' // 替换为你的天地图浏览器端 token

let viewer = null

function createTiandituLayer(layerName) {
  return new Cesium.WebMapTileServiceImageryProvider({
    url: `https://t{s}.tianditu.gov.cn/${layerName}_w/wmts?service=wmts&request=GetTile&version=1.0.0&LAYER=${layerName}&tileMatrixSet=w&TileMatrix={TileMatrix}&TileRow={TileRow}&TileCol={TileCol}&style=default&format=tiles&tk=${TIANDITU_TOKEN}`,
    layer: layerName,
    style: 'default',
    format: 'tiles',
    tileMatrixSetID: 'w',
    subdomains: ['0', '1', '2', '3', '4', '5', '6', '7'],
    maximumLevel: 18,
  })
}

// 加载东城区 GeoJSON 并高亮显示
async function loadDistrictOutline() {
  try {
    const dataSource = await Cesium.GeoJsonDataSource.load(
      '/dongcheng.geojson',
      {
        stroke: Cesium.Color.fromCssColorString('#ffdd33'),
        fill: Cesium.Color.fromCssColorString('#ffdd33').withAlpha(0.35),
        strokeWidth: 4,
      },
    )
    await viewer.dataSources.add(dataSource)

    const entities = dataSource.entities.values
    for (const entity of entities) {
      if (entity.polygon) {
        // GeoJSON 内置 outline 不贴地,先关掉,再用 polyline 自己描边
        entity.polygon.outline = false
        entity.polygon.heightReference = Cesium.HeightReference.CLAMP_TO_GROUND

        const positions = entity.polygon.hierarchy.getValue(
          Cesium.JulianDate.now(),
        ).positions

        dataSource.entities.add({
          polyline: {
            positions,
            width: 4,
            material: Cesium.Color.fromCssColorString('#ffdd33'),
            clampToGround: true,
          },
        })
      }
    }

    await viewer.flyTo(dataSource, { duration: 2 })
  } catch (error) {
    console.error('加载东城区轮廓失败:', error)
  }
}

onMounted(() => {
  viewer = new Cesium.Viewer('cesium-container', {
    baseLayer: new Cesium.ImageryLayer(createTiandituLayer('img')),
    animation: false,
    timeline: false,
    geocoder: false,
    baseLayerPicker: false,
    homeButton: false,
    sceneModePicker: false,
    navigationHelpButton: false,
    fullscreenButton: false,
  })

  viewer.imageryLayers.addImageryProvider(createTiandituLayer('cia'))

  loadDistrictOutline()
})

onBeforeUnmount(() => {
  if (viewer) {
    viewer.destroy()
    viewer = null
  }
})
</script>

<template>
  <div id="cesium-container"></div>
</template>

<style scoped>
#cesium-container {
  width: 100%;
  height: 100%;
}
</style>
1.3 关键细节说明
| 代码行 | 作用 |
|---|---|
entity.polygon.outline = false |
关闭默认描边,因为默认 outline 不贴地,大区域会"飘在空中"。 |
entity.polygon.heightReference = Cesium.HeightReference.CLAMP_TO_GROUND |
让填充面贴地,避免地形起伏时穿帮。 |
polyline.clampToGround = true |
用 polyline 重新描边,保证边界线紧贴地面。 |
viewer.flyTo(dataSource) |
自动计算 GeoJSON 的包围盒并飞过去。 |
1.4 实现效果
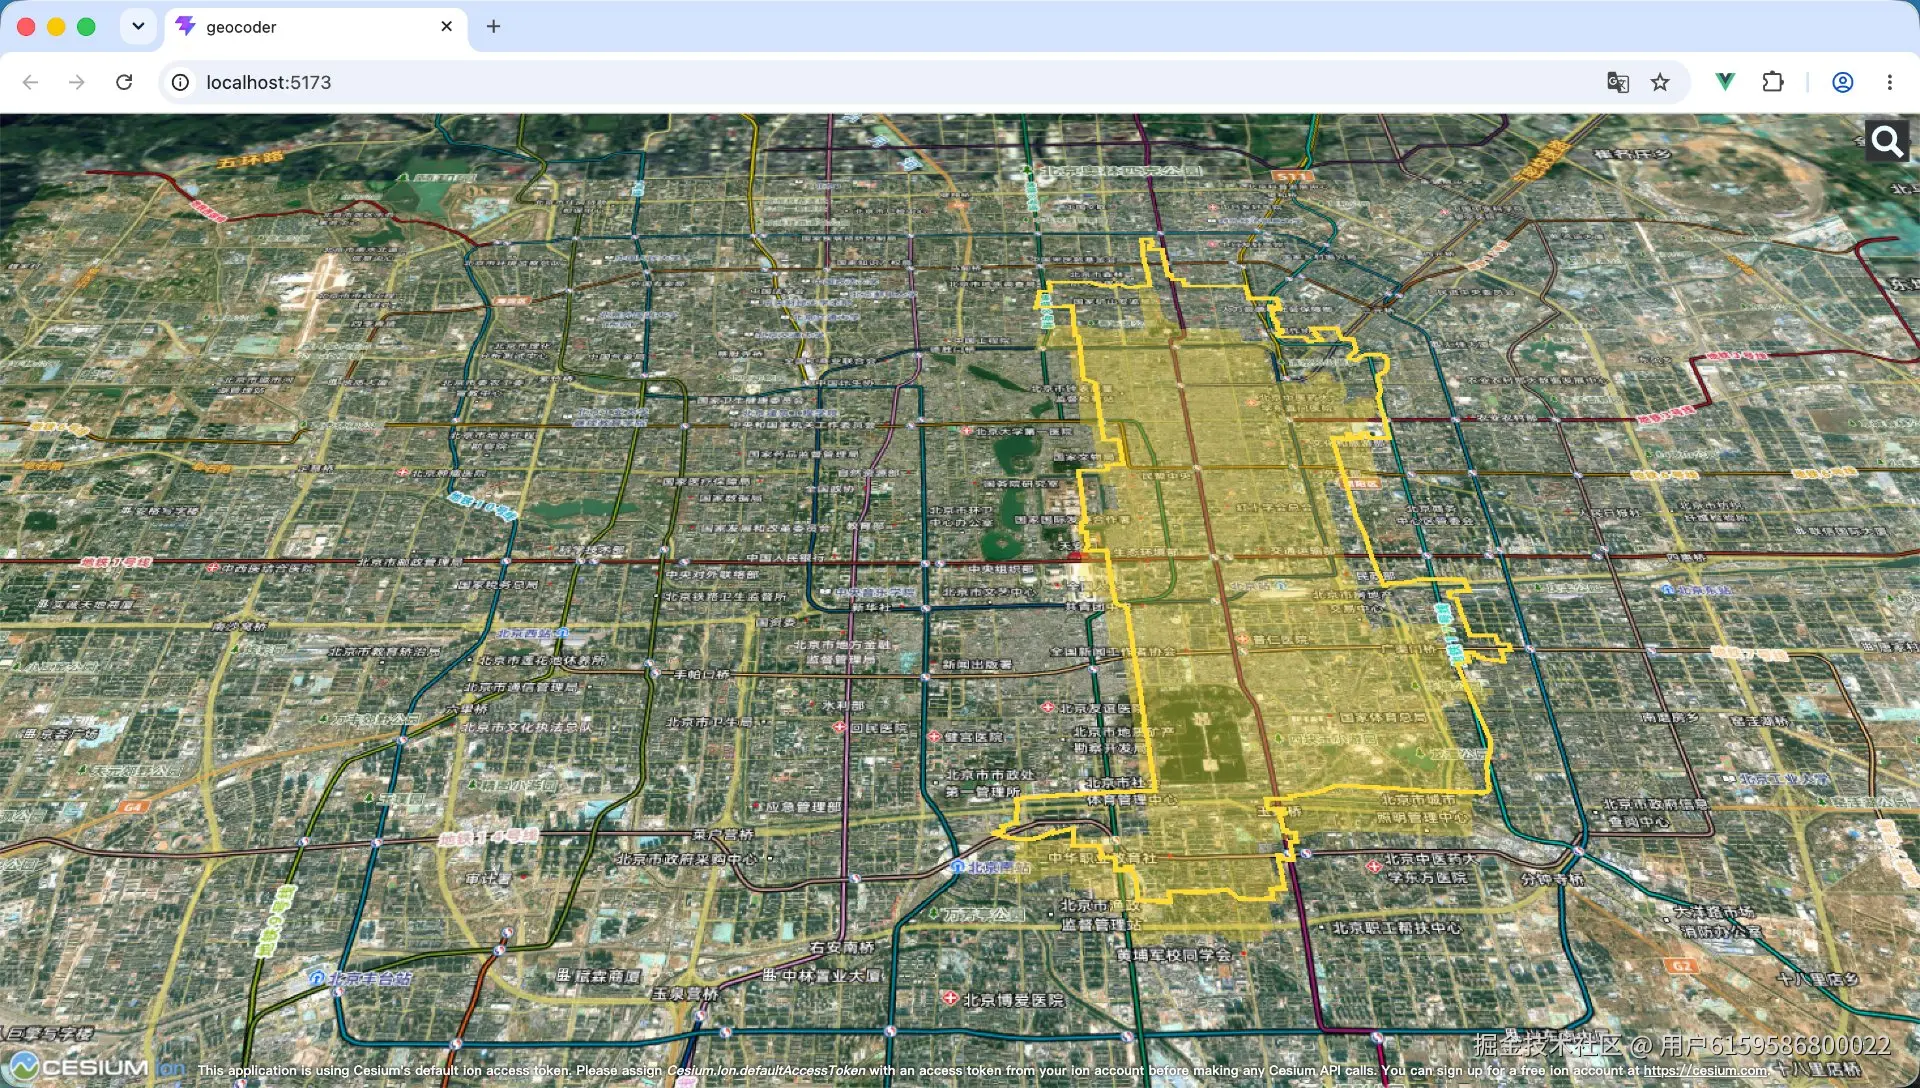
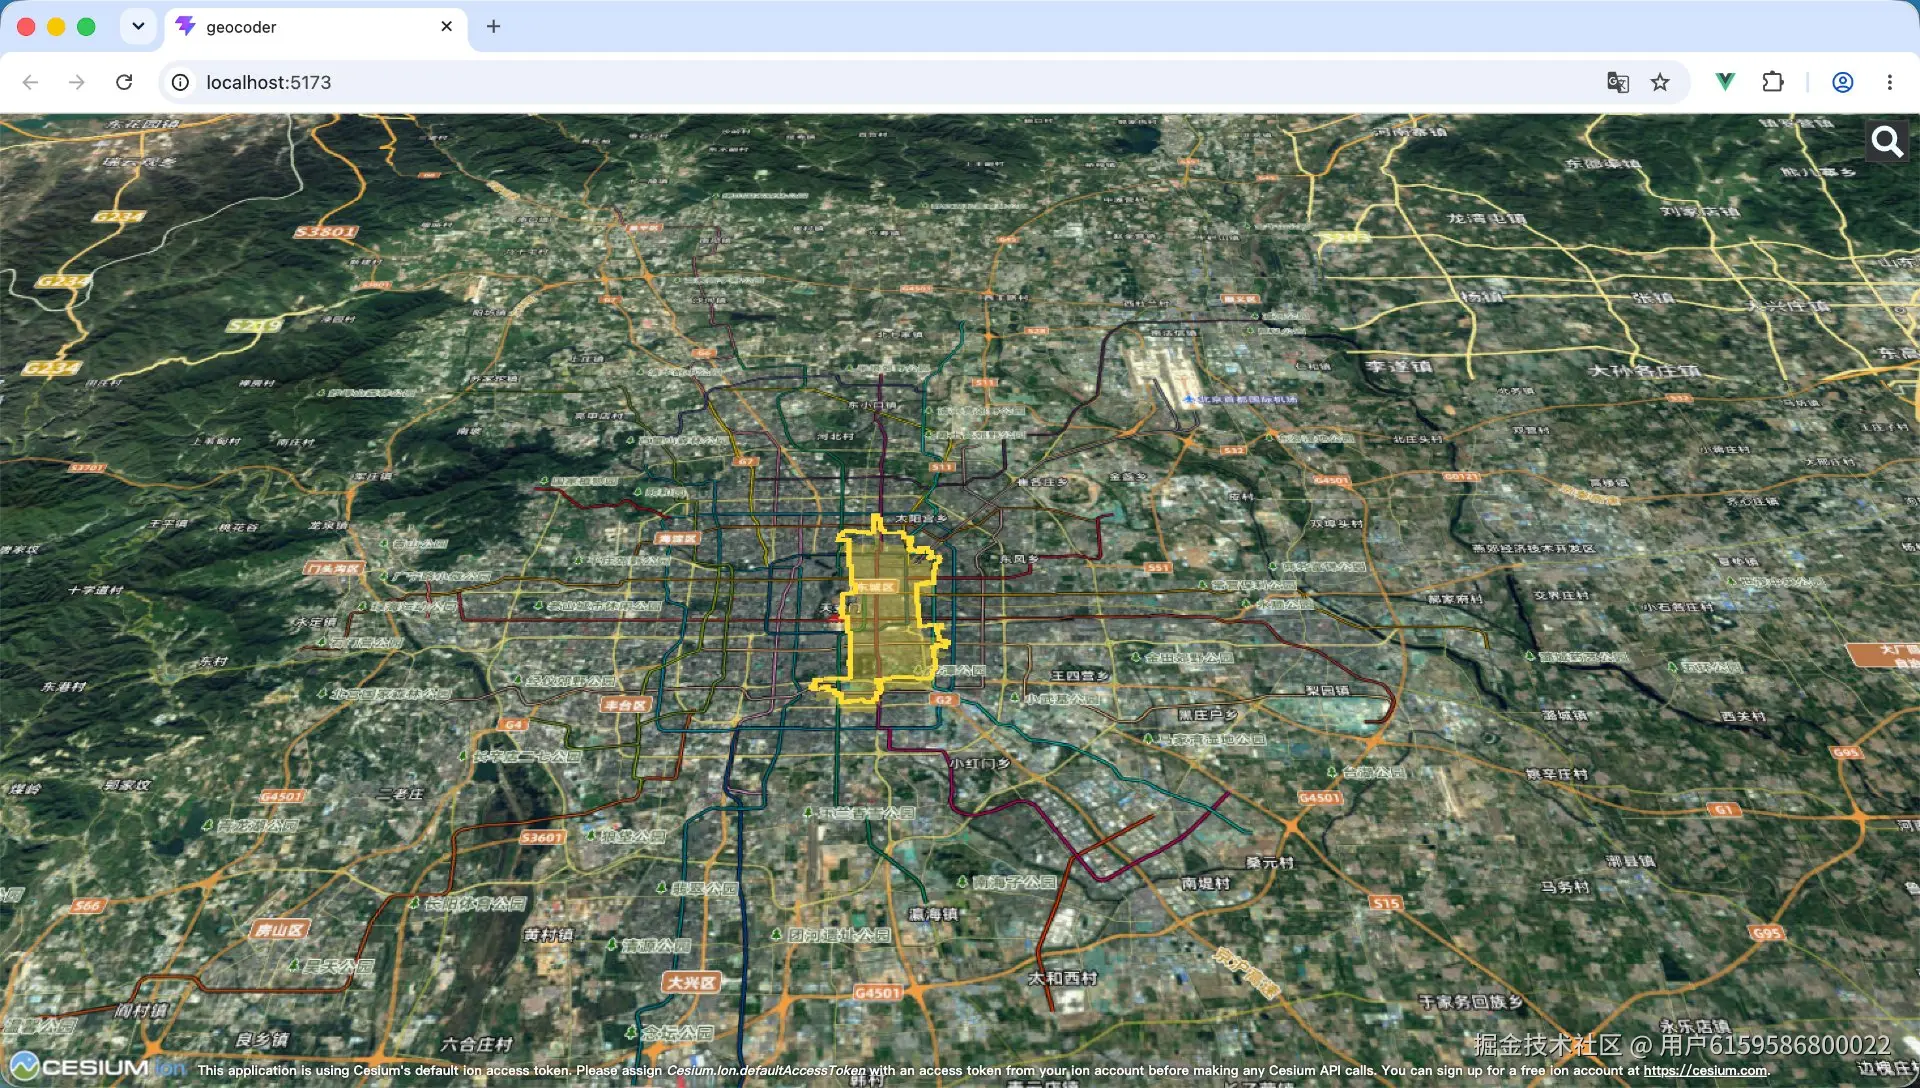
二、瓦片遮罩 / WMTS 过滤(后端 GIS 服务实现高亮)
2.1 方案特点
原理: 后端发布一张只包含高亮区域的 XYZ 瓦片服务,前端把它当成独立的 imageryLayer 叠加到底图上。
优点:
- 海量复杂行政区(省界、国界线)不卡前端。
- 瓦片按需加载,大范围也能流畅缩放。
缺点:
- 每次换高亮区域都要后端重新生成或切换数据源。
- 前端不能实时改颜色,需要后端改样式后重新切瓦片。
- 需要额外维护一套瓦片服务。
适用场景:
政务大屏、固定专题图、边界节点极多的大区域高亮。
2.2 后端瓦片服务
下面用 Node.js + Express + pngjs 模拟一个瓦片服务。
安装依赖:
bash
npm install express pngjsserver/tile-server.js:
js
const express = require('express')
const fs = require('fs')
const path = require('path')
const { PNG } = require('pngjs')

const PORT = 3001
const TILE = 256
const MAX_ZOOM = 18

// 读取与前端共用的一份 GeoJSON
const geojson = JSON.parse(
  fs.readFileSync(path.join(__dirname, '../public/dongcheng.geojson'), 'utf8'),
)

// 收集所有环(外环 + 内环)
const rings = []
const geom = geojson.features[0].geometry
if (geom.type === 'Polygon') {
  rings.push(...geom.coordinates)
} else if (geom.type === 'MultiPolygon') {
  for (const poly of geom.coordinates) rings.push(...poly)
}

// 高亮样式
const FILL = { r: 255, g: 221, b: 51, a: 90 }
const BORDER = { r: 255, g: 221, b: 51, a: 255 }
const BORDER_WIDTH = 2

// 经纬度 → Web Mercator 全局像素坐标(标准 XYZ 瓦片方案)
function project(lon, lat, z) {
  const n = TILE * 2 ** z
  const x = ((lon + 180) / 360) * n
  const rad = (lat * Math.PI) / 180
  const y =
    ((1 - Math.log(Math.tan(rad) + 1 / Math.cos(rad)) / Math.PI) / 2) * n
  return [x, y]
}

// 缓存每个 zoom 下的边集合与包围盒
const zoomCache = new Map()
function getZoomData(z) {
  if (zoomCache.has(z)) return zoomCache.get(z)

  const edges = []
  let minX = Infinity
  let minY = Infinity
  let maxX = -Infinity
  let maxY = -Infinity

  for (const ring of rings) {
    const pts = ring.map(([lon, lat]) => project(lon, lat, z))
    for (const [x, y] of pts) {
      minX = Math.min(minX, x)
      maxX = Math.max(maxX, x)
      minY = Math.min(minY, y)
      maxY = Math.max(maxY, y)
    }
    for (let i = 0; i < pts.length; i++) {
      const [x1, y1] = pts[i]
      const [x2, y2] = pts[(i + 1) % pts.length]
      if (y1 !== y2) edges.push([x1, y1, x2, y2])
    }
  }

  const data = { edges, bbox: [minX, minY, maxX, maxY] }
  zoomCache.set(z, data)
  return data
}

// 扫描线光栅化,返回 256×256 内部掩码
function rasterize(tx, ty, edges) {
  const mask = new Uint8Array(TILE * TILE)
  const x0 = tx * TILE
  const y0 = ty * TILE

  for (let py = 0; py < TILE; py++) {
    const y = y0 + py + 0.5
    const xs = []
    for (const [x1, y1, x2, y2] of edges) {
      if ((y >= y1 && y < y2) || (y >= y2 && y < y1)) {
        xs.push(x1 + ((y - y1) / (y2 - y1)) * (x2 - x1))
      }
    }
    if (xs.length < 2) continue
    xs.sort((a, b) => a - b)

    for (let i = 0; i + 1 < xs.length; i += 2) {
      const sx = Math.max(x0, Math.ceil(xs[i] - 0.5))
      const ex = Math.min(x0 + TILE - 1, Math.ceil(xs[i + 1] - 0.5) - 1)
      for (let gx = sx; gx <= ex; gx++) {
        mask[py * TILE + (gx - x0)] = 1
      }
    }
  }
  return mask
}

// 由内部掩码生成描边掩码
function edgeMask(mask) {
  let cur = new Uint8Array(mask.length)
  for (let y = 0; y < TILE; y++) {
    for (let x = 0; x < TILE; x++) {
      const i = y * TILE + x
      if (!mask[i]) continue
      const left = x > 0 ? mask[i - 1] : 1
      const right = x < TILE - 1 ? mask[i + 1] : 1
      const up = y > 0 ? mask[i - TILE] : 1
      const down = y < TILE - 1 ? mask[i + TILE] : 1
      if (!left || !right || !up || !down) cur[i] = 1
    }
  }

  // 膨胀加粗描边
  for (let pass = 1; pass < BORDER_WIDTH; pass++) {
    const next = new Uint8Array(cur)
    for (let y = 0; y < TILE; y++) {
      for (let x = 0; x < TILE; x++) {
        const i = y * TILE + x
        if (cur[i]) continue
        if (
          (x > 0 && cur[i - 1]) ||
          (x < TILE - 1 && cur[i + 1]) ||
          (y > 0 && cur[i - TILE]) ||
          (y < TILE - 1 && cur[i + TILE])
        ) {
          next[i] = 1
        }
      }
    }
    cur = next
  }
  return cur
}

const emptyTile = (() => {
  const png = new PNG({ width: TILE, height: TILE })
  return PNG.sync.write(png)
})()

const tileCache = new Map()

function renderTile(z, tx, ty) {
  const key = `${z}/${tx}/${ty}`
  if (tileCache.has(key)) return tileCache.get(key)

  const { edges, bbox } = getZoomData(z)
  let result = emptyTile

  if (
    tx * TILE < bbox[2] &&
    (tx + 1) * TILE > bbox[0] &&
    ty * TILE < bbox[3] &&
    (ty + 1) * TILE > bbox[1]
  ) {
    const mask = rasterize(tx, ty, edges)
    let any = false
    for (const v of mask) {
      if (v) {
        any = true
        break
      }
    }

    if (any) {
      const border = edgeMask(mask)
      const png = new PNG({ width: TILE, height: TILE })
      for (let i = 0; i < mask.length; i++) {
        const o = i * 4
        if (border[i]) {
          png.data[o] = BORDER.r
          png.data[o + 1] = BORDER.g
          png.data[o + 2] = BORDER.b
          png.data[o + 3] = BORDER.a
        } else if (mask[i]) {
          png.data[o] = FILL.r
          png.data[o + 1] = FILL.g
          png.data[o + 2] = FILL.b
          png.data[o + 3] = FILL.a
        }
      }
      result = PNG.sync.write(png)
    }
  }

  tileCache.set(key, result)
  return result
}

const app = express()

app.get('/tiles/:z/:x/:y.png', (req, res) => {
  const z = +req.params.z
  const x = +req.params.x
  const y = +req.params.y

  if (
    !Number.isInteger(z) ||
    !Number.isInteger(x) ||
    !Number.isInteger(y) ||
    z < 0 ||
    z > MAX_ZOOM ||
    x < 0 ||
    x >= 2 ** z ||
    y < 0 ||
    y >= 2 ** z
  ) {
    return res.status(400).json({ error: 'invalid tile coordinates' })
  }

  const buf = renderTile(z, x, y)
  res.set({
    'Content-Type': 'image/png',
    'Access-Control-Allow-Origin': '*',
    'Cache-Control': 'public, max-age=86400',
  })
  res.end(buf)
})

app.listen(PORT, () => {
  console.log(`高亮瓦片服务已启动: http://localhost:${PORT}/tiles/{z}/{x}/{y}.png`)
})
2.3 前端叠加瓦片
js
function addHighlightTileLayer() {
  viewer.imageryLayers.addImageryProvider(
    new Cesium.UrlTemplateImageryProvider({
      url: 'http://localhost:3001/tiles/{z}/{x}/{y}.png',
      maximumLevel: 18,
      enablePickFeatures: false,
    }),
  )
}
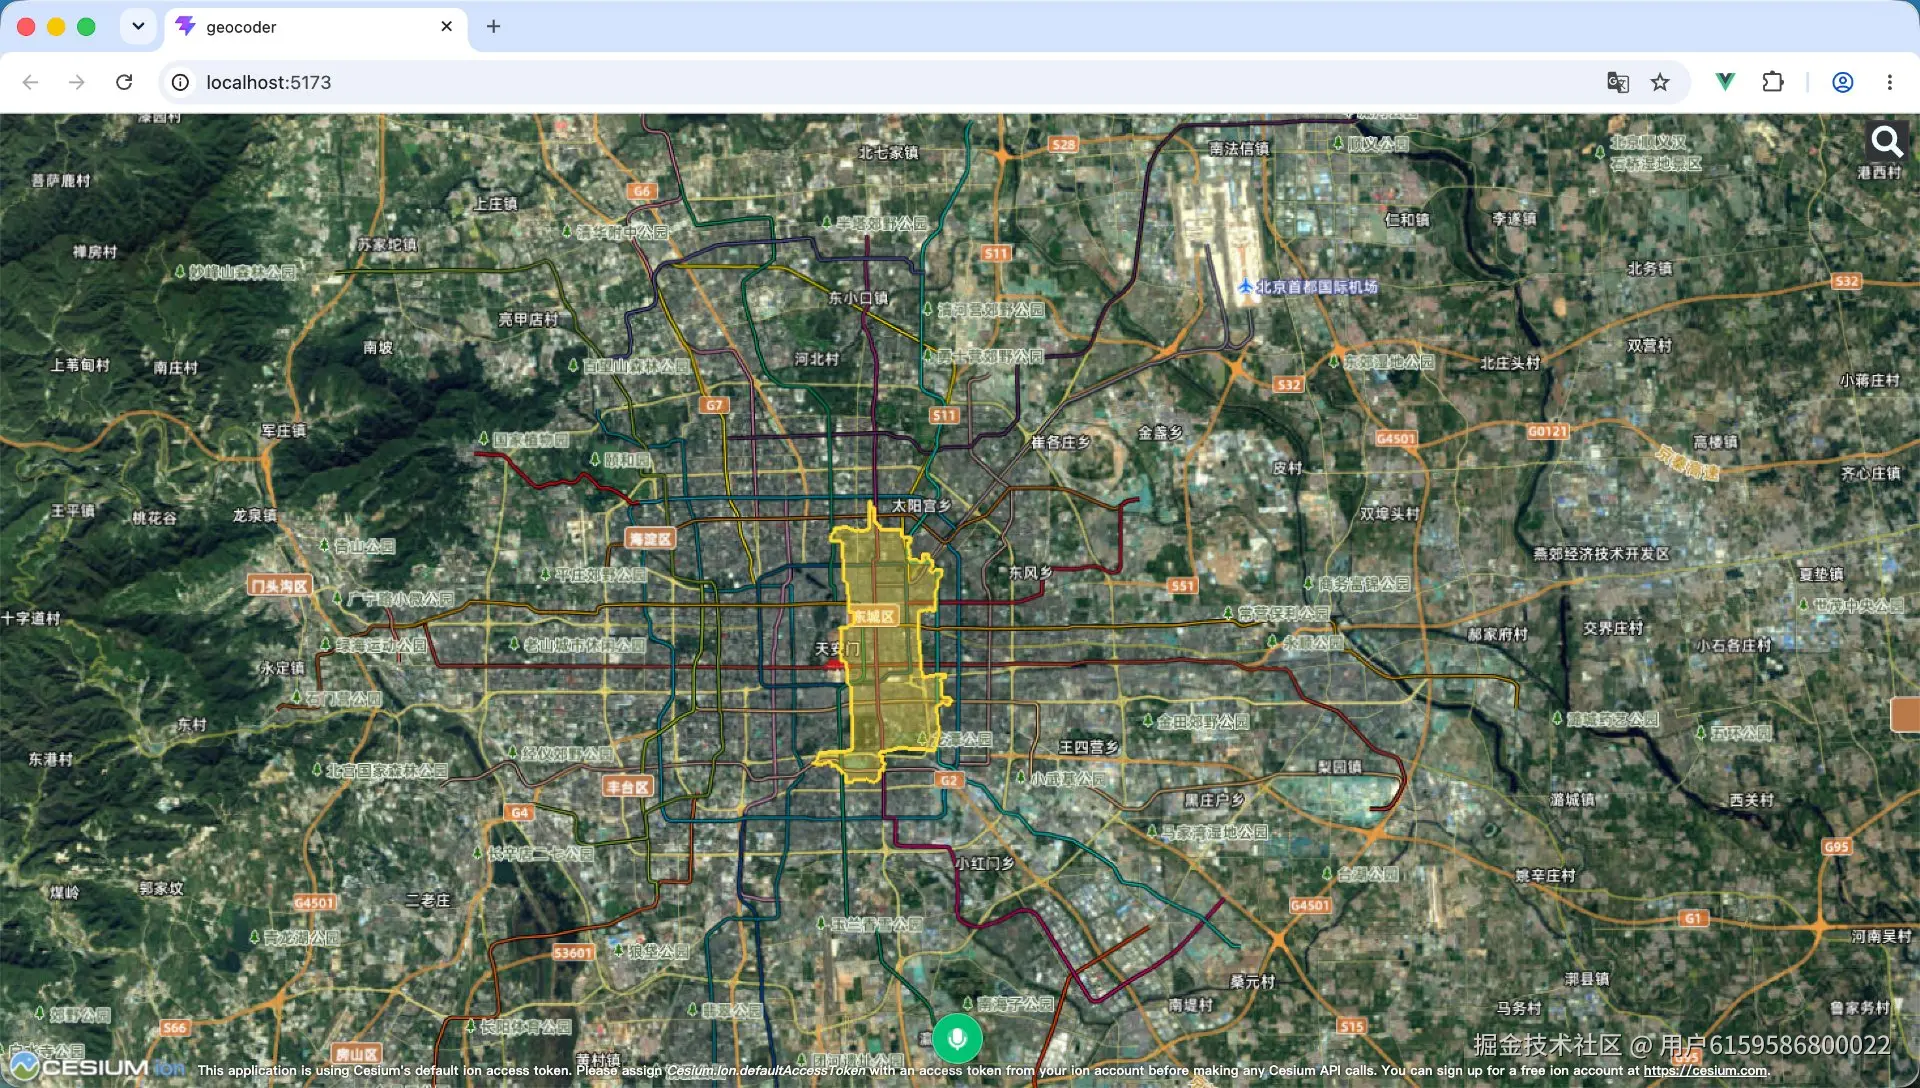
2.4 实现效果
效果与方法一基本一致,但高亮内容由后端瓦片服务提供:
三、两种方案对比
| 维度 | 前端 Entity / GeoJSON | 后端瓦片遮罩 |
|---|---|---|
| 实时改颜色/透明度 | ✅ 直接改 Entity 属性 | ❌ 需要后端重切瓦片 |
| 支持鼠标交互 | ✅ 方便绑定 pick/click | ❌ 不易做逐区域交互 |
| 大数据量边界 | ⚠️ 需抽稀或切块 | ✅ 后端光栅化,前端无压力 |
| 部署成本 | 低(纯前端) | 高(需瓦片服务) |
| 首次加载 | 下载完整 GeoJSON | 按视口按需加载瓦片 |
| 适用区域 | 区县、园区等小范围 | 省界、国界线等复杂大范围 |
建议:
- 普通业务需求、需要交互反馈 → 前端矢量高亮。
- 政务大屏、固定专题、边界极复杂 → 后端瓦片遮罩。
- 两种也可以混用:大范围用瓦片兜底,小范围精细区域再用 Entity 做交互。
四、3D Tiles / 倾斜摄影高亮
上述两种方法针对的是二维影像/矢量层面的区域高亮。如果要对倾斜摄影、BIM、点云等 3D Tiles 数据做单体高亮,需要用到
Cesium3DTileStyle、自定义 shader 或Cesium3DTileFeature的color属性,后续会单独写一篇详细讲解。
五、小结与下篇预告
本文讲了区域高亮的两种主流方案:
- 前端 Entity / GeoJSON 矢量高亮:适合交互频繁、区域不大的场景,代码简单,颜色透明度随时可调。
- 后端瓦片遮罩高亮:适合边界复杂、区域大的专题图,把光栅化压力转移到后端,前端只负责叠加瓦片。