精彩专栏推荐订阅:在下方主页👇🏻👇🏻👇🏻👇🏻
💖🔥作者主页 :计算机毕设木哥🔥 💖
文章目录
- 一、项目介绍
- 二、视频展示
- 三、开发环境
- 四、系统展示
- 五、代码展示
- 六、项目文档展示
- 七、项目总结
- [<font color=#fe2c24 >大家可以帮忙点赞、收藏、关注、评论啦 👇🏻](#fe2c24 >大家可以帮忙点赞、收藏、关注、评论啦 👇🏻)
一、项目介绍
自动驾驶与辅助驾驶上路后,事故报告量逐年增加,监管方和研究者却常面对「数字多、叙述散、成因难归纳」的困境------年度趋势、地域差异、系统类别、文本里反复出现的致因词,缺少一条从原始报告到可视化结论的贯通路径。本文通过开发一个基于大数据与文本挖掘的自动驾驶事故成因分析及可视化研究系统,用以帮助解决 NHTSA 事故数据分散难读、文本成因难以结构化呈现的问题。
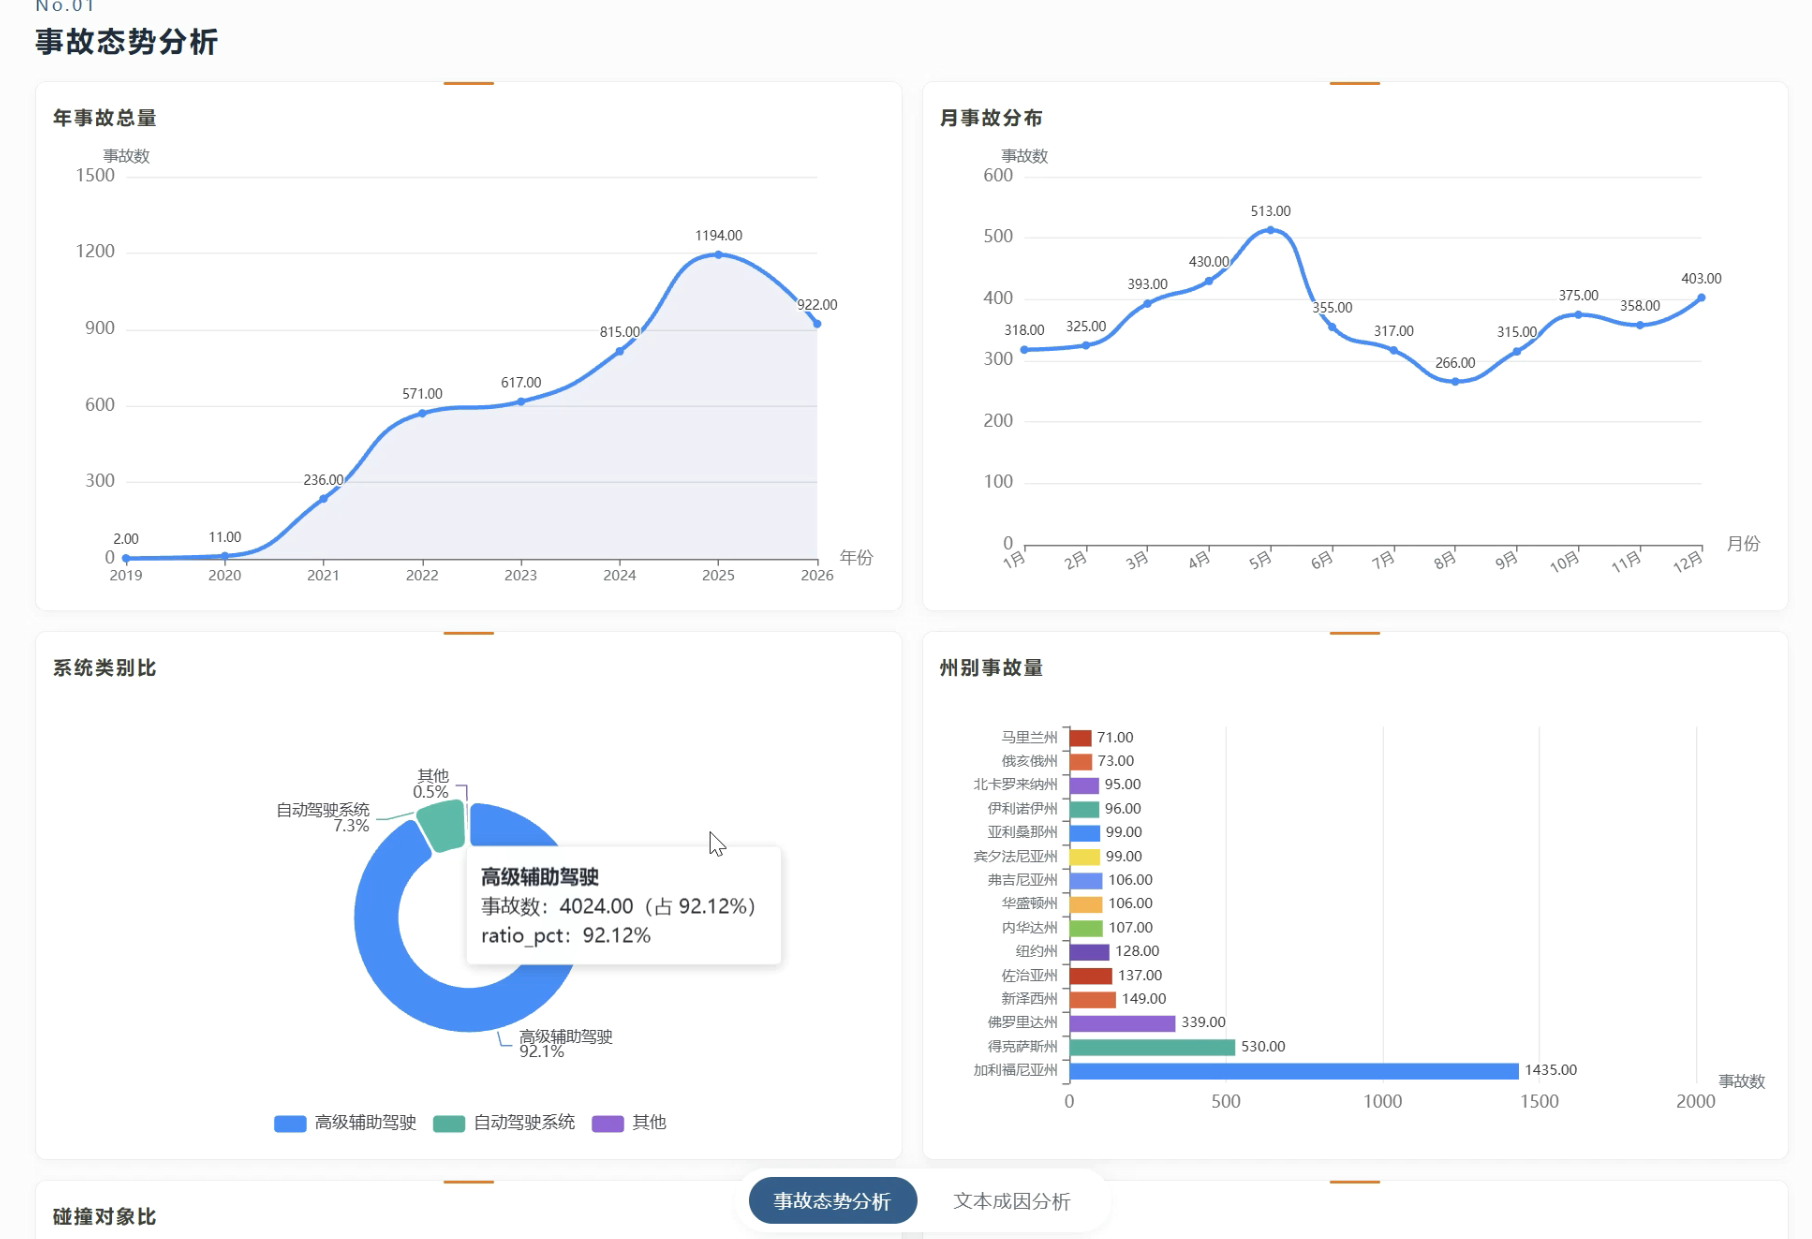
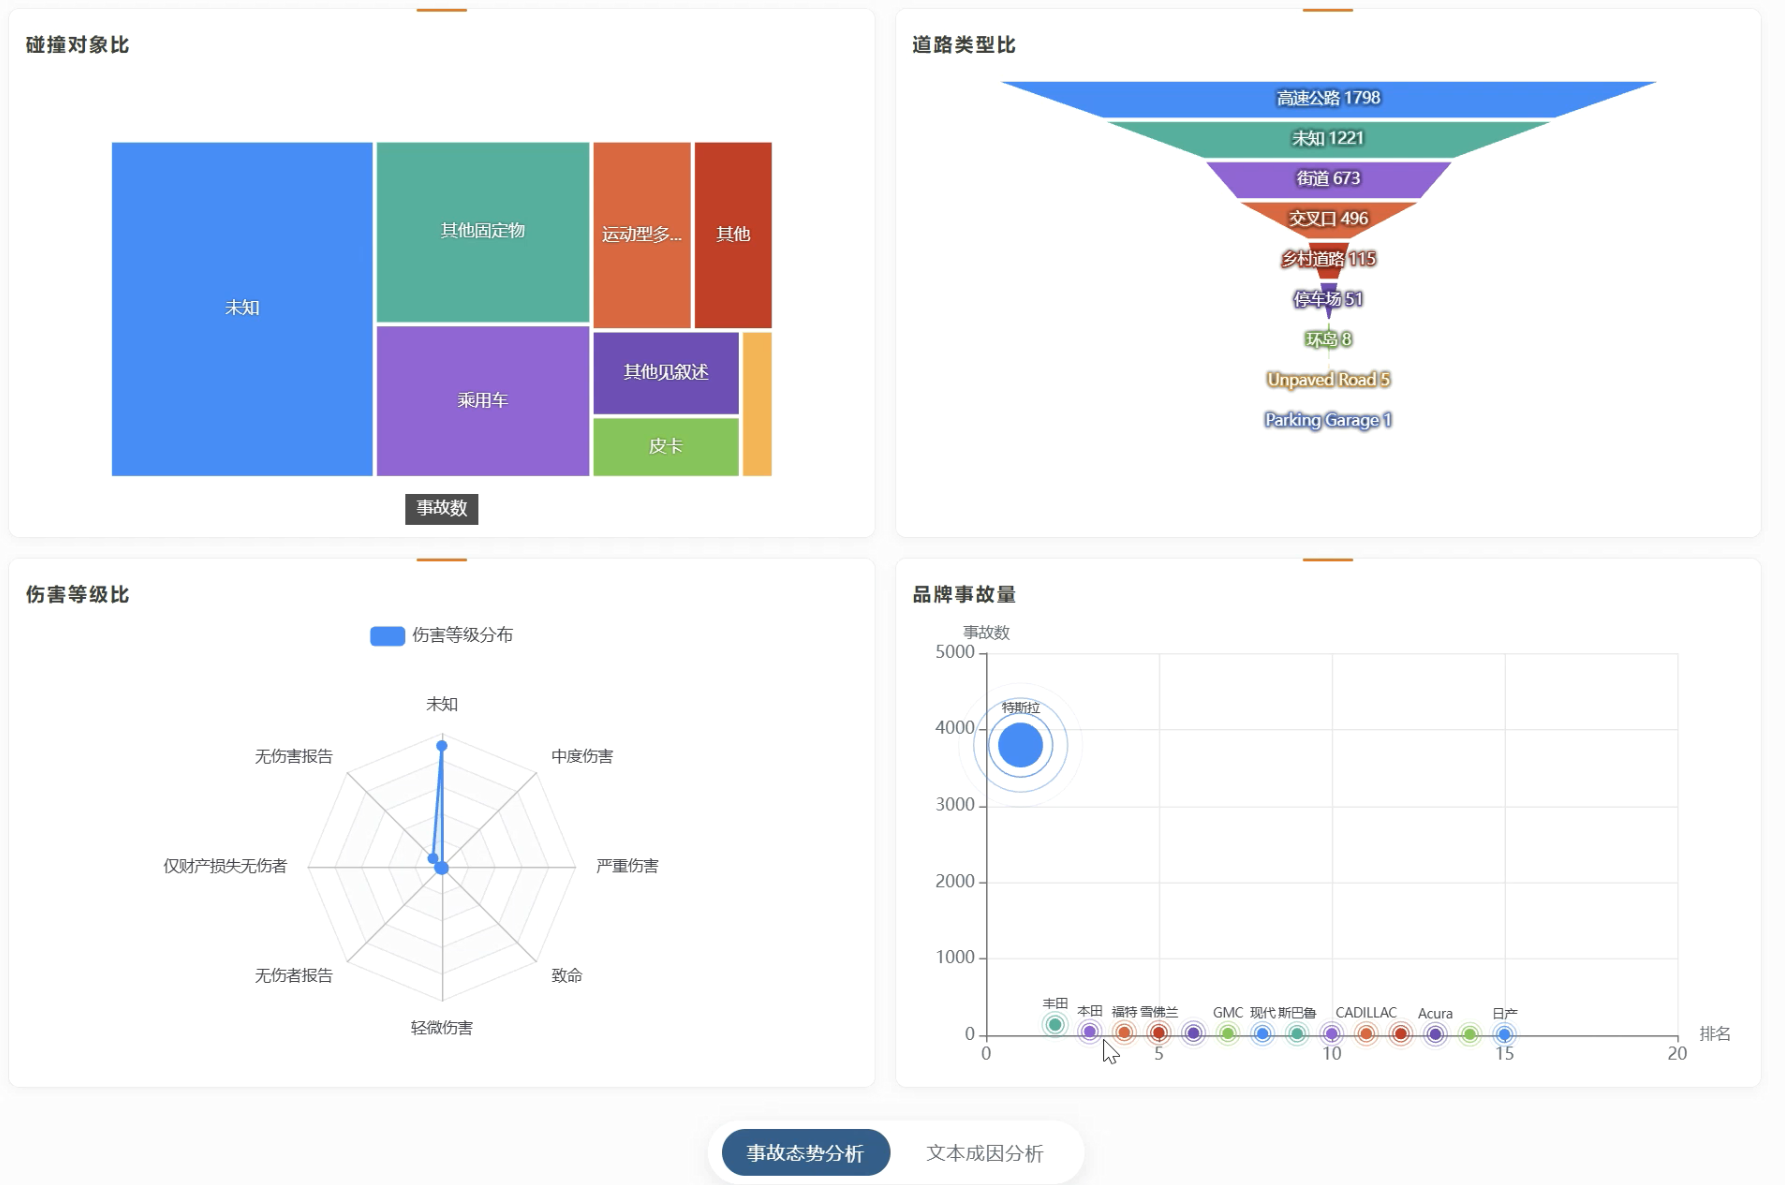
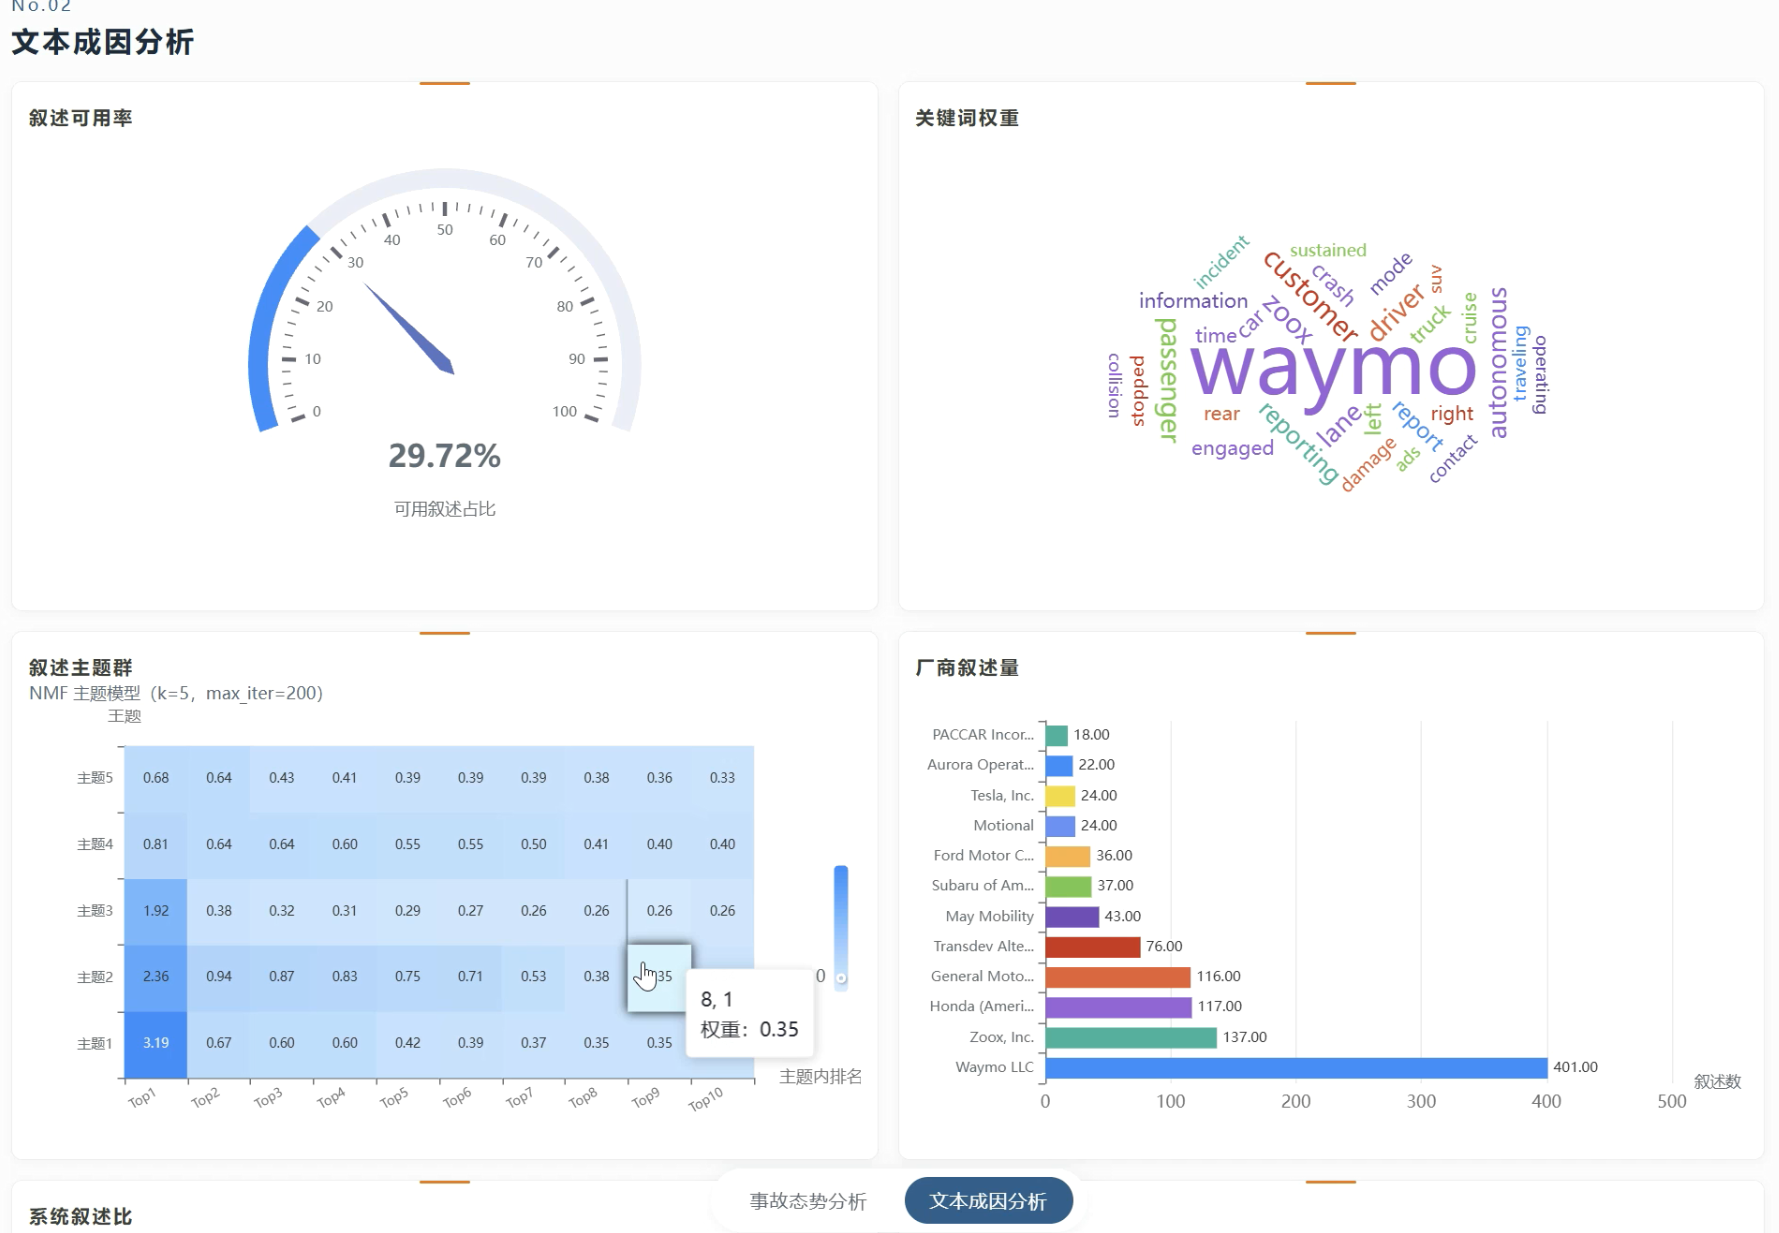
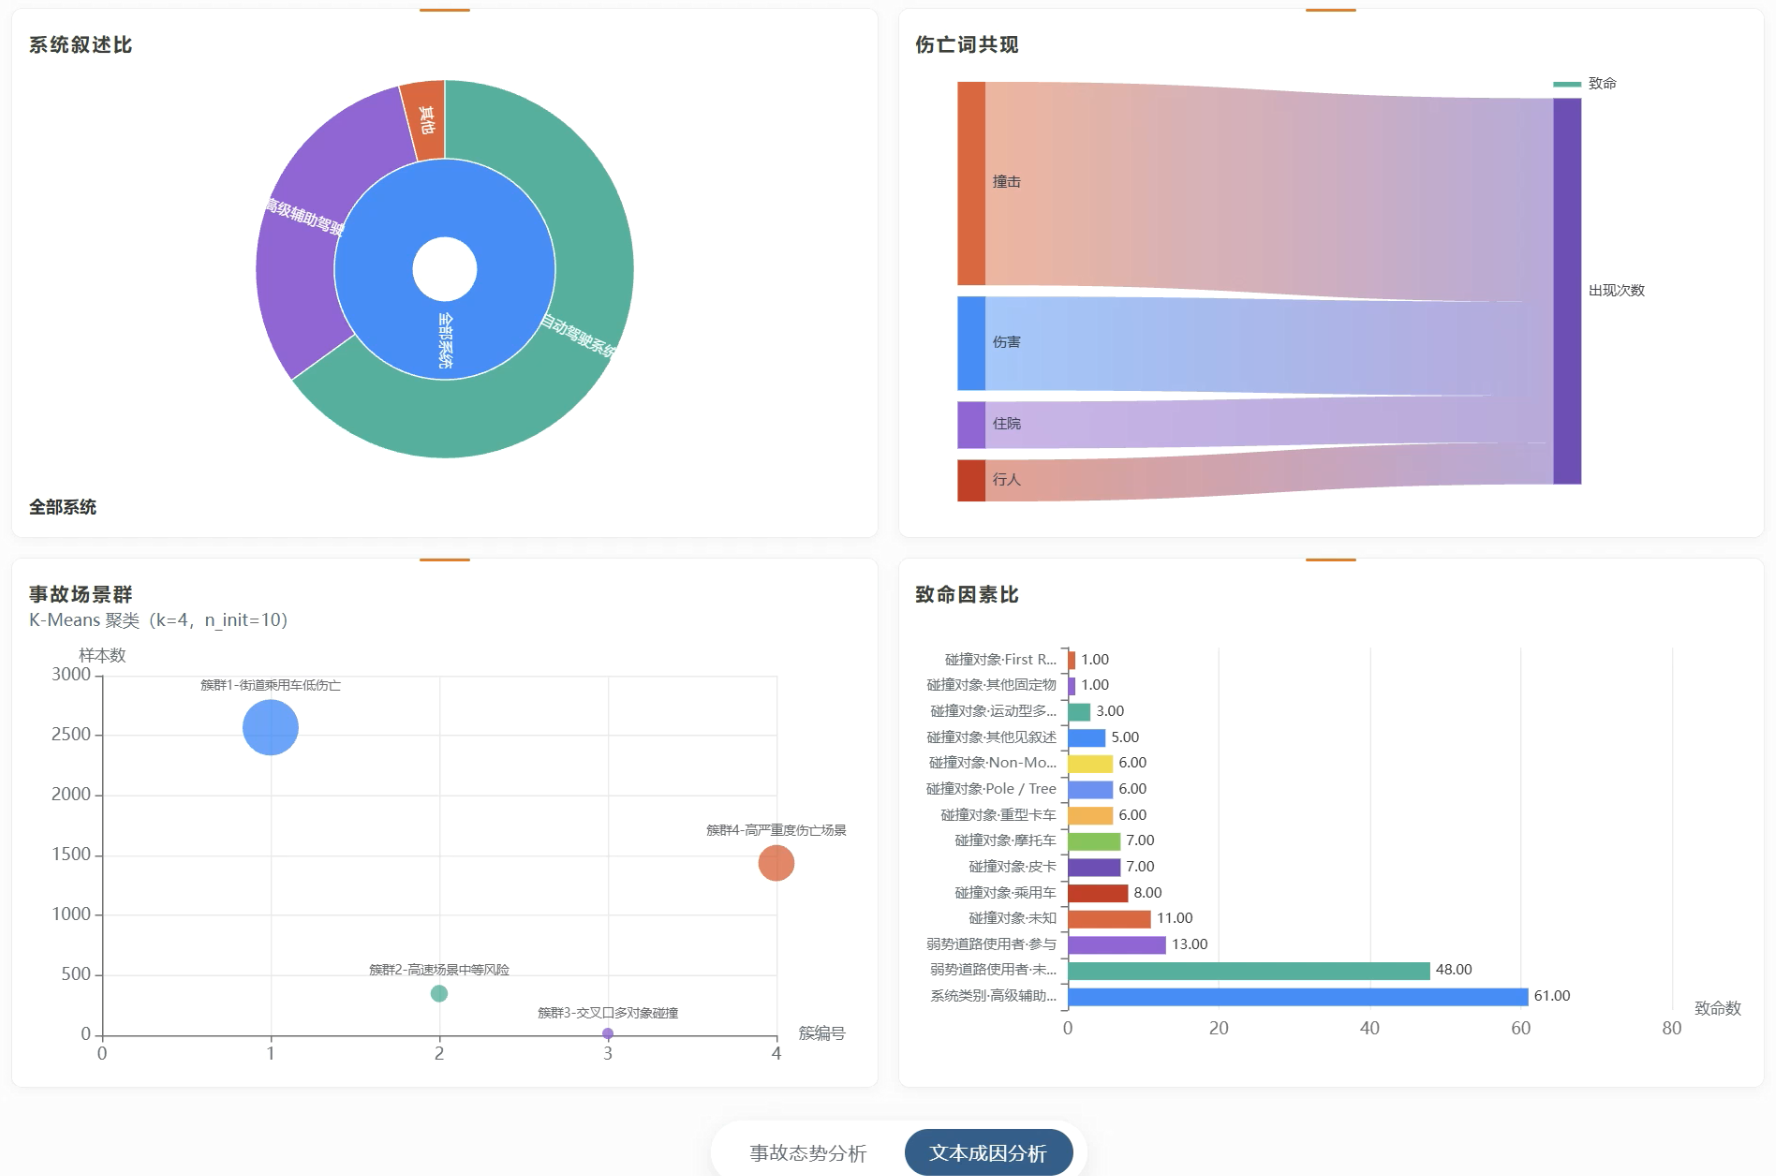
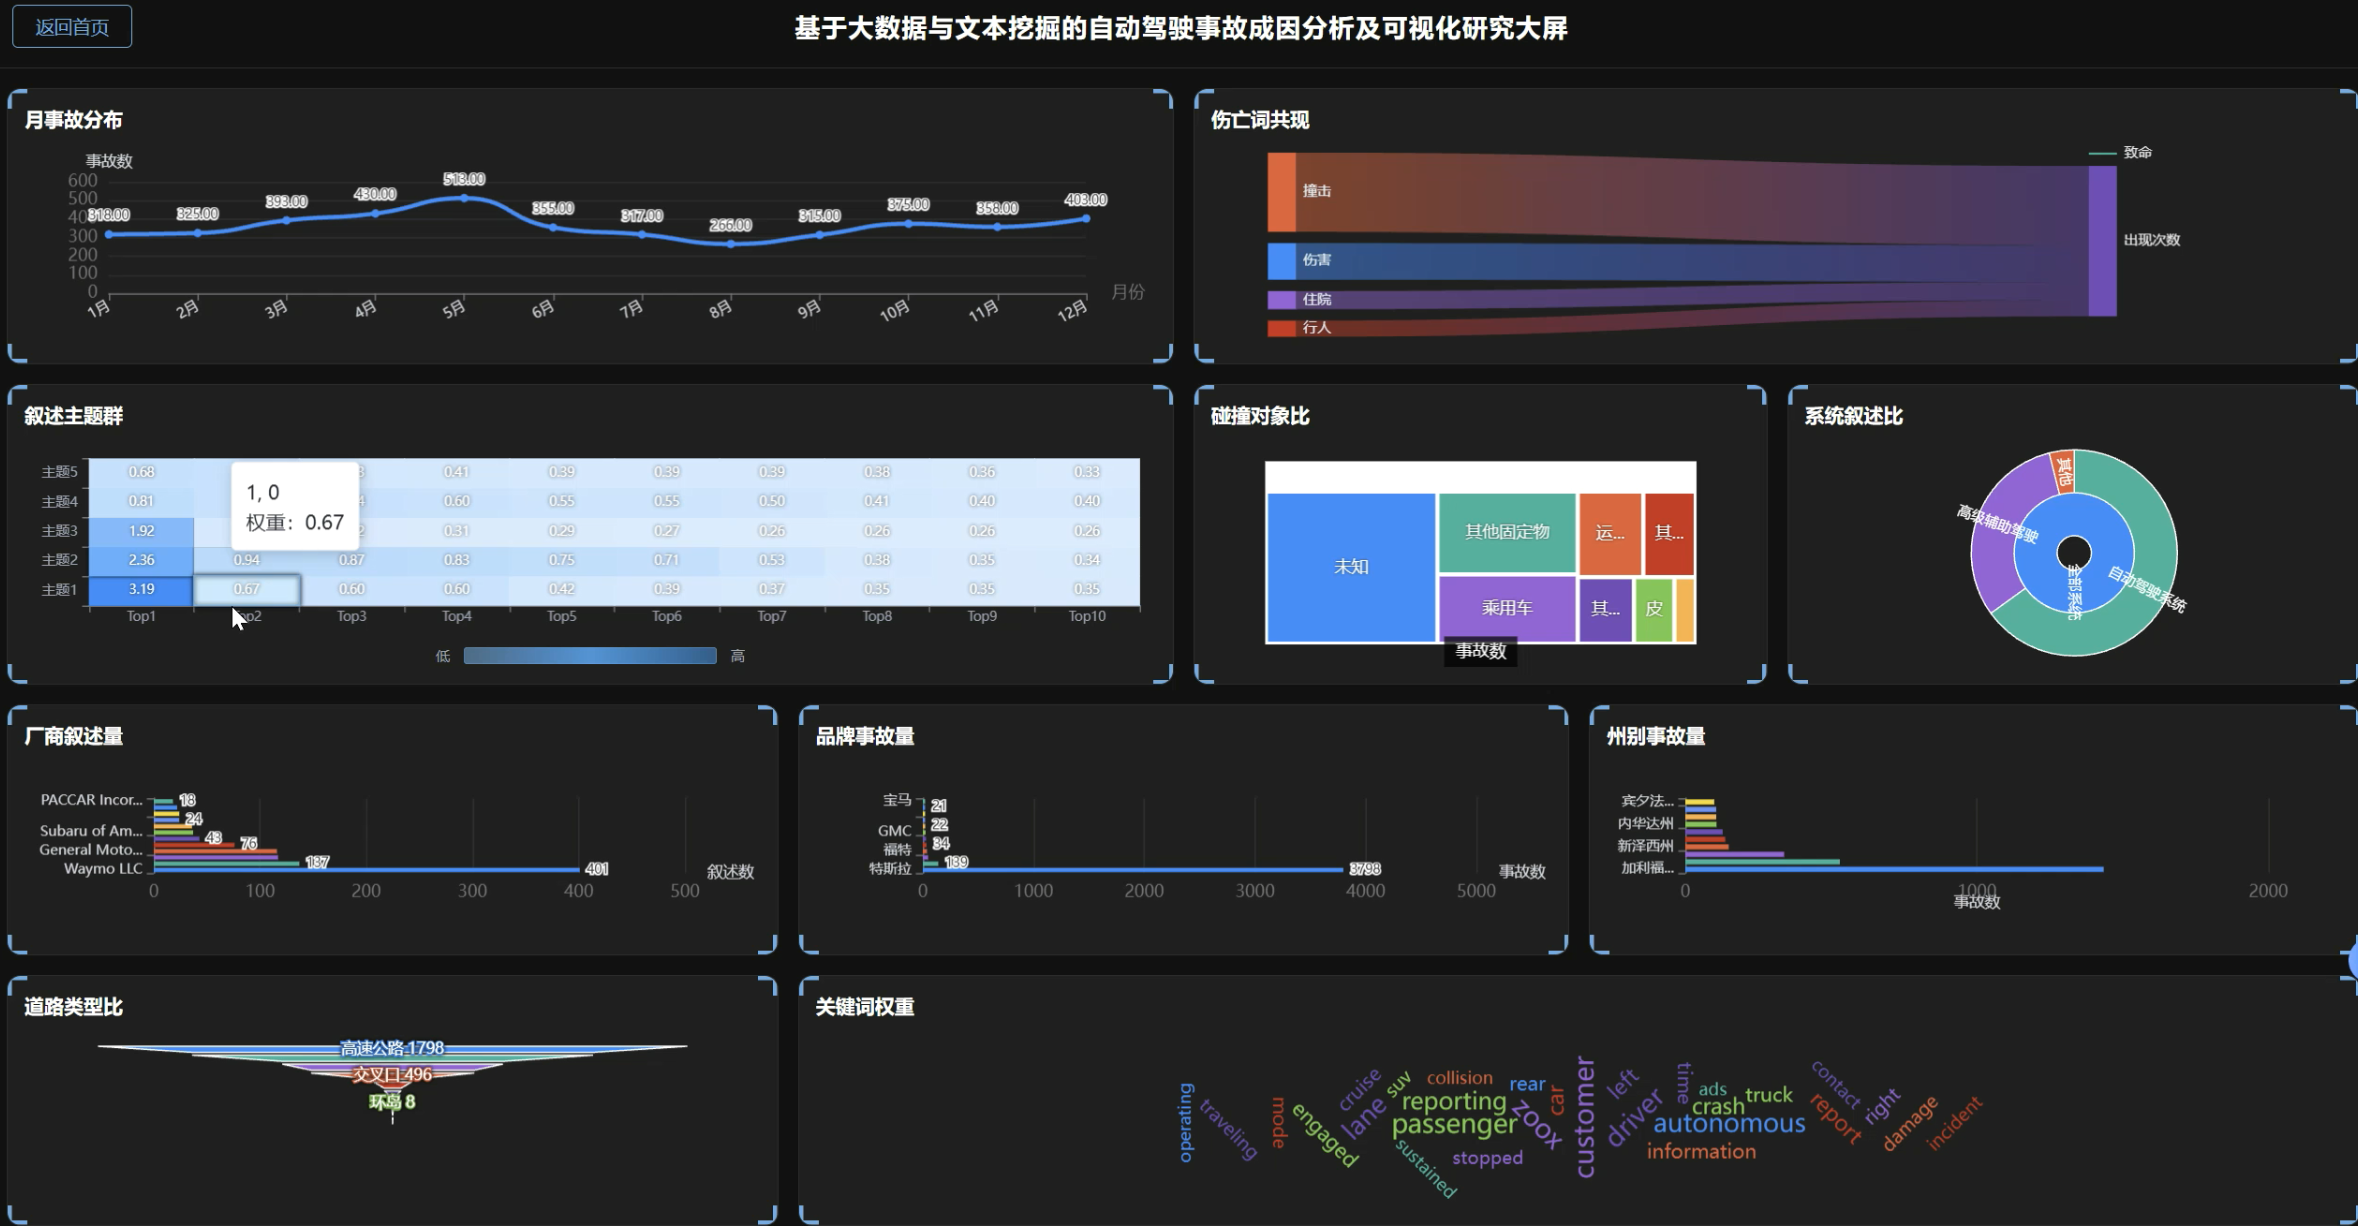
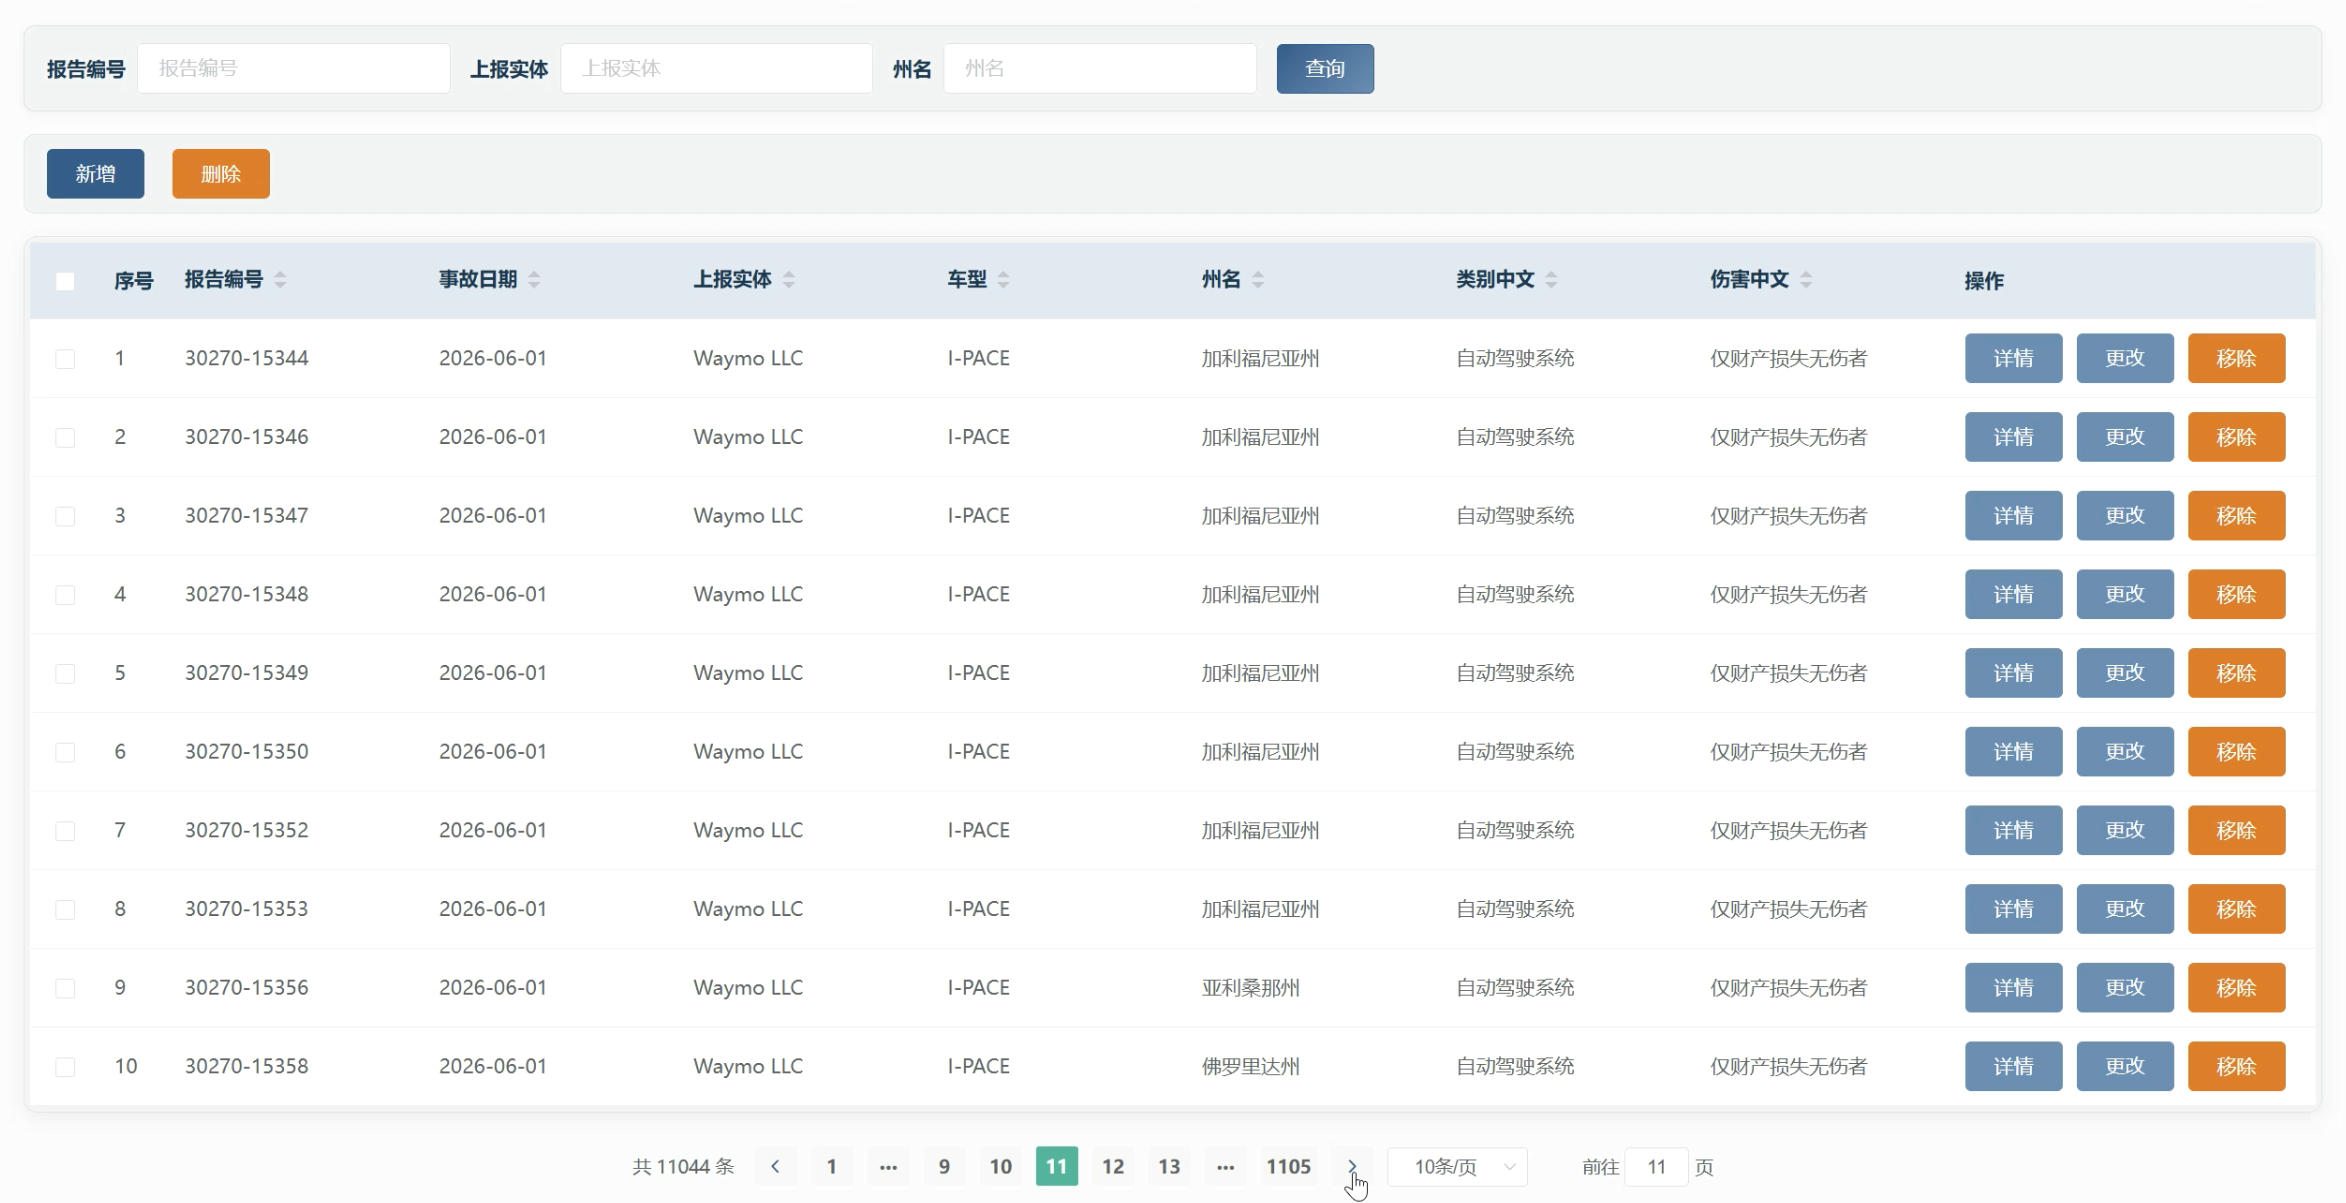
系统以 Hadoop 存储、PySpark 3.3.2 执行 16 项 Spark 分析,预处理阶段用 pandas 清洗五套 CSV、映射中文展示字段并标记有效事故子集;文本侧采用 TF-IDF 提取关键词权重,NMF 主题模型(k=5)发现叙述主题群,K-Means(k=4)对道路类型、碰撞对象、伤亡标记等多维特征做场景聚类。后端 Django 2.0 + MySQL 封装分析接口与五表 CRUD,前端 Vue2 + Element UI + ECharts 5.5 实现事故态势分析(年总量、月分布、系统类别、州别排名、碰撞对象、道路类型、伤害等级、品牌排名)、文本成因分析(叙述可用率、词云、主题热力、厂商叙述、系统叙述、伤亡词共现、场景散点、致命因素),以及十图态势大屏与底层数据管理。
经过系统测试,本网站能把万级事故记录和七千条叙述文本转成可浏览的图表与分群结果,方便交通监管人员、自动驾驶研究人员和计算机专业学生做事故态势对比、文本成因梳理和答辩演示,对「大数据 + 文本挖掘 + 可视化」类毕设也具备一定的参考意义。
二、视频展示
三、开发环境
- 大数据技术:Hadoop、Spark、Hive
- 开发技术:Python、Django框架、Vue、Echarts
- 软件工具:Pycharm、DataGrip、Anaconda
- 可视化 工具 Echarts
四、系统展示
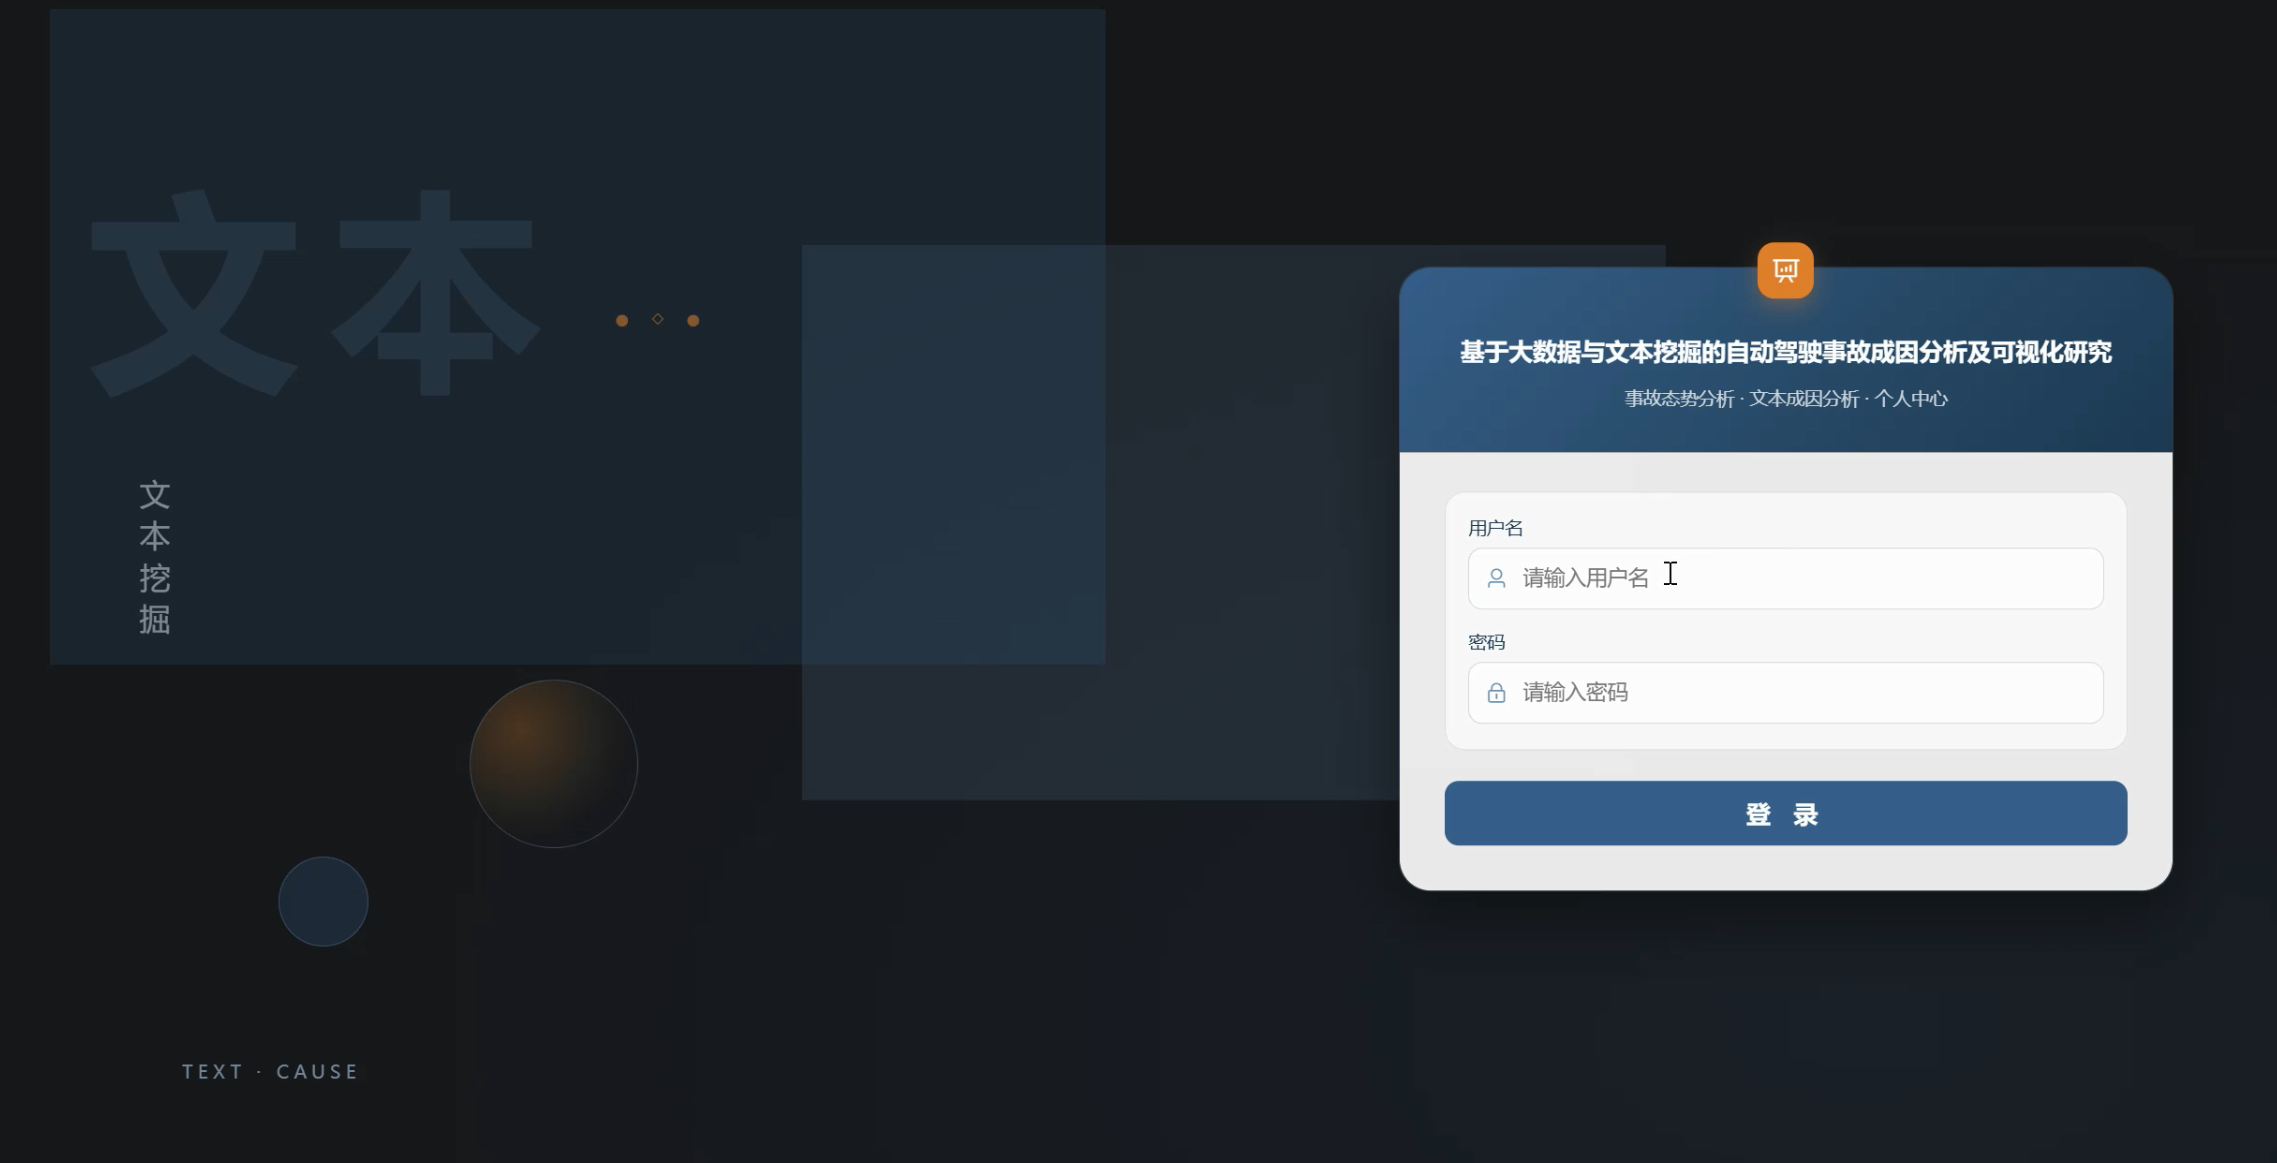
系统页面模块展示:
五、代码展示
bash
PLACEHOLDER_REPORT_TYPE = 'No New or Updated Incident Reports'

def mark_valid_incident(df):
    # 占位报告(无新事故)+ 缺事故日期 → 不计入有效事故
    incident_date_ok = df['incident_date'].notna() & (
        df['incident_date'].astype(str).str.strip() != ''
    ) & (df['incident_date'].astype(str).str.lower() != 'nan')
    report_ok = df['report_type'].astype(str) != PLACEHOLDER_REPORT_TYPE
    df['is_valid_incident'] = (incident_date_ok & report_ok).astype(int)
    return df


def preprocess_incident_table(df, label):
    global _CITY_LABEL_MAP
    _CITY_LABEL_MAP = {}
    row_count = len(df)
    logger.info(f'{label} 读取行数: {row_count}')

    # 日期规范化
    for col_name in ['report_submission_date', 'incident_date']:
        if col_name in df.columns:
            missing_before = df[col_name].isna().sum()
            df[col_name] = df[col_name].apply(format_date_string)
            missing_after = df[col_name].isna().sum()
            logger.info(
                f'{label} {col_name} 缺失: 处理前 {missing_before} → 处理后 {missing_after}'
            )

    # 数值字段
    if 'incident_year' in df.columns:
        df['incident_year'] = pd.to_numeric(df['incident_year'], errors='coerce').round(0)
    if 'incident_month' in df.columns:
        df['incident_month'] = pd.to_numeric(df['incident_month'], errors='coerce').round(0)
    if 'model_year' in df.columns:
        df['model_year'] = pd.to_numeric(df['model_year'], errors='coerce').round(2)

    # 州 / 系统类别 / 道路 / 碰撞对象 / 伤害等级 → 中文展示列
    if 'state' in df.columns:
        state_missing_before = df['state'].isna().sum()
        df['state_cn'] = df['state'].apply(map_state_cn)
        state_missing_after = df['state_cn'].isna().sum()
        logger.info(
            f'{label} state 缺失: 处理前 {state_missing_before} → 处理后 {state_missing_after}'
        )

    if 'automation_category' in df.columns:
        df['automation_category_cn'] = df['automation_category'].apply(map_automation_cn)
    if 'roadway_type' in df.columns:
        df['roadway_type_cn'] = df['roadway_type'].apply(map_roadway_cn)
    if 'crash_with' in df.columns:
        df['crash_with_cn'] = df['crash_with'].apply(map_crash_with_cn)

    if 'highest_injury_severity_alleged' in df.columns:
        injury_missing_before = df['highest_injury_severity_alleged'].isna().sum()
        df['injury_severity_cn'] = df['highest_injury_severity_alleged'].apply(
            map_injury_severity_cn
        )
        injury_missing_after = df['injury_severity_cn'].eq('未报告').sum()
        logger.info(
            f'{label} 伤害等级缺失: 处理前 {injury_missing_before} → 未报告桶 {injury_missing_after}'
        )

    if 'make' in df.columns:
        make_missing_before = df['make'].isna().sum()
        df['make_cn'] = df['make'].apply(map_make_cn)
        make_missing_after = df['make_cn'].isna().sum()
        logger.info(
            f'{label} make 缺失: 处理前 {make_missing_before} → 处理后 {make_missing_after}'
        )

    # 布尔列统一 0/1
    for col_name in BOOL_COLUMNS_INCIDENT:
        if col_name in df.columns:
            df[col_name] = bool_to_int(df[col_name])

    if 'has_injury' in df.columns:
        df['has_injury'] = df['has_injury'].apply(
            lambda x: 1 if str(x).lower() in ('true', '1', 'yes') else (
                0 if str(x).lower() in ('false', '0', 'no') else np.nan
            )
        )

    df = mark_valid_incident(df)
    valid_count = int(df['is_valid_incident'].sum())
    logger.info(f'{label} 有效事故标记: {valid_count} 条')

    df = finalize_geo_columns(df)
    df = finalize_brand_columns(df)
    return df


def preprocess_narrative_table(df):
    global _CITY_LABEL_MAP
    _CITY_LABEL_MAP = {}
    row_count = len(df)
    logger.info(f'nhtsa_incident_narrative 读取行数: {row_count}')

    if 'incident_date' in df.columns:
        df['incident_date'] = df['incident_date'].apply(format_date_string)

    df['state_cn'] = df['state'].apply(map_state_cn)
    df['automation_category_cn'] = df['automation_category'].apply(map_automation_cn)
    df['make_cn'] = df['make'].apply(map_make_cn)

    # 清洗叙述文本并标记可用叙述(过短 / 纯脱敏占位不进文本挖掘)
    narrative_missing_before = df['narrative'].isna().sum()
    df['narrative'] = df['narrative'].apply(clean_narrative_text)
    df['narrative_usable'] = df['narrative'].apply(is_narrative_usable)
    usable_count = int(df['narrative_usable'].sum())
    logger.info(
        f'narrative 不可用: 处理前缺失 {narrative_missing_before} → 可用叙述 {usable_count} 条'
    )

    df = finalize_geo_columns(df)
    df = finalize_brand_columns(df)
    return df
六、项目文档展示

七、项目总结
本课题围绕 NHTSA 自动驾驶事故报告,完成了「基于大数据与文本挖掘的自动驾驶事故成因分析及可视化研究」系统。针对事故记录体量大、叙述文本分散、成因难归纳等问题,采用 Hadoop 存储与 PySpark 完成数据预处理及 16 项分析,文本侧用 TF-IDF 提取关键词、NMF 主题模型归纳叙述主题,并用 K-Means 对道路类型、碰撞对象、伤亡等特征做场景分群。后端以 Django 与 MySQL 提供分析接口和五表数据管理,前端以 Vue2、Element UI、ECharts 实现事故态势分析、文本成因分析与态势大屏。系统将万级事故与数千条叙述转化为可浏览的图表与分群结果,可为监管研究、教学演示和同类毕设提供参考。
大家可以帮忙点赞、收藏、关注、评论啦 👇🏻
💖🔥作者主页 :计算机毕设木哥🔥 💖