广义傅里叶族变换是一种时频变换方法,傅里叶变换、短时傅里叶变换、S变换和许多小波变换都是其特殊情况,完整代码及子函数如下,很容易读懂:
Matlab
% Run a demo by creating a signal, transforming it, and plotting the results

	% Create a fake signal
	N = 256;
	x = linspace(0,1,N);
	sig = zeros(1,length(x));

	% signal example 1 (a single delta)
	sig(N/2) = 1.0;

	% signal example 2 (a mixture of sinusoids and a delta)
	% sig(1:N/2) += (sin((N/16)*2*pi*x)*1.0)(1:N/2);
	% sig(N/2+1:N) += (cos((N/8)*2*pi*x)*1.0)(N/2+1:N);
	% sig(2*N/16+1:3*N/16) += (sin((N/4)*2*pi*x)*1.0)(2*N/16+1:3*N/16);
	% sig(N/2+N/4+1) = 2.0;

	% Do the transform
	partitions = octavePartitions(N);
	windows = boxcarWindows(partitions);
	SIG = GFT(sig,partitions,windows);

	% Interpolate to get a spectrogram
	% The third and fourth parameters set the time and frequency axes respectively,
	% and can be changed to raise or lower the resolution, or zoom in on
	% a feature of interest
	spectrogram = interpolateGFT(SIG,partitions,1024,1024);

	% Display
	figure();
	subplot(3,1,1);
	plot(x,sig,'DisplayName','signal');
	legend('Location','northeast')
	ax = subplot(3,1,2);
	hold on;
	for p = partitions
	    line([x(p),x(p)],[0,max(abs(SIG))],'Color',[1 0 0],'linestyle','--');
	end
	p = plot(x,abs(SIG),'DisplayName','SIGNAL');
	legend(p,'Location','northeast');
	subplot(3,1,3);
	imagesc(abs(spectrogram));


%%
function partitions = octavePartitions(N)
    widths = 2.^(0:round(log(N)/log(2)-2));
    widths = [1,widths,flip(widths)];
    partitions = [0,cumsum(widths)]+1;
end

%%
function widths = partitionWidths(partitions)
    widths = circshift(partitions,-1) - partitions;
    widths(length(partitions)) = widths(length(partitions)) + max(partitions);
end

%%
function windows = boxcarWindows(partitions)
    windows = ones(1,max(partitions));
end

%%
function SIG = GFT(sig,partitions,windows)
    SIG = fft(complex(sig));
    SIG = SIG.*windows;
    for p = 1:(length(partitions)-1)
        SIG(partitions(p):partitions(p+1)-1) = ifft(SIG(partitions(p):partitions(p+1)-1));
    end
end

%%
function spectrogram = interpolateGFT(SIG,partitions,tAxis,fAxis,method)
    % Interpolate a 1D GFT onto a grid. If axes is specified it should be a
    % list or tuple consisting of two arrays, the sampling points on the time and frequency
    % axes, respectively. Alternatively, M can be specified, which gives the number
    % of points along each axis.

    % introduced in R2019 is the arguments block
    % https://www.mathworks.com/help/matlab/ref/arguments.html
%     arguments
%         SIG;
%         partitions;
%         tAxis;
%         fAxis;
%         method (1,:) char = 'linear';
%     end


     % if you don't have have the arguments block, then you can still do input defaults like this:
    if nargin<5
        method = 'linear';
    end

		% Caller specified M rather than the actual sampling points
		if length(tAxis) == 1
			tAxis = 1:length(SIG) / tAxis:length(SIG);
			% Centre the samples
			tAxis = tAxis + (length(SIG) - tAxis(length(tAxis))) / 2;
		end

		if length(fAxis) == 1
			fAxis = 1:length(SIG) / fAxis:length(SIG);
			% Centre the samples
			fAxis = fAxis + (length(SIG) - fAxis(length(fAxis))) / 2;
		end

    N = length(SIG);
    widths = partitionWidths(partitions);
    spectrogram = complex(length(partitions),zeros(length(tAxis)));
    % interpolate each frequency band in time
    for p = 1:length(partitions)
        % indices of sample points, plus 3 extra on each side in case of cubic interpolation
        indices = (-3:widths(p)+2);
        % time coordinates of samples
        t = indices .* (N/widths(p));
        % values at sample points
        if (p < length(partitions))
            temp = SIG(partitions(p):partitions(p+1)-1);
            f = temp(mod(indices,widths(p))+1);
        else
            temp = SIG(partitions(p):N);
            f = temp(mod(indices,widths(p))+1);
        end
        if (length(f) > 1)
            spectrogram(p,:) = interp1(t,f,tAxis,method);
        else
            spectrogram(p,:) = f;
        end
    end

    % Interpolate in frequency
    indices = mod(-3:length(partitions)+2,length(partitions));
    f = partitions(indices+1) + widths(indices+1)/2;
    f(1:3) = f(1:3) - N;
    f(length(f)-2:length(f)) = f(length(f)-2:length(f)) + N;
    t = spectrogram(indices+1,:);
    spectrogram = interp1(f,t,fAxis,method);
end

function [sig,partitions,windows,SIG] = demo()
	% Run a demo by creating a signal, transforming it, and plotting the results

	% Create a fake signal
	N = 256;
	x = linspace(0,1,N);
	sig = zeros(1,length(x));

	% signal example 1 (a single delta)
	sig(N/2) = 1.0;

	% signal example 2 (a mixture of sinusoids and a delta)
	% sig(1:N/2) += (sin((N/16)*2*pi*x)*1.0)(1:N/2);
	% sig(N/2+1:N) += (cos((N/8)*2*pi*x)*1.0)(N/2+1:N);
	% sig(2*N/16+1:3*N/16) += (sin((N/4)*2*pi*x)*1.0)(2*N/16+1:3*N/16);
	% sig(N/2+N/4+1) = 2.0;

	% Do the transform
	partitions = octavePartitions(N);
	windows = boxcarWindows(partitions);
	SIG = GFT(sig,partitions,windows);

	% Interpolate to get a spectrogram
	% The third and fourth parameters set the time and frequency axes respectively,
	% and can be changed to raise or lower the resolution, or zoom in on
	% a feature of interest
	spectrogram = interpolateGFT(SIG,partitions,1024,1024);

	% Display
	figure();
	subplot(3,1,1);
	plot(x,sig,'DisplayName','signal');
	legend('Location','northeast')
	ax = subplot(3,1,2);
	hold on;
	for p = partitions
	    line([x(p),x(p)],[0,max(abs(SIG))],'Color',[1 0 0],'linestyle','--');
	end
	p = plot(x,abs(SIG),'DisplayName','SIGNAL');
	legend(p,'Location','northeast');
	subplot(3,1,3);
	imagesc(abs(spectrogram));
end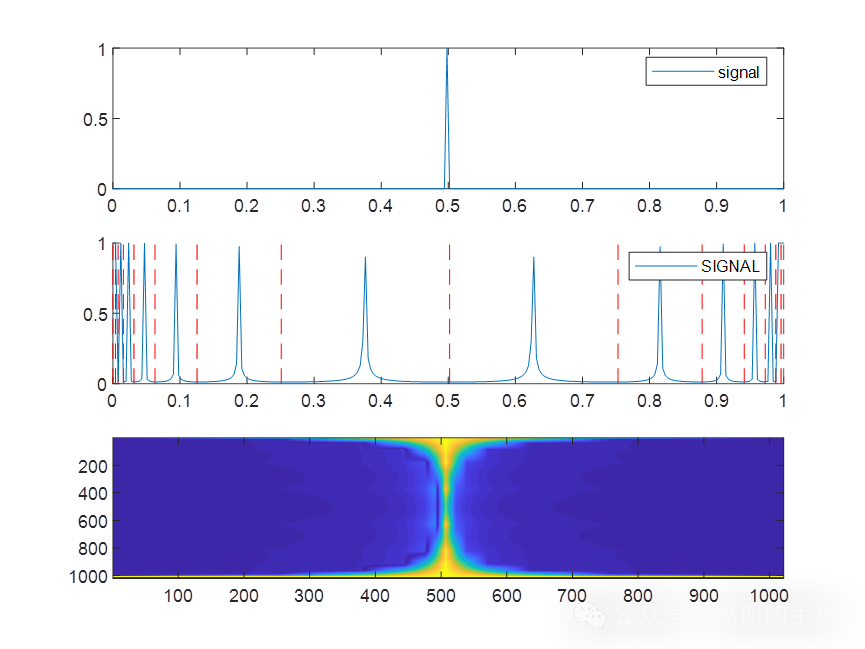
工学博士,担任《Mechanical System and Signal Processing》《中国电机工程学报》《控制与决策》等期刊审稿专家,擅长领域:现代信号处理,机器学习,深度学习,数字孪生,时间序列分析,设备缺陷检测、设备异常检测、设备智能故障诊断与健康管理PHM等。